Last close As at 05/08/2026
GBP2.58
▲ −3.00 (−1.15%)
Market capitalisation
GBP597m
Research: Investment Companies
Henderson Far East Income’s (HFEL) lead fund manager, Mike Kerley, welcomes the resumption of earnings growth in the region after five years of stagnation. He says that attractive opportunities still abound in his favoured areas of cash-generative companies offering high dividend growth potential or high yields, with the recent rise in P/E ratios across the region only partially addressing the longstanding undervaluation versus the rest of the world. The portfolio currently has a cyclical tilt, with more in financials and consumer stocks and less in utilities and telecoms, yet HFEL still pays a high yield (currently 5.4%), fully covered by income. The fund has tended to trade at a small premium to NAV and issues shares to meet demand. The recent introduction of a tiered management fee above £400m will reduce total expenses for investors as HFEL grows.
Written by
Henderson Far East Income |
Asian recovery sparks attractive opportunities |
Investment companies |
16 January 2018 |
Share price/discount performance
Three-year performance vs index
Gearing
Analysts
|
|||||||||||||||||||||||||||||||||||||||||||||||||||||||||||||||||||||||||||||||||||||||||||||
Henderson Far East Income’s (HFEL) lead fund manager, Mike Kerley, welcomes the resumption of earnings growth in the region after five years of stagnation. He says that attractive opportunities still abound in his favoured areas of cash-generative companies offering high dividend growth potential or high yields, with the recent rise in P/E ratios across the region only partially addressing the longstanding undervaluation versus the rest of the world. The portfolio currently has a cyclical tilt, with more in financials and consumer stocks and less in utilities and telecoms, yet HFEL still pays a high yield (currently 5.4%), fully covered by income. The fund has tended to trade at a small premium to NAV and issues shares to meet demand. The recent introduction of a tiered management fee above £400m will reduce total expenses for investors as HFEL grows.
12 months ending |
Share price (%) |
NAV (%) |
FTSE AW Asia Pacific ex-Japan (%) |
FTSE All World (%) |
FTSE All-Share (%) |
31/12/13 |
2.5 |
3.1 |
1.3 |
21.0 |
20.8 |
31/12/14 |
9.6 |
9.5 |
10.0 |
11.3 |
1.2 |
31/12/15 |
(5.7) |
(4.5) |
(3.5) |
4.0 |
1.0 |
31/12/16 |
26.1 |
23.4 |
28.7 |
29.6 |
16.8 |
31/12/17 |
16.9 |
19.0 |
23.4 |
13.8 |
13.1 |
Source: Thomson Datastream. Note: All % on a total return basis in GBP.
Investment strategy: Focused, total return portfolio
HFEL’s managers construct a portfolio of 40-60 stocks, broadly balanced between those on high starting yields and those with better dividend growth potential. Ideas may come from company meetings, industry research or quantitative screens. All potential investments are analysed using a variety of metrics; the aim is to identify well-managed, cash-generative companies whose share prices do not reflect the underlying business value. The managers currently favour domestically orientated companies that can benefit from Asian consumers’ increasing purchasing power.
Market outlook: Strong returns but risks remain
Stock markets worldwide have powered ahead in 2017, with Asian markets having provided some of the best returns after lagging the US, in particular, in recent years. This has led to forward P/E valuations above the five-year average, although pockets of value may still be found. At some point, market participants may begin to focus more on the potential risks than the promised rewards; at such a time, cash-generative companies that can reward shareholders through dividends could provide a relative haven.
Valuation: High yield underpins premium rating
At 12 January 2018, HFEL’s shares traded at a 2.2% premium to cum-income NAV. This is above the long-term average premium (a range of 0.3-1.4% over one, three, five and 10 years). HFEL’s board consistently issues new shares to meet investor demand, with growth in the number of shares in issue averaging c 3-5% a year. The strong demand is underpinned by HFEL’s very high yield, which at 5.4% (based on FY17 total dividends) is well above that of even income-focused peers.
Exhibit 1: Fund at a glance
Investment objective and fund background |
Recent developments |
||||||||||||||||||||||||||||||||||||||||||||||||||||||||||||||||||||||
Henderson Far East Income aims to provide investors with a high level of dividends and capital appreciation over the long term from a diversified portfolio of companies from the Asia-Pacific region. The fund is classified by the AIC in the Asia-Pacific ex-Japan category and, while it does not have a benchmark, sees the FTSE All World Asia Pacific ex-Japan index as providing the most appropriate comparator. While the fund can hold Japanese investments, they are not expected to be a substantial part of total assets. |
■ 13 December 2017: All resolutions passed at AGM. ■ 3 November 2017: Annual results for the year ended 31 August 2017. NAV TR +17.7% and share price TR +17.3% versus +23.7% for FTSE AW Asia Pacific ex-Japan index (all in sterling). ■ 26 October 2017: New tiered annual management fee from 1 September 2017 – 0.9% on net assets up to £400m and 0.75% thereafter. ■ 25 October 2017: Fourth interim dividend of 5.3p declared, bringing total dividends for the year to 20.8p (FY16: 20.0p). |
||||||||||||||||||||||||||||||||||||||||||||||||||||||||||||||||||||||
Forthcoming |
Capital structure |
Fund details |
|||||||||||||||||||||||||||||||||||||||||||||||||||||||||||||||||||||
AGM |
December 2018 |
Ongoing charges |
1.12% |
Group |
Janus Henderson Investors |
||||||||||||||||||||||||||||||||||||||||||||||||||||||||||||||||||
Interim results |
April 2018 |
Net gearing |
5.0% |
Manager |
Michael Kerley |
||||||||||||||||||||||||||||||||||||||||||||||||||||||||||||||||||
Year end |
31 August |
Annual mgmt fee |
Tiered (see page 8) |
Address |
201 Bishopsgate, |
||||||||||||||||||||||||||||||||||||||||||||||||||||||||||||||||||
Dividend paid |
Feb, May, Aug, Nov |
Performance fee |
None |
||||||||||||||||||||||||||||||||||||||||||||||||||||||||||||||||||||
Launch date |
2006 (as a Jersey co) |
Trust life |
Indefinite |
Phone |
+44 (0) 20 7818 1818 |
||||||||||||||||||||||||||||||||||||||||||||||||||||||||||||||||||
Continuation vote |
No |
Loan facilities |
£35m two years |
Website |
|||||||||||||||||||||||||||||||||||||||||||||||||||||||||||||||||||
Dividend policy and history (financial years) |
Share buyback policy and history (financial years) |
||||||||||||||||||||||||||||||||||||||||||||||||||||||||||||||||||||||
Dividends paid quarterly. The company aims to distribute substantially all its income (after costs) arising in each accounting period. |
HFEL is authorised to repurchase up to 14.99% of its ordinary shares, to hold up to 10% of shares in treasury, and to issue up to 10% of shares each year. |
||||||||||||||||||||||||||||||||||||||||||||||||||||||||||||||||||||||
|
|
||||||||||||||||||||||||||||||||||||||||||||||||||||||||||||||||||||||
Shareholder base (as at 31 October 2017) |
Portfolio exposure by geography (as at 30 November 2017) |
||||||||||||||||||||||||||||||||||||||||||||||||||||||||||||||||||||||
|
|
||||||||||||||||||||||||||||||||||||||||||||||||||||||||||||||||||||||
Top 10 holdings (as at 30 November 2017) |
|||||||||||||||||||||||||||||||||||||||||||||||||||||||||||||||||||||||
|
|||||||||||||||||||||||||||||||||||||||||||||||||||||||||||||||||||||||
Source: Henderson Far East Income, Edison Investment Research, Bloomberg, Morningstar. Note: *N/A where not in November 2016 top 10.
Market outlook: Asian recovery gathers pace
As shown in Exhibit 2 below (left-hand chart), Asia-Pacific equity markets had lagged world markets (where the index is dominated by the US) and the UK FTSE All-Share for much of the past five years, as investors focused more on the risks – particularly from the level of indebtedness in China – than the potential rewards. The acceleration of returns from the world and Asian indices from June 2016 was partly a result of the weakening in the pound sparked by the UK vote to leave the European Union, which boosted returns from overseas assets once translated back into sterling. However, since the Brexit vote, Asian equities have outperformed the FTSE All-World index as well as the All-Share, with a total return of 59.1% compared with 47.0% for the global index.
With many indices worldwide having powered ahead in 2017, valuations in some cases have begun to look stretched. In particular, as shown in the table below (right-hand side), the Datastream US index 12-month forward P/E is 14% above the five-year average. The MSCI Asia Pacific ex-Japan forward P/E is 8% above the five-year average, although it is important to note that this may be skewed by high valuations on some large stocks, such as the Chinese internet giants Alibaba and Tencent, which are on forward P/E ratios of more than 30x. A more value-focused investment approach, which still aims to capture the upside from better earnings growth in Asia, could shield investors from some of the risk that may come with such lofty valuations.
|
Exhibit 2: Market performance and valuation |
|||||||||||||||||||||||||||||||
Five-year total return index performance in sterling |
12-month forward P/E ratios (x) |
||||||||||||||||||||||||||||||
|
|
||||||||||||||||||||||||||||||
|
Source: Thomson Datastream, Edison Investment Research. Note: Valuations table uses Datastream UK, World and US indices. |
|||||||||||||||||||||||||||||||
Fund profile: Established Asian income specialist
Henderson Far East Income (HFEL) was launched in 2006 as a Jersey-registered successor vehicle to the Henderson Far East Income Trust. Its shares are listed on the London and New Zealand stock exchanges. The move offshore allowed the fund at the time to benefit from a more favourable tax rate on overseas earnings, as well as to convert its capital reserve to a revenue reserve to support the payment of a higher dividend, and HFEL is now comfortably the highest-yielding fund in its peer group. It has been managed since 2007 by Mike Kerley, director of pan-Asian equities at Janus Henderson Investors, supported by Sat Duhra and the wider Janus Henderson team.
HFEL aims to achieve growing dividends and capital appreciation by investing in companies that are either listed in, registered in, or whose principal business is in the Asia-Pacific region (including Japan, the Indian subcontinent and Australasia). Stocks listed in these markets must make up at least 80% of the total portfolio. The manager may also invest in debt securities, warrants and other equity-related securities such as unlisted companies that are soon to be listed.
The fund uses the FTSE Asia Pacific ex-Japan index as a performance comparator, although the portfolio is constructed without reference to any index. It is a member of the Association of Investment Companies’ Asia Pacific ex-Japan sector.
HFEL may gear up to 30% of gross assets, although its current borrowing facility was for only c 10% of net assets at the time of arrangement. The fund manager may generate additional premium income for the portfolio by writing options on stocks. Currency hedging is permitted, although the manager has not historically hedged currency exposure to any great extent.
The fund manager: Mike Kerley
The manager’s view: Better earnings picture could favour value
Kerley notes that for the first time in six years, Asian corporate earnings have grown in aggregate. Although P/E ratios have risen, the re-rating has only partially addressed the undervaluation across the region. However, he cautions that, with much of the strongest performance coming from a relatively small number of stocks in the areas of technology and financials, concentration in the market is high. From HFEL’s perspective, many of the strongest performers, such as Chinese internet stocks Alibaba, Baidu and Tencent, have no near-term prospect of paying dividends, as they are still investing heavily in growth, and as such are ineligible for inclusion in the portfolio, which has had an impact on relative performance.
However, the manager is still finding plenty of promising investment ideas at attractive valuations. He argues that many investors are overpaying for earnings growth. With company earnings enjoying a synchronised global recovery along with the economy, ‘quality growth’ is not as scarce as it once was, and the manager argues that investors should begin to understand that there is no longer a need to pay a premium for it, which could spark a rotation from growth to value stocks. Instead of chasing highly valued growth stocks, Kerley is concentrating on growth of income. He particularly focuses on the potential for dividend surprises; with payout ratios in most of the region still low at c 30-35%, there is every chance that dividend growth could match or even surpass earnings growth, which is forecast to exceed 20% in 2017. The HFEL portfolio is currently c 55% in stocks with high dividend growth potential and c 45% in high-yield stocks, versus a neutral position of 50/50, but Kerley says this split is unlikely to increase further because HFEL’s progressive dividend policy means a certain level of yield is required.
The relative yield and growth dynamics of India and China have led the manager to exit all his holdings in India – where the earnings trajectory is negative and yields are low, yet valuations are at all-time highs – and increase the weighting in China, where aggregate valuations are low and earnings are improving. Kerley argues that the political pull to centralise power in China should not be seen in a negative light, but rather as a way of making sure the best parts of China do as well as they can, building profitable, scalable state-owned enterprises and promoting Chinese brands and products, while closing down some of the most polluting companies in a bid to tackle environmental degradation.
A potential counter to Kerley’s general mood of cautious optimism is the extent to which investors are prepared to ignore geopolitical factors such as the situation in the Korean Peninsula. He notes that fund flows into passive products globally remain strong in spite of arguably heightened risks, raising the possibility that a change in sentiment, rather than any particular event, could be all it takes to spark a market reversal. In such a situation, however, the ‘winners’ from the surge in passive investment would be likely to be hit hardest.
Asset allocation
Investment process: Income-focused total return strategy
HFEL’s managers follow a consistent, disciplined investment approach, building a portfolio of 40-60 stocks with the aim of achieving attractive total returns, not just a high income. Stock selection is unconstrained by index weightings, although no more than 10% of the portfolio can be held in a single company. While the portfolio is built largely from the bottom up, the managers are aware of the potential impact of top-down factors such as the macroeconomic and political environment.
Kerley is based in London, and travels frequently to Asia; Duhra and analyst James Zhang Rui are based in Singapore. Ideas for potential investments come from company meetings and country visits, industry research and quantitative screens. These ideas are then assessed and modelled, with a focus on identifying undervalued companies that are cash-generative and either have a high current yield or the probability of generating significant future dividend growth. The portfolio is broadly equally balanced between high-yield and dividend growth stocks, although in recent years there has been a slight bias towards dividend growth, where the total return profile is better.
Exhibit 3: HFEL portfolio metrics versus FTSE Asia Pacific ex-Japan index
HFEL |
Index |
Relative |
|
Price/book (x) |
1.6 |
1.7 |
(0.1) |
P/E 12m forward (x) |
12.2 |
14.5 |
(2.3) |
Dividend yield (%) |
4.1 |
2.7 |
1.4 |
Dividend yield 12m forward (%) |
4.4 |
2.9 |
1.5 |
Free cash flow yield (%) |
7.3 |
4.4 |
2.9 |
Return on equity* (%) |
13.9 |
14.4 |
(0.5) |
Source: Henderson Far East Income. Note: Data at 31 October 2017. *Excluding financials.
As shown in Exhibit 3, the focus on companies where current share prices do not accurately reflect the value of the business gives rise to lower average P/E and price-to-book valuations than the wider market, while the bias towards cash-generative dividend payers means the portfolio has higher current and forecast free cash flow and dividend yields. HFEL’s own dividend yield is higher still, partly as a result of optimising holding periods to get maximum exposure to dividend payments, and partly because of premium income generated by writing options on some portfolio holdings, up to a maximum of 10% of NAV.
Once in the portfolio, holdings are monitored against price targets, risk and style metrics and country fundamentals, with any significant deterioration prompting a reassessment and possible exit. Portfolio turnover in FY17 was 75%.
Current portfolio positioning
At 30 November 2017, there were 51 stocks in HFEL’s portfolio, the same number as a year previously. With the exception of the largest holding Samsung Electronics, the vast majority of positions are c 1.5-2.5pp, and the top 10 holdings accounted for 29.5% of the total. Over 12 months to 30 November, the largest increase in geographical weighting (Exhibit 4) was in China, up 6.4pp including the fund’s first investments for some time in Chinese banks. The 5% weighting in India was sold during the year after a visit to the country by the manager and board, where they observed a lack of progress on economic reform and continued problems from corruption and bureaucracy. Kerley adds that high valuations of Indian companies against this difficult backdrop meant there were more attractive opportunities elsewhere. The biggest country overweight is Taiwan, which is also the highest-yielding market in the region.
From a sector perspective (Exhibit 5) the biggest increases in weighting were in financials (the aforementioned Chinese banks made up c 8% of the portfolio at end-October) and oil & gas (PTT, a Thai integrated producer and distributor that was added to the portfolio in FY17, is now just outside the top 10 holdings). Kerley says he likes Chinese banks partly from a top-down perspective, as because it is an income fund, HFEL is sensitive to a rising interest rate environment, and banks are one sector that benefits from higher rates through higher net interest margins. The Chinese banks in the portfolio are trading at a discount to book value (0.8x) and have good yields and a return on equity broadly in line with the portfolio average (see Exhibit 3). Property prices in China are stable to improving, and the proportion of non-performing loans, while probably higher than the official figure of 1%, is falling. With credit costs still low, higher loan growth, partly as a result of the government clamping down on other forms of financing such as wealth management products and ‘shadow banking’, should help push the banks towards better profitability.
Exhibit 4: Portfolio geographic exposure vs FTSE Asia Pacific ex-Japan (% unless stated)
Portfolio end- November 2017 |
Portfolio end- November 2016 |
Change (pp) |
Index weight |
Active weight vs index (pp) |
Fund weight/ index weight (x) |
|
China |
26.1 |
19.7 |
6.4 |
23.2 |
3.0 |
1.1 |
South Korea |
19.4 |
16.3 |
3.1 |
14.5 |
4.9 |
1.3 |
Australia |
17.7 |
17.4 |
0.3 |
18.9 |
(1.2) |
0.9 |
Taiwan |
13.7 |
12.5 |
1.2 |
10.7 |
3.1 |
1.3 |
Thailand |
6.1 |
6.2 |
(0.1) |
2.8 |
3.3 |
2.1 |
Singapore |
5.9 |
10.2 |
(4.3) |
3.7 |
2.3 |
1.6 |
Hong Kong |
5.6 |
5.6 |
0.0 |
10.5 |
(4.9) |
0.5 |
New Zealand |
1.9 |
2.5 |
(0.6) |
0.6 |
1.3 |
3.2 |
United Kingdom |
1.9 |
0.0 |
1.9 |
0.0 |
1.9 |
N/A |
Indonesia |
1.7 |
2.4 |
(0.7) |
1.9 |
(0.2) |
0.9 |
India |
0.0 |
5.0 |
(5.0) |
9.4 |
(9.4) |
0.0 |
Other |
0.0 |
2.2 |
-2.2 |
3.8 |
(3.8) |
0.0 |
100.0 |
100.0 |
100.0 |
Source: Henderson Far East Income, Edison Investment Research
Utilities and telecoms have seen big reductions as Kerley has increased exposure to cyclical areas such as financials and technology. In technology, the manager notes that he owns more hardware than software, as hardware companies are generally more cash generative, supporting better dividends, and trade at more favourable valuations than many software companies. The reduction in utilities has partly come from Australia, where holdings are now more diversified among areas such as resources (BHP and Rio Tinto are recent purchases), insurance and media. Other utility stocks sold include Korea Electric Power and Rural Electrification Corporation in India, while reductions in telecoms have come through the sale of Singapore Telecom and PDLT (Philippines), and a reduction in Telekomunikasi Indonesia Persero, previously a top 10 holding.
Exhibit 5: Portfolio sector exposure vs FTSE Asia Pacific ex-Japan (% unless stated)
Portfolio end- November 2017 |
Portfolio end- November 2016 |
Change (pp) |
Index weight |
Active weight vs index (pp) |
Fund weight/ index weight (x) |
|
Financials |
35.3 |
28.4 |
6.9 |
33.9 |
1.4 |
1.0 |
Technology |
19.2 |
18.0 |
1.2 |
13.6 |
5.6 |
1.4 |
Oil & gas |
11.5 |
8.5 |
3.0 |
4.9 |
6.6 |
2.4 |
Industrials |
9.2 |
11.4 |
(2.2) |
11.0 |
(1.8) |
0.8 |
Telecommunications |
9.2 |
13.9 |
(4.7) |
3.7 |
5.5 |
2.5 |
Consumer goods |
8.4 |
8.7 |
(0.3) |
13.2 |
(4.8) |
0.6 |
Basic materials |
3.6 |
3.8 |
(0.2) |
6.6 |
(3.0) |
0.5 |
Consumer services |
1.6 |
2.8 |
(1.2) |
6.5 |
(4.9) |
0.2 |
Utilities |
1.6 |
4.3 |
(2.7) |
3.1 |
(1.5) |
0.5 |
Healthcare |
0.0 |
0.0 |
0.0 |
3.5 |
(3.5) |
0.0 |
Cash |
0.3 |
0.0 |
0.3 |
0.0 |
0.3 |
N/A |
100.0 |
100.0 |
100.0 |
Source: Henderson Far East Income, Edison Investment Research. Note: Oct 2016 weightings are approximate.
New investments include Dali Foods, a Hong Kong-listed food and beverage company with a focus on snacks and soya milk products. Kerley says the position was taken after analyst James Zhang Rui, a Chinese national, visited China to see if Dali’s distribution network was as compelling as the company claimed. He found good penetration in third- and fourth-tier cities, benefiting from Dali positioning its soya drinks as milk alternatives in a country where many people are lactose intolerant. The holding was bought on a P/E valuation of 12-13x in April 2017, since when the share price has appreciated by more than 50%.
Performance: Consistent medium-term record
|
Exhibit 6: Investment company performance to 31 December 2017 |
|
Price, NAV and index total return performance, one-year rebased |
Price, NAV and index total return performance (%) |
|
|
|
Source: Thomson Datastream, Edison Investment Research. Note: Three-, five- and 10-year performance figures annualised. |
|
HFEL has performed well in absolute terms over the year to 31 December 2017 (particularly in the first six months), with NAV and share price total returns of 19.0% and 16.9% respectively, ahead of the longer-term annualised returns of c 8-11% (Exhibit 6). However, it has consistently trailed the FTSE Asia Pacific ex-Japan index. This is partly because many of the top contributors to the index return are expensive technology stocks with little or no yield, which are outside HFEL’s remit. From a performance attribution perspective, the overweight allocations to China, Singapore and Korea had a positive effect, although stock selection in these areas was a relative detractor, given the inability to hold companies such as Alibaba and Tencent. Outperformance came from stock picks in areas such as oil & gas and consumer stocks (both goods and services), particularly in China. An example is Autohome, a Chinese online car sales portal, which HFEL’s manager bought during FY17 but subsequently sold after the shares doubled in value. Huayu Automotive Systems (a manufacturer of car parts) and Dali Foods (snacks, energy drinks and soya milk products) have also performed strongly, as has largest holding Samsung Electronics.
|
Exhibit 7: Share price and NAV total return performance, relative to indices (%) |
||||||||
|
One month |
Three months |
Six months |
One year |
Three years |
Five years |
10 years |
|
Price relative to FTSE Asia Pacific ex-Japan |
(1.8) |
(1.6) |
(5.0) |
(5.3) |
(9.3) |
(8.6) |
7.5 |
|
NAV relative to FTSE Asia Pacific ex-Japan |
(0.0) |
(1.0) |
(4.1) |
(3.6) |
(8.6) |
(7.4) |
(0.5) |
|
Price relative to FTSE All-World |
(0.2) |
0.6 |
(2.9) |
2.7 |
(9.5) |
(24.5) |
(4.0) |
|
NAV relative to FTSE All-World |
1.7 |
1.2 |
(1.9) |
4.5 |
(8.7) |
(23.5) |
(11.2) |
|
Price relative to FTSE All-Share |
(3.0) |
0.8 |
(3.0) |
3.3 |
4.2 |
(4.2) |
28.4 |
|
NAV relative to FTSE All-Share |
(1.2) |
1.4 |
(2.0) |
5.2 |
5.1 |
(2.9) |
18.9 |
|
|
Source: Thomson Datastream, Edison Investment Research. Note: Data to 31 December 2017. Geometric calculation. |
||||||||
|
Exhibit 8: NAV total return performance relative to FTSE Asia Pacific ex-Japan (five years) |
||||||||
|
||||||||
|
Source: Thomson Datastream, Edison Investment Research |
||||||||
Capital structure and fees
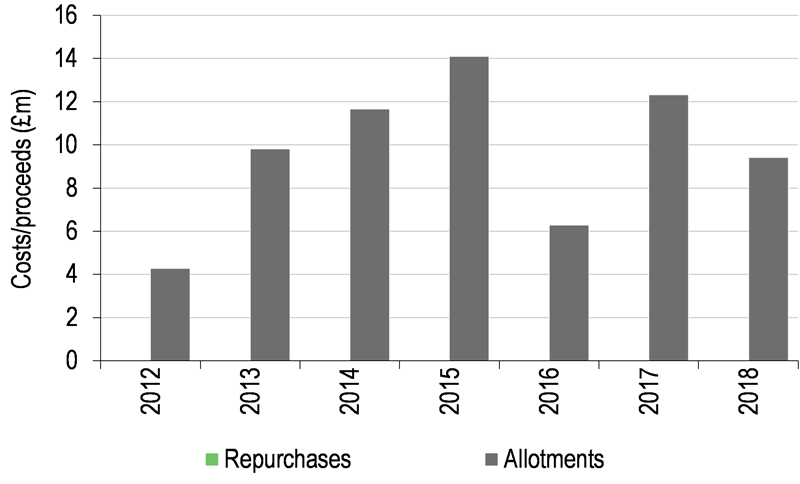
HFEL is a closed-end investment company, registered in Jersey and listed on the London and New Zealand stock exchanges. It has one class of share, with 120.4m shares in issue at 12 January 2018, an increase of 4.3% over 12 months and consistent with the average new issuance of c 3-5% a year. HFEL may allot up to 10% or repurchase up to 14.99% of shares each year to manage a premium or a discount.
Gearing is available through a £35m borrowing facility with Commonwealth Bank of Australia. This currently translates to a maximum achievable gearing of c 8.0% of net assets versus a maximum permitted gearing level of 30% of gross assets. At 30 November, net gearing stood at 2.0%. When the current facility was arranged it amounted to c 10% of net assets; it expires in February 2018 and the manager says it is likely that any new facility would again be equivalent to c 10% of net assets.
Henderson Investment Funds acts as HFEL’s alternative investment manager (AIFM) under the AIFM Directive. Until 31 August 2017, Henderson received an annual management fee of 0.90% of net assets. With effect from 1 September 2017, the management fee will be charged at 0.90% on the first £400m of net assets and 0.75% thereafter. There is no performance fee, and ongoing charges for FY17 were 1.12%.
Dividend policy and record
HFEL pays dividends quarterly, in February, May, August and November. The total annual dividend has increased each year since the fund was launched, and has grown at a compound annual rate of 5.4% over the past five years, well ahead of UK inflation. The FY17 dividend of 20.8p was 4.0% higher than the 20.0p dividend for FY16, backed by a 7.6% increase in revenue, and was fully covered by income. (Revenue returns per share were only 3.8% higher than in FY16, because of an increase in the number of shares in issue.) Reserves were boosted by £1.8m and now stand at the equivalent of 67% of the annual dividend. No dividends have yet been declared in respect of FY18. Based on the FY17 total dividend, HFEL currently has a dividend yield of 5.4%.
Peer group comparison
HFEL is a member of the Association of Investment Companies’ Asia Pacific ex-Japan sector, a broad peer group of 15 funds with differing investment mandates. Within the sector, HFEL is one of three funds that similarly target income from their investments (as distinct from those that manufacture a high yield through a partial return of capital). The others are Aberdeen Asian Income and Schroder Oriental Income. HFEL’s NAV total returns are below the weighted average for the sector over one, three, five and 10 years, although within the subgroup of income funds it ranks first, second, second and third respectively over the same periods. Ongoing charges are average and there is no performance fee. HFEL’s gearing is below the sector average. It has comfortably the highest yield in the group (3.2pp above the weighted average), which is a probable factor in the fact that it is also trading at the second-highest premium to NAV.
Exhibit 10: AIC Asia Pacific ex-Japan sector as at 10 January 2018*
% unless stated |
Market cap £m |
NAV TR |
NAV TR |
NAV TR |
NAV TR |
Ongoing charge |
Perf. fee |
Discount (ex-par) |
Net gearing |
Dividend yield (%) |
Henderson Far East Income |
463.3 |
15.7 |
36.9 |
54.3 |
121.8 |
1.1 |
No |
3.0 |
103 |
5.4 |
Aberdeen Asian Income |
410.2 |
14.3 |
36.8 |
42.7 |
196.8 |
1.2 |
No |
(6.1) |
107 |
4.0 |
Aberdeen Asian Smaller |
366.7 |
8.6 |
27.3 |
47.1 |
269.7 |
1.7 |
No |
(12.0) |
111 |
1.1 |
Aberdeen New Dawn |
282.6 |
26.8 |
46.7 |
54.6 |
150.5 |
0.9 |
No |
(11.8) |
108 |
1.6 |
Edinburgh Dragon |
722.6 |
23.1 |
45.7 |
54.1 |
158.8 |
1.0 |
No |
(10.7) |
104 |
0.9 |
Fidelity Asian Values |
270.6 |
9.4 |
53.7 |
95.7 |
155.2 |
1.3 |
No |
(4.0) |
100 |
1.1 |
Invesco Asia Trust |
219.1 |
31.1 |
69.6 |
107.6 |
199.8 |
1.0 |
No |
(9.0) |
96 |
1.4 |
JPMorgan Asian |
354.7 |
37.1 |
67.5 |
94.1 |
93.8 |
0.7 |
No |
(9.0) |
100 |
3.7 |
Martin Currie Asia Unconstrained |
148.5 |
21.5 |
45.0 |
58.1 |
66.0 |
1.1 |
No |
(9.8) |
103 |
1.9 |
Pacific Assets Trust |
314.1 |
14.6 |
42.4 |
86.9 |
97.4 |
1.3 |
No |
(3.6) |
100 |
1.0 |
Pacific Horizon |
183.4 |
49.5 |
70.6 |
100.1 |
121.0 |
1.1 |
No |
(6.2) |
99 |
0.0 |
Schroder Asia Pacific |
809.4 |
36.3 |
74.7 |
100.2 |
190.6 |
1.0 |
No |
(8.8) |
113 |
1.2 |
Schroder Asian Total Return Inv. Co |
315.4 |
33.2 |
77.8 |
89.2 |
134.1 |
1.0 |
Yes |
5.7 |
102 |
0.0 |
Schroder Oriental Income |
649.8 |
14.4 |
51.7 |
74.5 |
202.2 |
0.9 |
Yes |
0.2 |
107 |
3.5 |
Scottish Oriental Smaller Cos |
332.7 |
13.3 |
36.8 |
63.9 |
277.7 |
1.2 |
Yes |
(10.0) |
100 |
1.1 |
Sector weighted average |
22.9 |
52.4 |
73.7 |
170.3 |
1.1 |
(6.0) |
105 |
2.2 |
||
HFEL rank in sector |
4 |
9 |
12 |
12 |
11 |
7 |
2 |
7 |
1 |
Source: Morningstar, Bloomberg, Edison Investment Research. Note: *Performance data to 9 January 2018. TR = total return. Net gearing is total assets less cash and equivalents as a percentage of net assets.
The board
There are five directors on HFEL’s board, all of them non-executive and independent of the manager. The chairman, John Russell, has been a director of HFEL since launch in 2006, and was also on the board of its predecessor, Henderson Far East Income Trust. David Mashiter has also been on HFEL’s board since launch. David Staples joined the board in 2011, Julia Chapman was appointed in 2015 and Nicholas George became a director in April 2016. The directors have professional backgrounds in investment banking, accountancy, asset management and law. Each year the whole board travels to Asia.
Performance tables in New Zealand dollar terms
|
Exhibit 11: Investment company performance – in New Zealand dollar terms to 31 December 2017 |
|
Price, NAV and index total return performance, one-year rebased |
Price, NAV and index total return (%) |
|
|
|
Source: Thomson Datastream, Edison Investment Research |
|
Returns for New Zealand-based investors in HFEL have been enhanced by weakness in the New Zealand dollar versus sterling in recent months. While longer-term annual returns (three and five years) are similar for both UK and New Zealand investors at c 8-10% pa, New Zealand investors have seen c 25-28% NAV and share price total returns from HFEL over 12 months to 31 December 2017, compared with c 17-19% for sterling-based investors. With the majority of the strengthening in sterling having taken place between September and December, New Zealand investors have also seen more positive returns than sterling investors over three and six months, although returns over one month have been flat to negative.
Exhibit 12: Investment trust discrete years’ performance – in New Zealand dollar terms
12 months ending |
Share price (%) |
NAV (%) |
FTSE AW Asia Pacific ex-Japan (%) |
FTSE All-World (%) |
FTSE All-Share (%) |
31/12/13 |
4.7 |
5.3 |
3.5 |
23.6 |
23.4 |
31/12/14 |
8.7 |
8.5 |
9.1 |
10.3 |
0.3 |
31/12/15 |
1.8 |
3.0 |
4.2 |
12.3 |
9.0 |
31/12/16 |
3.8 |
1.5 |
5.9 |
6.6 |
(3.9) |
29/12/17 |
25.4 |
27.7 |
32.4 |
22.2 |
21.4 |
Source: Thomson Datastream. Note: Total return basis, in NZ$ terms.
|
|
Over 2017 BiondVax crystallised its late-stage development plans for lead asset M-001, a potentially universal influenza vaccine. Following its discussions with the regulatory authorities and gaining access to new capital (European Investment Bank and share issues), the company confirmed on 27 December 2017 that it will initiate a pivotal Phase III trial on its own for a universal flu vaccine indication (likely to start in Q318). We have revised our assumptions substantially and increased our valuation to $200m (NIS689m) or $32.4/ADS (NIS2.80/share) from $165m previously.