Last close As at 06/08/2026
GBP2.02
▲ 3.00 (1.51%)
Market capitalisation
GBP183m
Research: Investment Companies
UIL Limited (UIL) is a specialist leveraged fund managed by long-term, deep-value investor ICM. The team, led by Charles Jillings, aims to generate strong total returns by investing in undervalued businesses across the globe. Around 80% of the portfolio is held in collective investment vehicles managed by ICM known as âplatformsâ, each of which has a specific mandate, while the other positions are direct investments. The fundâs three largest sector exposures are financial services, resources and technology (c 75%), while the largest geographic weighting is Australia (c 40%). Jillings is upbeat about UILâs future prospects; he believes that over the last year the quality of the fundâs assets and its funding structure have improved, and he is encouraged by the companyâs strong level of income and reserves
UIL |
‘Uncaptured value’ from discounted assets |
Investment companies |
22 April 2021 |
Analysts
|
||||||||||||||||||||||||||||||||||||||||||||||||||||||||||||||||||||||||||||||||||||||||||||||||||||
UIL Limited (UIL) is a specialist leveraged fund managed by long-term, deep-value investor ICM. The team, led by Charles Jillings, aims to generate strong total returns by investing in undervalued businesses across the globe. Around 80% of the portfolio is held in collective investment vehicles managed by ICM known as ‘platforms’, each of which has a specific mandate, while the other positions are direct investments. The fund’s three largest sector exposures are financial services, resources and technology (c 75%), while the largest geographic weighting is Australia (c 40%). Jillings is upbeat about UIL’s future prospects; he believes that over the last year the quality of the fund’s assets and its funding structure have improved, and he is encouraged by the company’s strong level of income and reserves.
|
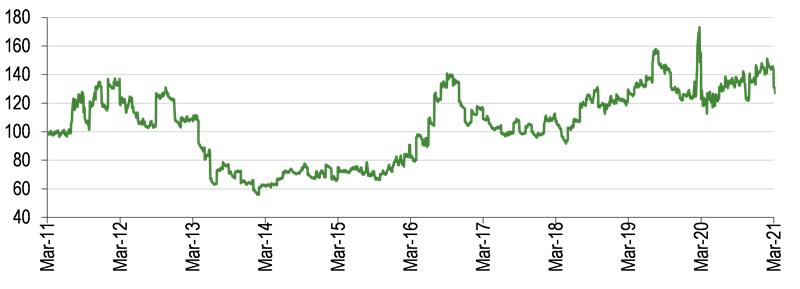
Long-term NAV outperformance versus the broad UK market |
|
|
Source: Refinitiv, Edison Investment Research. Note: NAV total return versus the CBOE UK All Companies index over 10 years to end-March 2021. |
The analyst’s view
UIL offers investors a high-conviction, highly geared portfolio of undervalued assets across the globe, which are poised to benefit from an improvement in economic activity, and has a long-term record of outperformance versus the broad UK market and its peers in the AIC Flexible Investment sector. The fund’s exposures are unconventional, with sector biases to financial services, resources and technology, and a differentiated geographic bias to Australia. An important driver in shaping the portfolio is the manager’s three medium-term core views: the world’s financial markets are over-indebted; technological change offers strong investment upside; and emerging markets offer better GDP growth opportunities than developed markets. UIL’s shares trade at a consistently wide discount to NAV and the board is focused on reducing this to 20%. Despite the negative effects of COVID-19, UIL’s dividends have been fully covered since FY19, and it has meaningful reserves.
Scope for a higher valuation
UIL’s shares are currently trading at a 32.1% discount to cum-income NAV, which is narrower than the 39.4% to 40.2% range of average discounts over the last one, three and five years. Strong NAV performance, a focus on reducing the discount, a lower level of gearing and regular quarterly dividends support the potential for a higher valuation. UIL currently offers investors an attractive 3.4% yield.
Recent developments
1 March 2021: Daily rather than weekly and month-end NAVs are now published.
17 March 2021: A proposed change to UIL’s investment policy to permit investment of up to 50%, rather than 30% of gross assets in a single platform. This requires approval from UIL’s ordinary shareholders and holders of its ZDP (zero dividend preference) shares. UIL’s platforms have become an increasingly important element of the portfolio, increasing from 46.5% as at 30 June 2012 to c 80% now. The existing 30% single investment limit will be applied to investee companies held by platforms on a look-through basis and will also continue to apply to any direct investments made by UIL. The change was approved on 16 April 2021 (see below).
18 March 2021: Announcement of a rollover offer of 2022 ZDP shares into 2028 ZDP shares. The rollover value for the 2022 ZDP shares is 137.5p per share and will be a 2.6% premium to the accrued capital entitlement at the rollover date. Up to 25m 2028 ZDP shares to be offered (minus the number of 2022 ZDP shares rolled over – a maximum 36.36% of the 50m in issue is permitted) via an initial issue with any balance offered via a placing. The initial share price and capital entitlement is 100p and the final capital entitlement of 152.29p implies a gross redemption yield of 5.75% and a cover of 2.12x. Aggregate redemption payable on the 31 October 2022 ZDP shares is c £73.5m (based on the redemption value of 146.99p per share). The offer of 2028 ZDP shares will allow 2022 ZDP holders to remain invested in the company and assist UIL in the financing of the redemption of the 2022 ZDP shares.
9 April 2021: Results of the special general meeting and 2026 ZDP share class meeting. The proposal to change UIL’s investment policy was passed by an overwhelming majority (99.96% of UIL’s shareholders and 99.66% of the 2026 ZDP holders). Due to the presence of an insufficient number of UIL’s 2022 and 2024 ZDP investors, voting on the proposal by these holders was postponed to 16 April 2021.
14 April 2021: Results of the rollover offer. Holders of c 11.8m 2022 ZDP shares (c 23.6% of the total) elected to roll over to 2028 ZDP shares. Each 2022 ZDP share will convert into 1.375 new 2028 ZDP shares. The remaining c 8.8m new 2028 ZDP shares will be offered via a placing.
16 April 2021: Holders of a further c 2.6m 2022 ZDP shares (c 5.3% of the total) elected to roll over to 2028 ZDP shares. Hence the number of new 2028 ZDP shares to be offered via a placing has been reduced to c 5.2m. Results of the 2022 and 2024 ZDP share class meetings. The proposal to change UIL’s investment policy was passed by an overwhelming majority (99.49% of UIL’s 2022 ZDP holders and 98.37% of the 2024 ZDP holders).
21 April 2021: Placing of c 5.2m new 2028 ZDP shares – c 4.6m to external investors raising c £4.6m and c 0.6m to UIL at a cost of £0.6m. Dealing on the London Stock Exchange is expected to commence on 23 April 2021.
Market outlook: Anticipating an economic recovery
The performance of indices (in sterling) over the last 10 years is shown in Exhibit 1 (LHS). Over the period, UK and emerging market shares have performed broadly in line but have failed to keep pace with the global market, which is dominated by the US (now c 60% of the MSCI AC World index). Share prices have bounced back strongly from the coronavirus-led market sell-off in early 2020. Initially, investors were encouraged by the extreme levels of monetary and fiscal stimulus provided by governments across the world to offset the negative effects of the pandemic, but the announcement of positive COVID-19 vaccine trials in early November 2020 has provided further support to equity markets. With the vaccine roll-out gaining momentum, there is an expectation of a meaningful improvement in global GDP growth as economies emerge from lockdowns. For those people that have remained employed during the pandemic, many have amassed additional savings, so pent-up demand is likely to provide an additional kick to economic growth.
While the macroeconomic backdrop in aggregate appears to be improving, investors should be aware that for certain regions in particular, share prices are baking in high expectations for earnings growth. The Datastream World Index is currently trading on a forward P/E multiple of 19.0x, which is towards the high end of the 10.0x to 19.8x 10-year range and 32% above the average over this period, which leaves little room for disappointment. While some regions such as emerging markets have less stretched valuations, this could be for valid reasons, for example in Brazil (the largest economy in Latin America) there is political risk, and the government has favoured keeping the economy open rather than trying to control the virus outbreak. The share prices of companies trading on high multiples that fail to deliver expected sales/earnings results could be particularly vulnerable during a period of stock market volatility. With this backdrop in mind, investors may benefit from focusing on high-quality companies with long-term growth potential, that are trading on reasonable valuations.
|
Exhibit 1: Market performance and valuation |
|||||||||||||||||||||||||||||||
Performance of indices (last 10 years, £) |
Datastream indices forward P/E multiples (at 21 April 2021) |
||||||||||||||||||||||||||||||
|
|
||||||||||||||||||||||||||||||
|
Source: Refinitiv, Edison Investment Research |
|||||||||||||||||||||||||||||||
The fund manager: Charles Jillings
The manager’s view: Hidden value in the portfolio
Jillings comments that ‘the economic recovery is accelerating quicker than anticipated’ following the coronavirus-led slowdown. He anticipated a strong initial recovery as orders were placed and fulfilled, but the manager suggests that demand is exceeding his expectations as economies are starting to open up. Jillings says that strong top-line growth is a positive driver for the global economy in both developed and emerging markets, and the recovery has gained momentum as COVID-19 vaccination programmes are rolled out. Companies are also benefiting from wider margins due to cost cutting and are able to further develop their business models. There is a shift to a ‘greener’ economy evidenced by high demand for electric vehicles and renewable energy, which is very supportive for commodity prices; investors are anticipating shortages in copper and other basic products.
The manager comments that there is an interesting question for the stock market if the ongoing high levels of investment continue, such as the infrastructure spending in the US and the EU recovery fund – who will pay for these and will it lead to higher inflation? He notes that bond investors are already demanding higher yields (the US 10-year treasury yield has increased from 0.93% to 1.56% so far this year).
Jillings suggests that there is ‘uncaptured value’ in UIL’s portfolio. He highlights that when its platform positions are trading at a discount to the value of their underlying investments, this effectively affords UIL investors a ‘double discount’. For example, while UIL is trading at a c 32% discount to NAV, its largest holding, Somers, is valued at a 15% discount to NAV and Utilico Emerging Markets Trust’s shares are currently trading at a c 12% discount to NAV.
Current portfolio positioning
At end-March 2021, UIL’s top 10 holdings made up 96.1% of the fund, which was higher than 91.5% a year earlier; seven positions were common to both periods. This may suggest that the company has a very concentrated portfolio; however, its four platforms (Somers, Zeta Resources, Utilico Emerging Markets and Allectus Capital) hold a number of underlying holdings, which significantly reduces risk; currently the total number of positions including the platforms is c 45 and c 15% of the fund is held in unlisted investments (excluding loans to listed companies). UIL's c 40% holding in Somers comprises over 10 investments, with its largest holding, Resimac (in which Somers has a 62.4% interest) accounting for c 20% of UIL’s fund on a look-through basis. At the end of March 2021, on a look-through basis, UIL’s top 10 positions made up c 60% of the fund.
Looking at two of the company’s underlying investments, Resimac is benefiting from a strong housing market in Australia and a growing market share, rising net interest margins, and a rerating of its shares as the company’s profitability has doubled. Copper Mountain Mining, 20% owned by Zeta Resources, is a listed Canadian operator and is benefiting from increased production and a higher copper price.
Exhibit 2: Top 10 holdings (as at 31 March 2021)
Company |
Country* |
Sector |
Portfolio weight % |
|
31 Mar 2021 |
31 Mar 2020** |
|||
Somers |
Bermuda |
Financial services investment holding company |
37.5 |
29.7 |
Zeta Resources |
Australia |
Resources investment company |
20.1 |
13.8 |
Utilico Emerging Mkts Trust |
UK |
Emerging markets investment trust |
15.4 |
13.1 |
Allectus Capital |
Bermuda |
Fintech investment company |
5.5 |
4.8 |
Resolute Mining |
Australia |
Gold mining |
5.1 |
8.2 |
Vix Tech |
Singapore |
Automated fare collection systems |
3.9 |
2.1 |
Starpharma Holdings |
Australia |
Dendrimer products |
2.8 |
N/A |
Orbital Corporation |
Australia |
Clean engine technologies/alt fuel systems |
2.8 |
1.4 |
ICM Mobility |
UK |
Digitisation of public and private transport |
1.8 |
N/A |
Sindoh Company |
South Korea |
Multifunction & 3D printers |
1.2 |
N/A |
Top 10 (% of portfolio) |
96.1 |
91.5 |
||
Source: UIL, Edison Investment Research. Note *Country of listing or domicile. **N/A where not in end-March 2020 top 10.
Two new additions to UIL’s top 10 are ICM Mobility (a holding company) and Sindoh Company (a direct investment). ICM Mobility has recently been established and is focused on enabling public and private transport companies to move into the digital era, from planning journeys and issuing smart tickets, to streamlining electronic payments and providing insights from ICM’s extensive travel data sources. Sindoh Company is a South Korea-listed leading producer of multifunction and 3D printers, with more than 90% of its revenues derived from original design manufacturing.
Starpharma Holdings is another top 10 position; its share price has doubled over the last year. It is an Australia-listed nanotech business that originated in the University of Melbourne. The company is a world leader in the development of new pharmaceutical and medical products based on proprietary polymers called dendrimers. Starpharma’s drug delivery platform technology, DEP, is being used to improve pharmaceuticals, to reduce toxicities and enhance their performance, particularly for anti-cancer therapies. The company has joint ventures including with AstraZeneca and Merck. Starpharma has also developed VIRALEZE, an antiviral nasal spray for COVID-19, which is complementary to vaccines and other preventative measures such as social distancing and personal protective equipment. The product was successfully registered for sale in Europe and the UK, where it has a distribution agreement with LloydsPharmacy. Jillings suggests that VIRALEZE will generate high margins and has a wide addressable market.
Exhibit 3: Portfolio geographic exposure on a look-through basis (% unless stated)
Portfolio end-March 2021 |
Portfolio end-March 2020 |
Change (pp) |
|
Australia |
38.0 |
25.4 |
12.6 |
UK |
11.6 |
13.5 |
(1.9) |
Asia |
11.4 |
7.5 |
3.9 |
North America |
10.9 |
3.4 |
7.5 |
Other - gold mining |
6.7 |
10.3 |
(3.6) |
Middle East/Africa |
6.3 |
7.3 |
(1.0) |
Bermuda |
5.3 |
18.0 |
(12.7) |
Latin America |
4.4 |
4.8 |
(0.4) |
Europe (ex-UK) |
3.9 |
9.8 |
(5.9) |
New Zealand* |
1.5 |
0.0 |
1.5 |
100.0 |
100.0 |
Source: UIL, Edison Investment Research. Note: *New Zealand was included with Australia in March 2020.
In terms of geographic breakdown (Exhibit 3), at the end of March 2021, compared to the prior year, UIL had a higher weighting to its largest exposure in Australia (Australia and New Zealand +14.1pp), with lower weightings to Bermuda (-12.7pp) and continental Europe (-5.9pp). Changes are a result of bottom-up stock selection and valuation moves. To give some perspective about UIL’s differentiated exposure, the top three country exposures in the MSCI AC World index at the end of March 2021 were the United States (57.8%), Japan (6.5%) and China (4.9%).
Exhibit 4: Portfolio sector exposure on a look-through basis (% unless stated)
Portfolio end-March 2021 |
Portfolio end-March 2020 |
Change (pp) |
|
Financial services |
37.5 |
29.8 |
7.7 |
Resources |
18.3 |
11.1 |
7.2 |
Technology |
17.3 |
18.1 |
(0.8) |
Gold mining |
6.7 |
10.3 |
(3.6) |
Ports |
3.5 |
3.5 |
0.0 |
Electricity |
2.9 |
3.9 |
(1.0) |
Telecoms |
1.9 |
7.4 |
(5.5) |
Oil & gas |
1.9 |
2.1 |
(0.2) |
Renewables |
1.5 |
1.0 |
0.5 |
Infrastructure investments |
0.8 |
6.8 |
(6.0) |
Airports |
0.6 |
0.2 |
0.4 |
Water |
0.5 |
1.0 |
(0.5) |
Other |
6.6 |
4.8 |
1.8 |
100.0 |
100.0 |
Source: UIL, Edison Investment Research
Financial services remains UIL’s largest sector exposure (Exhibit 4) at c 40% of the fund, and its weighting increased by 7.7pp in the 12 months to the end of March 2021; there was also a larger allocation to resources (+7.2pp). Notable reductions were its exposures to the infrastructure investments (-6.0pp) and telecoms (-5.5pp) sectors. The top three sector exposures in the MSCI AC World index at the end of March 2021 were information technology (21.3%), financials (14.3%) and consumer discretionary (12.7%).
Performance: Long-term record of outperformance
Exhibit 5: Five-year discrete performance data
12 months ending |
Share price |
NAV |
CBOE UK All Companies (%) |
MSCI AC World (%) |
MSCI Emerging Markets (%) |
31/03/17 |
64.7 |
62.6 |
22.6 |
33.0 |
35.2 |
31/03/18 |
6.4 |
(0.4) |
1.2 |
2.9 |
11.8 |
31/03/19 |
11.0 |
28.6 |
6.2 |
11.1 |
0.1 |
31/03/20 |
(18.4) |
(23.4) |
(19.1) |
(6.2) |
(13.2) |
31/03/21 |
70.1 |
35.3 |
26.6 |
39.6 |
42.8 |
Source: Refinitiv. Note: All % on a total return basis in pounds sterling.
In H121 (ending 31 December 2021), UIL’s NAV total return of +22.0% was considerably ahead of the benchmark’s +9.3% total return; its share price total return was +10.4% leading to a widening of the discount over the period. The recovery in UIL’s portfolio was broad based with eight of its top 10 holdings appreciating in value. These included the company’s top two positions: Somers (+62.1% – helped by a very strong performance by Resimac, whose business has accelerated, and a stronger Australian dollar); and Zeta Resources (+61.8% – reflected strength in the resources sector, including copper, which has been beneficial for Zeta’s largest investment, Copper Mountain). Resolute Mining’s share price declined by 29.8%, reflecting concerns over its operating performance despite rising gold prices. The company’s CEO stepped down and its board is focused on optimising Resolute’s asset base and reducing its debts.
|
Exhibit 6: Investment company performance to 31 March 2021 |
||
Price, NAV* and index total return performance, one-year rebased |
Price, NAV and index total return performance (%) |
|
|
|
|
|
Source: Refinitiv, Edison Investment Research. Note: Three-, five- and 10-year performance figures annualised. *Monthly NAVs. |
||
|
Exhibit 7: NAV total return performance relative to CBOE UK All Cos index over five years |
||
|
||
|
Source: Refinitiv, Edison Investment Research |
||
UIL’s relative performance is highlighted in Exhibit 8. It has outperformed the broad UK market over the last one, three, five and 10 years. The relative weakness during March 2021 was primarily due to the holding in Resolute Mining, whose share price fell by around a third during the month – the Ghanaian Minerals Commission announced the termination of the mining lease at Resolute’s Bibiani mine (a care and maintenance rather than a producing mine) but it has subsequently been reinstated, and the gold price weakened. Jillings explains that stock markets have rallied recently due to greater visibility of an economic improvement. Robust global infrastructure spending has benefited Zeta Resources due to higher commodity prices, while there has been a change in market leadership towards value/cyclical stocks and away from highly valued growth names. UIL has performed less well compared with the MSCI AC World Index, which is dominated by the US (c 60%), a market that has been relatively strong in recent years. While lagging over the last year, the company’s NAV has outperformed the MSCI Emerging Markets Index over the last three, five and 10 years.
|
Exhibit 8: Share price and NAV total return performance, relative to indices (%) |
|||||||
|
One month |
Three months |
Six months |
One year |
Three years |
Five years |
10 years |
Price relative to CBOE UK All Companies |
(15.4) |
13.6 |
21.0 |
34.3 |
41.7 |
100.0 |
30.8 |
NAV relative to CBOE UK All Companies |
(13.2) |
(10.5) |
(3.6) |
6.9 |
22.6 |
60.0 |
31.2 |
Price relative to MSCI AC World |
(15.1) |
15.7 |
28.2 |
21.8 |
6.0 |
35.7 |
(20.5) |
NAV relative to MSCI AC World |
(12.9) |
(8.8) |
2.1 |
(3.0) |
(8.2) |
8.6 |
(20.2) |
Price relative to MSCI Emerging Markets |
(11.5) |
18.3 |
25.6 |
19.1 |
24.2 |
44.0 |
35.7 |
NAV relative to MSCI Emerging Markets |
(9.1) |
(6.7) |
0.1 |
(5.3) |
7.5 |
15.2 |
36.1 |
|
Source: Refinitiv, Edison Investment Research. Note: Data to end-March 2021. Geometric calculation. |
|||||||
Peer group comparison
UIL is a member of the AIC Flexible Investment sector. In Exhibit 9 we show the 17 funds with market caps greater than £50m that have been trading for more than three years. A direct comparison between the companies is not possible as they follow a variety of investment mandates, although the analysis does have some relevance. UIL’s NAV total returns are above average over all periods shown, ranking fifth over one year, second over three years, first over five years, and fifth over 10 years. UIL has one of the widest discounts in the select peer group, an above-average ongoing charge and by far the highest level of gearing. UIL offers an attractive 3.4% dividend yield, which is 110bp above the mean.
Exhibit 9: Selected peer group at 21 April 2021*
% unless stated |
Market |
NAV TR |
NAV TR |
NAV TR |
NAV TR |
Discount |
Ongoing charge |
Perf. |
Net |
Dividend |
UIL |
196.7 |
34.1 |
40.3 |
94.1 |
138.0 |
(32.1) |
2.0 |
Yes |
164 |
3.4 |
Aberdeen Diversified Inc & Growth |
296.3 |
8.6 |
2.7 |
10.3 |
31.6 |
(16.9) |
0.6 |
No |
101 |
5.8 |
BMO Managed Portfolio Growth |
106.1 |
41.6 |
39.3 |
84.7 |
156.6 |
2.7 |
1.0 |
Yes |
100 |
0.0 |
BMO Managed Portfolio Income |
66.2 |
32.2 |
23.1 |
50.7 |
114.4 |
1.5 |
1.1 |
Yes |
104 |
4.3 |
Caledonia Investments |
1,595.8 |
24.7 |
27.8 |
48.0 |
127.3 |
(26.9) |
0.9 |
No |
100 |
2.1 |
Capital Gearing |
674.9 |
14.5 |
25.6 |
42.3 |
87.9 |
2.2 |
0.7 |
No |
100 |
0.9 |
Hansa Investment Company 'A' |
171.2 |
31.3 |
18.8 |
54.5 |
53.7 |
(32.3) |
0.3 |
No |
100 |
1.5 |
JPMorgan Multi-Asset Growth & Inc |
86.0 |
20.7 |
17.9 |
|
|
(4.4) |
1.0 |
No |
100 |
4.0 |
JZ Capital Partners |
98.8 |
(35.6) |
(56.2) |
(55.8) |
(32.4) |
(58.7) |
3.5 |
Yes |
111 |
0.0 |
Livermore Investments |
77.5 |
(4.8) |
(3.9) |
55.2 |
170.2 |
(23.1) |
2.9 |
No |
100 |
7.0 |
Miton Global Opportunities |
92.1 |
53.6 |
23.9 |
83.9 |
121.2 |
0.4 |
1.3 |
Yes |
100 |
0.0 |
Momentum Multi-Asset Value Trust |
65.8 |
50.8 |
22.8 |
52.7 |
122.6 |
(0.5) |
1.5 |
No |
110 |
3.6 |
New Star Investment Trust |
90.9 |
24.8 |
19.4 |
50.6 |
67.2 |
(26.2) |
1.0 |
Yes |
100 |
1.1 |
Personal Assets |
1,499.4 |
10.1 |
24.0 |
33.2 |
71.1 |
0.7 |
0.9 |
No |
100 |
1.2 |
RIT Capital Partners |
3,776.5 |
45.1 |
46.9 |
80.0 |
138.4 |
(5.2) |
0.7 |
Yes |
115 |
0.0 |
Ruffer Investment Company |
559.4 |
19.1 |
28.2 |
41.4 |
65.0 |
1.6 |
1.1 |
No |
100 |
0.7 |
Tetragon Financial |
635.0 |
4.7 |
34.4 |
63.0 |
288.5 |
(62.1) |
5.9 |
Yes |
100 |
4.0 |
Simple average |
593.4 |
22.1 |
19.7 |
49.3 |
107.6 |
(16.4) |
1.5 |
106 |
2.3 |
|
Fund rank in sector (17 funds) |
8 |
5 |
2 |
1 |
5 |
14 |
4 |
1 |
7 |
Source: Morningstar, Edison Investment Research. Note: *Performance to 20 April 2021 based on ex-par NAV. TR = total return. Net gearing is total assets less cash and equivalents as a percentage of net assets.
Dividends: Regular quarterly payments
UIL has the flexibility to pay dividends from capital as well as revenue reserves if required. It makes regular quarterly payments in December, March, June and September. For six consecutive years ending in FY19, UIL paid an annual dividend of 7.50p per share (fully covered in FY19 for the first time in six years). In FY20, the total distribution was increased to 7.875p per share, which was 5% higher year-on-year and was c 1.2x covered. There were two quarterly dividends of 2.00p per share declared in respect of H121, which were c 1.2x covered (revenue per share was 4.63p, +8.9% year-on-year). At the end of the period UIL had revenue reserves of £11.4m, which is equivalent to 13.2p per share (c 1.7x the FY21 total dividend if quarterly distributions of 2.00p per share are maintained).
Jillings is encouraged by UIL’s strong level of income, despite dividends having been under pressure – particularly in the UK – due to the coronavirus pandemic. Based on its current share price, UIL offers a dividend yield of 3.4%.
|
Exhibit 10: Dividend history since FY15 |
|
|
Source: Bloomberg, Edison Investment Research |
Valuation: Board targeting a 20% discount
UIL’s shares are currently trading at a 32.1% discount to cum-income NAV, which is narrower than the average discounts of 40.2%, 39.4%, 40.2% and 34.0% over the last one, three, five and 10 years respectively (based on monthly NAVs). Jillings is disappointed in the company’s valuation given its strong NAV performance, a lower level of gearing than historically and regular quarterly dividend payments, and the board continues to target a 20% discount. While the manager’s primary focus is managing UIL’s portfolio, he is hopeful of a narrower discount over the longer term, helped by share repurchases and continued marketing to existing and potential investors.
During 2020, UIL’s priorities were to protect its investments in the wake of the coronavirus outbreak and then to redeem the October 2020 ZDP shares. In H121, the company repurchased c 0.2m shares (equivalent to c 0.3% of the share base) at an average discount of 46.8%. Buybacks have accelerated in H221 and so far c 1.3m shares (c 1.5% of the share base) have been repurchased.
|
Exhibit 11: Discount over three years |
Exhibit 12: Buybacks and issuance |
|
|
|
Source: Refinitiv, Edison Investment Research. Note: Based on monthly NAVs. |
Source: Morningstar, Edison Investment Research |
|
Exhibit 11: Discount over three years |
|
|
Source: Refinitiv, Edison Investment Research. Note: Based on monthly NAVs. |
|
Exhibit 12: Buybacks and issuance |
|
|
Source: Morningstar, Edison Investment Research |
Fund profile: Seeking undervalued assets
UIL began trading on 20 June 2007 as the successor vehicle to Utilico Investment Trust (for more information about the company’s history, please see our December 2019 initiation report). It is a Bermuda-registered company listed on both the Specialist Fund Segment of the London Stock Exchange (which does not have any free float requirements) and the Bermuda Stock Exchange. UIL is managed by ICM Investment Management and ICM (collectively referred to as ICM), which has c $3bn of assets directly under management and is responsible for a further c $24bn of assets in subsidiary investments. Manager Charles Jillings and the rest of the ICM investment team aim to identify and invest in compelling long-term investments across the globe, where their forecast underlying values are not reflected in their current share prices. UIL may invest in shares, bonds, convertibles and other types of securities, including non-investment grade bonds. Unlisted securities of up to 25% of gross assets at the time of investment are also permitted. Derivative instruments are used for investment purposes and efficient portfolio management, and currency exposure may be hedged. UIL’s sector and geographic exposure is unrestricted, but at the time of investment, a single investment may not exceed 30% of gross assets (except for platforms, which may not exceed 50%). The company employs a levered strategy through ZDP shares and a limited amount of bank debt (see Gearing section on pages 10 and 11). UIL’s ZDP shares are listed on the Standard Segment of the Main Market of the London Stock Exchange. At end-March 2021, net gearing (ZDP shares plus borrowings) was 64.2%, which is below the board’s targeted maximum of 100%. UIL’s performance is benchmarked against a broad UK equity market index. Data from the company show that from inception to the end of March 2021, its NAV total return compounded at a rate of 11.6% pa.
Investment process: Long-term perspective
ICM’s investment teams are led by Duncan Saville and Charles Jillings. The other senior members of the team are Jacqueline Broers, Jonathan Groocock and Mark Lebbell, all focusing on the telecommunications, utilities and infrastructure sectors; fixed income specialist Gavin Blessing; Dugald Morrison, who covers resources; Jason Cheong, who focuses on technology; and Alasdair Younie and Ross Wilding, covering financial services. UIL seeks to generate long-term capital growth by investing in undervalued assets across the globe. Businesses may be under-priced for a variety of reasons including technological change, competition, an inefficient balance sheet, an underperforming management team or a lack of investor interest.
Around 80% of UIL’s portfolio is invested in four ICM-managed funds, referred to as ‘platforms’: Somers (financial services), Zeta Resources (natural resources), Utilico Emerging Markets Trust (emerging markets utilities and infrastructure) and Allectus Capital (technology, with a particular focus on fintech). Jillings suggests this approach offers the following benefits:
■
Focused strategy – each platform has a dedicated mandate, and the strategy has an objective of finding and implementing attractive investments within these.
■
Dedicated research analysts – for each platform they are focused on understanding existing portfolio businesses and identifying compelling investments.
■
Financial support – ability to draw on UIL’s support and financial backing.
■
Deep knowledge – utilising ICM’s knowledge across many jurisdictions to optimise investment opportunities and undertake corporate finance-led transactions.
The remaining c 20% of the fund is in direct holdings including Australian gold miner Resolute Mining. The manager stresses the importance of supporting investee companies with their capital requirements and says UIL may often be among their largest shareholders, maintaining regular contact with them. There is no limit as to how much of a company UIL can own, and it may sometimes take legal or management control of a firm.
UIL’s approach to ESG
ICM is committed to a strong environmental, social and governance (ESG) framework and is taking steps to strengthen its policy and public profile. The company has applied to the United Nations (UN) to become a signatory for its Principles for Responsible Investment (PRI). The UN PRI is an international organisation that works to promote the incorporation of environmental, social and corporate governance factors into investment decision-making.
UIL’s board believes it is in shareholders’ best interests to consider ESG factors when selecting and retaining investments. In conjunction with assessing the financial, macroeconomic and political drivers when making and monitoring an investment, the manager embeds ESG opportunities and risks into the firm’s investment process. Companies are scanned using a rigorous in-depth framework. However, the decision on whether to make an investment is not made on ESG grounds alone. Factors are incorporated into the investment process in four main ways:
■
Engaging with investee companies and in normal (ex-pandemic) times, visiting businesses on location to further develop a comprehensive and long-term perspective.
■
Gaining insight during company meetings, which is combined with in-depth internal research to gauge how ESG issues may affect an investment.
■
Integration of a company’s ESG profile into investment decisions.
■
Participation – continuous engagement with investee companies’ management teams and influencing best outcomes for shareholders on important issues.
The board believes that an analysis of ESG factors helps to enhance the understanding of a company, as they affect their business models and their long-term ability to generate sustainable returns. It also enables UIL’s investment team to fully question a company’s investment potential from a variety of perspectives. ESG practices of investee businesses are monitored on an ongoing basis to ensure that there are no material changes. Jillings comments that ‘the concept of responsible investing has always been one of the founding pillars of UIL’s and its predecessor’s investment process, therefore taking into consideration ESG risks and opportunities is not a new phenomenon’.
Fees and charges
ICM receives an annual management fee of 0.5% pa of UIL’s total assets less current liabilities (excluding borrowings and excluding the value of all holdings in companies managed or advised by ICM or its subsidiaries from which it receives a management fee), along with 45% of ICM’s costs of providing company secretarial services. ICM is entitled to a 15% performance fee on NAV returns above the higher of 5.0% or the UK gilt five- to 10-year index post-tax yield plus RPIX inflation. The NAV must exceed the high water mark NAV from when the performance fee was last paid (adjusted for capital events and dividends) and the fee is capped at 2.5% of financial year-end NAV (adjusted for capital events and dividends paid). It is also reduced to take into account any fees paid to ICM by companies where UIL is an investor. In H121, UIL’s ongoing charges (excluding performance fees) were 2.0% compared with 2.1% in FY20. Including performance fees, ongoing charges were 2.9% (no performance fees were payable for FY20).
Capital structure
|
Exhibit 14: Major shareholders |
Exhibit 15: Average daily volume |
|
|
|
Source: UIL, as at 31 March 2021. |
Source: Refinitiv. Note 12 months to 21 April 2021. |
|
Exhibit 14: Major shareholders |
|
|
Source: UIL, as at 31 March 2021. |
|
Exhibit 15: Average daily volume |
|
|
Source: Refinitiv. Note 12 months to 21 April 2021. |
UIL has 84.4m ordinary shares outstanding, the majority are of which are held by companies associated with ICM manager Duncan Saville; hence, the free float is c 21%. The company has an average daily trading volume of c 37k shares.
The board
Exhibit 16: UIL’s board of directors
Board member |
Date of appointment |
Remuneration in FY20 |
Current shareholdings |
Peter Burrows (chair since November 2015) |
September 2011 |
£23,000* |
909,617 |
Alison Hill |
November 2015 |
£34,000 |
81,619 |
Christopher Samuel |
November 2015 |
£34,000 |
211,454 |
David Shillson |
November 2015 |
£34,000 |
123,109 |
Stuart Bridges |
October 2019 |
£33,000 |
136,937 |
Source: UI. Note: *Burrows waived £23,000 of his £46,000 fee in FY20.
Collectively, UIL’s board has experience in a wide range of financial services and the law. Shillson is considered to be a non-independent director as he is a senior partner of a law firm that has acted for associates of UIL and ICM.
|
|
Research: Investment Companies
Mutares (MUX) reported an exceptional year in terms of portfolio expansion, ending 2020 with 20 platform investments (vs 13 in FY19). These companies generate €2.2bn revenues annually and MUX’s income from management and consulting increased 61% y-o-y to €66.5m. The proceeds from the recent record-quick exit from Nexive (closed in January 2021) allowed management to propose a 50% higher year-on-year dividend, which implies a 6.5% yield on the current share price.