Last close As at 06/08/2026
—
— 0.00 (0.00%)
Market capitalisation
—
Research: Investment Companies
Securities Trust of Scotland
Written by
Securities Trust of Scotland |
New manager and newly unconstrained approach |
Investment trusts |
22 June 2016 |
Share price/discount performance
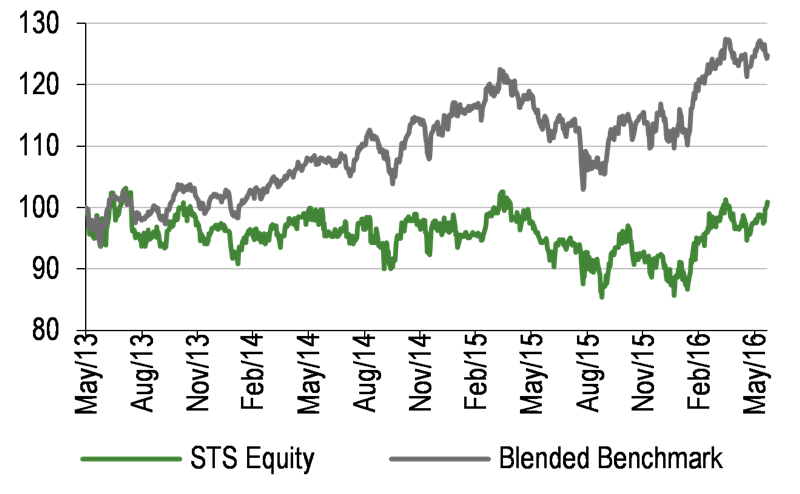
Three-year cumulative perf. graph
Gearing
Analyst
|
|||||||||||||||||||||||||||||||||||||||||||||||||||||||||||||||||||||||||||||||||||
Securities Trust of Scotland (STS) has revamped its investment approach, appointing Martin Currie’s income team head Mark Whitehead as lead manager and adopting an unconstrained and high-conviction strategy to meet its objective of producing real growth in capital and income, rather than measuring performance against a backward-looking market index. The more flexible mandate will allow the limited use of options and the gearing facility will be increased. These changes build on a new dividend policy announced by the board last year, which has brought STS’s yield into line with its peer group at more than 4%, and the manager’s focus on quality companies with sustainable earnings may enhance future performance and help to narrow the trust’s discount to NAV.
12 months ending |
Share price |
NAV |
Blended benchmark (%) |
FTSE All-Share (%) |
MSCI |
31/05/12 |
3.5 |
(1.5) |
(1.6) |
(8.0) |
(4.3) |
31/05/13 |
35.4 |
29.3 |
30.2 |
30.1 |
30.5 |
31/05/14 |
(0.8) |
3.8 |
7.8 |
8.9 |
8.0 |
31/05/15 |
(1.8) |
7.1 |
9.8 |
7.5 |
16.8 |
31/05/16 |
0.4 |
0.3 |
5.3 |
(6.3) |
1.3 |
Source: Thomson Datastream. Note: Total returns in sterling. Blended benchmark is FTSE All-Share Index until 31 July 2011 and MSCI World High Dividend Yield Index thereafter.
Investment strategy: Focus on quality and value
New STS manager Mark Whitehead, who heads Martin Currie’s dedicated income team, seeks to build a portfolio of 35-55 high-quality stocks at sensible valuations, with the aim of producing a rising income as well as capital growth. The investment process is research-intensive, with the team building detailed five-year models on potential holdings, incorporating stress tests to assess each company’s capital structure and whether its cash flows are robust enough to produce a growing income in a range of market conditions. Risk controls ensure appropriate diversification by country, sector and company size.
Market outlook: Near-term volatility likely
The summer months are often a volatile period for equity markets, and this year investors must also contend with a combination of geopolitical and economic worries, from the UK’s EU referendum and the US presidential election, to slowing economic growth in China and uncertainty over monetary policies globally. Against such a backdrop, short-term volatility may persist, underlining the importance of dividends as a component of total return.
Valuation: Scope to narrow from above-average level
At 20 June, STS’s shares traded at a 3.2% discount to cum-income NAV. This is wider than the three- and five-year historical averages, partly reflecting generally wider investment trust discounts against a backdrop of volatile markets. The board is active in buying back shares to keep the discount below c 7.5%, but there is potential for it to narrow naturally should the trust’s new unconstrained and high-conviction approach prove appealing to investors.
Exhibit 1: Trust at a glance
Investment objective and fund background |
Recent developments |
||||||||||||||||||||||||||||||||||||||||||||||||||||||||||||||||||||||
Securities Trust Of Scotland’s investment objective is to provide rising income and long-term capital growth through a portfolio of global equities. Following the adoption of an unconstrained mandate, from 1 June 2016 the trust will measure its performance versus the rolling three-year median return of open- and closed-ended peers, as well as an absolute target to produce real growth in revenue and cum-income NAV on a rolling five-year basis. |
■ 11 May 2016: Annual results for the year ended 31 March. NAV TR 0.0% versus +4.4% for MSCI World High Dividend Yield Index. Share price total return -2.2%. Total dividends of 5.8p per share, 18% higher than FY15. Announcement of new lead manager, strategy and benchmark, and increased borrowing facility. Rachel Beagles to become chairman at July AGM, replacing Neil Donaldson. John Evans appointed to board. |
||||||||||||||||||||||||||||||||||||||||||||||||||||||||||||||||||||||
Forthcoming |
Capital structure |
Fund details |
|||||||||||||||||||||||||||||||||||||||||||||||||||||||||||||||||||||
AGM |
July 2016 |
Ongoing charges |
1.0% (as at 31 March 2016) |
Group |
Martin Currie Investment Mgmt (UK) |
||||||||||||||||||||||||||||||||||||||||||||||||||||||||||||||||||
Interim results |
November 2016 |
Gearing |
6.9% (net) |
Manager |
Mark Whitehead |
||||||||||||||||||||||||||||||||||||||||||||||||||||||||||||||||||
Year end |
31 March |
Annual mgmt fee |
0.6% of net assets |
Address |
Saltire Court, 20 Castle Terrace, Edinburgh EH1 2ES |
||||||||||||||||||||||||||||||||||||||||||||||||||||||||||||||||||
Dividend paid |
Quarterly |
Performance fee |
None |
||||||||||||||||||||||||||||||||||||||||||||||||||||||||||||||||||||
Launch date |
28 June 2005 |
Trust life |
Indefinite |
Phone |
+44 (0) 131 229 5252 |
||||||||||||||||||||||||||||||||||||||||||||||||||||||||||||||||||
Continuation vote |
None |
Loan facilities |
£17m (see page 7) |
Website |
|||||||||||||||||||||||||||||||||||||||||||||||||||||||||||||||||||
Dividend policy and history |
Share buyback policy and history |
||||||||||||||||||||||||||||||||||||||||||||||||||||||||||||||||||||||
Dividends paid quarterly in September, December, March and June. Dividends were increased substantially for FY16 after the announcement of a new progressive dividend policy. |
Renewed annually, the trust has authority to purchase up to 14.99% and allot up to 5% of issued share capital. The chart below shows financial years. |
||||||||||||||||||||||||||||||||||||||||||||||||||||||||||||||||||||||
|
|
||||||||||||||||||||||||||||||||||||||||||||||||||||||||||||||||||||||
Shareholder base (as at 30 April) |
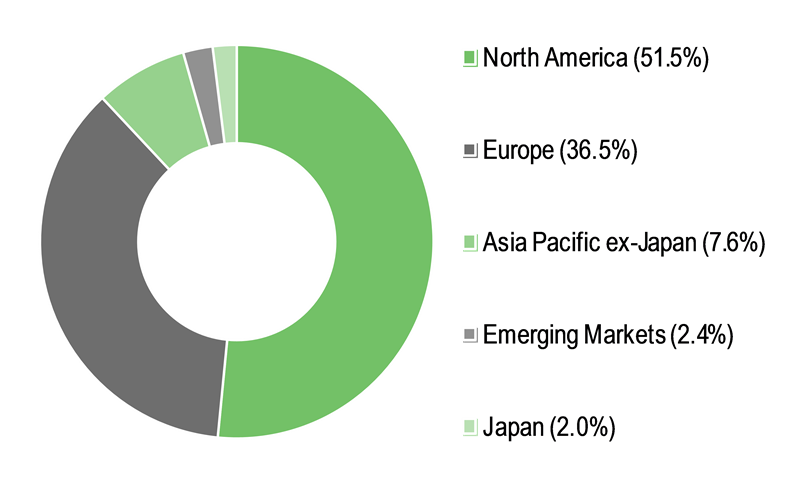
Portfolio exposure by geography (as at 31 May 2016, net of cash/gearing) |
||||||||||||||||||||||||||||||||||||||||||||||||||||||||||||||||||||||
|
|
||||||||||||||||||||||||||||||||||||||||||||||||||||||||||||||||||||||
Top 10 holdings (as at 31 May 2016) |
|||||||||||||||||||||||||||||||||||||||||||||||||||||||||||||||||||||||
|
|||||||||||||||||||||||||||||||||||||||||||||||||||||||||||||||||||||||
Source: Securities Trust of Scotland, Edison Investment Research, Morningstar, Bloomberg. Note: *N/A where not in May 2015 top 10.
Recent developments
In its annual results for the year ended 31 March 2016, Securities Trust of Scotland (STS) revealed a number of enhancements to its investment approach, with the intention of better fulfilling its objective of providing a rising income and long-term capital growth for investors. These are summarised below, and explored at greater length in the body of this report.
■
New manager: Mark Whitehead, who recently joined Martin Currie as head of its new income team, has taken on lead manager responsibility for the trust. He brings a wider skill set to the team, having managed multi-asset portfolios over 15 years at Sarasin & Partners, although STS will still be overwhelmingly an equity portfolio. Former manager Alan Porter remains part of the team and will have continued input to the trust.
■
New investment approach: STS will follow an unconstrained, high-conviction approach, with a shorter stock list of 35-55 companies. There is an emphasis on quality businesses, and the manager sees growth potential, rather than a high yield, as the starting point in building an income portfolio. In-house research and modelling and the stress-testing of assumptions should combine to produce a portfolio of companies offering sustainable income and growth. Governance and sustainability factors are also assessed. The manager may make use of stock lending and option writing as a means of enhancing income.
■
New ways of measuring performance: While STS’s portfolio construction was not driven by benchmark (MSCI World High Dividend Yield Index) weightings under its former strategy, the board has reviewed the appropriateness of measuring performance against the index, where construction is backward-looking and there is a high level of turnover, as well as high stock and income correlation. In future, the trust’s performance will be measured with reference to the median returns of a peer group of open-ended (Lipper sector) and closed-ended (AIC sector) global equity income funds on a rolling three-year basis. In recognition of the trust’s investment objective of delivering rising income and long-term capital growth, there is also an absolute target of real growth in revenue earnings and cum-income NAV on a rolling five-year basis.
■
New gearing facility: STS will increase its available gearing from £17m to £20m, and also increase its maximum permitted gearing from 15% to 20% of net assets, in order to give the manager greater investment flexibility in volatile market conditions.
In addition, STS modified its dividend policy in 2015 to adopt a progressive approach to dividend payments, and increased its FY16 dividend by 18% versus FY15, bringing it more into line with the peer group. It may now partly fund dividends from its large capital reserves in the event of a revenue shortfall. The board sees this as a more desirable way of boosting the dividend than relying on a higher level of gearing, or increasing the weighting in high-yielding stocks whose dividends may not be sustainable.
Fund profile: Unconstrained global income and growth
STS was set up in 1889 as an investment trust, and reconstituted in 2005 under the same name following the failure of a hostile takeover bid. It is managed from Edinburgh by Mark Whitehead (see above), the head of the income team at Martin Currie (part of the Legg Mason group of companies). Previously focused on the UK equity market, in July 2011 it adopted a global equity income strategy. Until 1 June 2016, the trust used the MSCI World High Dividend Yield Index as a performance benchmark, but having modified its investment approach to be more high-conviction and unconstrained, it will measure future performance against a peer group of open- and closed-ended global equity income funds. The portfolio is relatively concentrated, with 35-55 stocks, seeking to provide investors with a rising income and long-term capital appreciation.
The fund manager: Mark Whitehead
The manager’s view: Quality the key to income and growth
New fund manager Mark Whitehead notes that while high-yielding equities have historically produced better risk-adjusted returns than other assets, a subset of high-quality companies (as measured by high returns on invested capital, strength of balance sheet, liquidity and operational efficiency) has outperformed. He argues that there is a strong relationship between the highest returns on invested capital and dividend growth, making a focus on quality a sensible strategy for an income fund manager. In Whitehead’s view, a high-quality, growing income stock is one with the autonomy to invest through the cycle where others cannot, and will produce better growth as a result. Assessing quality is a key part of STS’s revamped investment process (see below), and Whitehead argues that it can be found even in sectors that otherwise have poor fundamentals. An example is Chevron, the second-largest holding at 31 May, which the manager says will be more likely to cover its dividend with organic free cash flow than other oil companies if the current low level of oil price persists.
Asset allocation
Investment process: Focus on in-house research
Manager Mark Whitehead, who joined Martin Currie in late 2015, has built a dedicated equity income team of four portfolio managers (including former STS manager Alan Porter) and three specialist equity income analysts. All the portfolio managers also conduct research and analysis. The analysts have sector specialisms, and cover funds (such as private equity, infrastructure and real estate investment trusts) as well as operating companies; as a result, the STS portfolio may include some fund investments in future, although it will remain fundamentally an equity portfolio.
Research is key to the process. The team monitors the universe of potential investments, and the first step towards inclusion is an early-stage pitch to colleagues and Martin Currie’s wider global equities team, to debate whether a stock warrants further research. Ideas that get past this hurdle are modelled in a proprietary template, building five years of explicit assumptions using discounted cash flow forecasts or dividend discount models. Team members work closely with the management of potential holdings when building models, to ensure the output is both realistic and conservative. The team uses income metrics such as cash flow return on investment and free cash flow yield to compare companies across sectors and regions, and then ranks stocks in order of conviction.
Although STS has an income mandate, Whitehead says that assessing growth is the starting point when identifying investments. He argues that the value focus of many income funds can lead to capital and income volatility, as high-yield stocks can be at greater risk of cutting their dividends. The team seeks to identify genuine, sustainable growth, leading to a bias towards quality companies with strong franchises and management, a competitive advantage and the ability to convert revenue growth into growing free cash flow. Dividend growth is more important than a high starting yield, and positions may be taken in companies that are not currently paying a dividend, as long as there is a realistic prospect of their doing so in the near future.
A differentiating feature of the process is the team’s focus on credit analysis. Debt structures are analysed to ensure that companies have the financial autonomy to invest throughout economic cycles, and will not be forced to scale back operations in order to service debt in a rising interest rate environment. The team also stress-tests cash flows to assess a company’s ability to continue paying and growing its dividends. Whitehead says the most important factor is that companies generate sufficient organic cash flows to cover their dividends, and by stress-testing the models, the team can experiment with a range of possible economic and market conditions to gauge the impact on a firm’s ability to meet its obligations. STS also has a strong focus on corporate governance, predicated on the view that well-run firms perform better. Supported by Martin Currie’s dedicated head of governance and sustainability, the team assesses the quality of management and seeks to understand the structures in place to mitigate operational risk. The trust also votes at all investee company AGMs.
With a focused stock list of 35-55 stocks (43 across 14 countries at 31 May), only the team’s ‘best ideas’ will be included in the STS portfolio. Positions are sized based partly on conviction but also on an assessment of cyclicality and the likelihood of the investment thesis working; stocks deemed to be higher-risk may be given a lower weighting. There is no minimum position size and the maximum weighting in a stock is 7%. Risk is monitored by Martin Currie’s specialist risk team, not just in terms of volatility (measured by country, sector, stock and market capitalisation) but also liquidity and correlation between stocks.
Holdings may be sold if the investment thesis has played out successfully, or the thesis has been violated by factors such as a change in management or the competitive landscape, or simply if the team sees better ideas elsewhere. If a share price has fallen by 20% since purchase, the stock will be reviewed by someone other than the original analyst, and action taken – the position may be sold, but if the original thesis still stands, the holding may be increased. Portfolio turnover is expected to settle at 30-35% a year once the initial repositioning has been completed.
The manager may use options to enhance income or for efficient portfolio management. Covered calls may be written over holdings the manager wishes to sell, if sufficient near-term volatility is expected to generate an attractive premium. Put options may be written for stocks the manager would be happy to buy at a lower price. Maximum gross exposure will be 15%, and Whitehead says that throughout a cycle he expects to generate 5-10% of portfolio income through options writing.
Current portfolio positioning
Exhibit 2 below shows STS’s portfolio breakdown by sector at 31 May, while the geographical breakdown is shown in Exhibit 1 on page 2. The process of rebalancing the portfolio in line with the new investment process has so far been incremental, with the team working through all the stocks to see what they are happy to keep in the short or long term, or where they might seek a better idea. The manager expects there will be 10 new holdings by the end of his first half-year in charge. New investments include Airbus (bought in late 2015/early 2016 after the establishment of the new income team), which has a very high market share in the next generation of narrow-body aircraft that will help to meet increasing demand for air travel from emerging market consumers. Whitehead also expects to increase the proportion in smaller stocks – an example is recent purchase CTT Correios de Portugal (the Portuguese post office), which has a market cap of just over £1bn.
Exhibit 2: Portfolio sector exposure vs index (% unless stated)
Portfolio |
Portfolio |
Change |
MSCI World Index weight |
Active weight vs index (% pts) |
Trust weight/ index weight (x) |
|
Financials |
19.8 |
17.4 |
2.4 |
20.0 |
-0.1 |
1.0 |
Consumer staples |
16.9 |
13.5 |
3.4 |
10.8 |
6.2 |
1.6 |
Industrials |
16.2 |
11.7 |
4.5 |
10.9 |
5.3 |
1.5 |
Healthcare |
15.9 |
17.0 |
-1.1 |
13.1 |
2.8 |
1.2 |
Telecommunications |
8.3 |
7.4 |
0.9 |
3.6 |
4.7 |
2.3 |
Energy |
7.6 |
11.1 |
-3.5 |
6.6 |
1.0 |
1.1 |
Utilities |
7.2 |
5.3 |
1.9 |
3.4 |
3.8 |
2.1 |
Information technology |
5.4 |
2.5 |
2.9 |
14.2 |
-8.8 |
0.4 |
Materials |
5.0 |
7.1 |
-2.1 |
4.7 |
0.3 |
1.1 |
Consumer discretionary |
4.6 |
15.0 |
-10.4 |
12.9 |
-8.3 |
0.4 |
Cash |
3.7 |
1.4 |
2.3 |
0.0 |
3.7 |
N/A |
Gearing |
-10.6 |
-9.4 |
-1.2 |
0.0 |
-10.6 |
N/A |
100.0 |
100.0 |
0.0 |
100.0 |
0.0 |
Source: Securities Trust of Scotland, Edison Investment Research
Performance: New strategy to drive improvement
|
Exhibit 3: Investment trust performance to 31 May 2016 |
||||||||
Price, NAV and benchmark total return performance, one-year rebased |
Price, NAV and benchmark total return performance (%) |
|||||||
|
|
|||||||
|
Source: Thomson Datastream, Edison Investment Research. Note: Three, five and 10-year performance figures annualised. Blended benchmark is FTSE All-Share until 31 January 2011, and MSCI World High Dividend Yield Index thereafter. A new performance measure based on the rolling three-year returns of a peer group has been adopted with effect from 1 June 2016. |
||||||||
|
Exhibit 4: Share price and NAV total return performance, relative to indices (%) |
||||||||
|
One month |
Three months |
Six months |
One year |
Three years |
Five years |
10 years |
|
Price relative to blended benchmark |
0.5 |
(0.8) |
(2.1) |
(4.7) |
(21.5) |
(14.2) |
(13.0) |
|
NAV relative to blended benchmark |
(1.0) |
(2.3) |
(3.6) |
(4.7) |
(10.6) |
(11.1) |
(17.3) |
|
Price relative to FTSE All Share |
0.6 |
0.0 |
6.2 |
7.1 |
(10.8) |
4.4 |
5.9 |
|
NAV relative to FTSE All Share |
(0.9) |
(1.5) |
4.5 |
7.0 |
1.7 |
8.2 |
0.6 |
|
Price relative to MSCI World |
(0.0) |
(0.8) |
2.4 |
(0.9) |
(23.5) |
(14.2) |
(16.4) |
|
NAV relative to MSCI World |
(1.5) |
(2.3) |
0.8 |
(1.0) |
(12.8) |
(11.1) |
(20.6) |
|
Source: Thomson Datastream, Edison Investment Research. Note: Data to end-May 2016. Geometric calculation.
Under its former strategy, STS has produced NAV and share price total returns of 6-7% a year (Exhibit 3, right-hand chart, over five years). However, performance has lagged the MSCI World High Dividend Yield Index over almost all periods, particularly the last 12 months (Exhibit 5). Exhibit 4 also includes performance relative to the FTSE All-Share Index, which was the trust’s benchmark until it adopted a global equity income strategy in February 2011. STS has outperformed the UK index over most periods shown, suggesting the change in focus has been beneficial to investors. From 1 June 2016, the trust no longer uses an index benchmark, but will measure its performance versus the three-year rolling median return of a peer group of open- and closed-ended funds, as well as having absolute revenue and NAV performance targets. The board and management expect that the new, unconstrained investment strategy has a greater likelihood of success in fulfilling the trust’s investment objective of providing rising income and long-term capital growth.
|
Exhibit 5: Five-year NAV performance relative to MSCI World High Dividend Yield Index |
|
|
Source: Thomson Datastream, Edison Investment Research |
Capital structure and fees
STS is a conventional investment trust with one class of share. At 20 June 2016, there were 112.2m ordinary shares in issue. This was a reduction of 6% over 12 months as a result of the trust’s discount management policy (see above). The trust has a flexible borrowing arrangement of £17m. The planned increase in available gearing from £17m to £20m comes with an attendant rise in the maximum permitted gearing level, from 15% to 20%. Fully drawn, the available gearing would equate to c 12% of net assets.
Martin Currie receives an annual management fee of 0.6% of net assets, allocated 65% to capital and 35% to revenue, in line with the expected split of returns between capital gains and income. There is no performance fee, and ongoing charges for FY16 were 1.0%, unchanged from FY15.
Dividend policy and record
In May 2015, the board announced a new progressive dividend policy for STS, to bring its yield more in line with that of the peer group. The trust pays dividends quarterly, in September, December, March and June, and the 5.8p paid in respect of FY16 was 18% higher than for FY15, building on a six-year record of maintaining or increasing dividends. Under the new policy, the dividend may be paid in part out of capital – a flexibility that the board sees as more attractive on a risk/reward basis than increasing gearing or investing in higher-yielding stocks whose dividends may be under pressure. Net revenue returns per share of 4.73p for FY16 were 7.4% below the FY15 figure, and the FY16 dividend was partly funded from the small revenue reserve. Future shortfalls in revenue versus dividends are likely to be funded from STS’s much larger capital reserves. Based on the current share price of 137.8p and the FY16 dividend, STS yields 4.2%.
Peer group comparison
STS is a member of the AIC’s Global Equity Income sector, a group of nine trusts with differing investment approaches. The trust’s NAV total return performance is below the weighted average over one year, but ahead over three and five years. Risk-adjusted performance as measured by the Sharpe ratio is close to the average over one and three years. Ongoing charges are average, and STS does not charge a performance fee. Gearing is below average, while the discount is the third-widest. Following the adoption of a progressive dividend policy from FY16, STS now has a yield broadly in line with the sector average.
Exhibit 7: Global Equity Income investment trusts at 20 June 2016
% unless stated |
Market cap £m |
TR 1 Year |
TR 3 Year |
TR 5 Year |
Ongoing charge |
Perf. fee |
Discount (ex-par) |
Net gearing |
Dividend yield (%) |
Sharpe 1y (NAV) |
Sharpe 3y (NAV) |
Securities Trust of Scotland |
154.6 |
4.3 |
16.4 |
47.4 |
0.9 |
No |
(2.6) |
107 |
4.2 |
(0.3) |
0.4 |
Blue Planet Investment Trust |
18.1 |
(14.3) |
22.1 |
|
3.8 |
No |
(21.5) |
141 |
7.7 |
(1.0) |
0.4 |
F&C Managed Portfolio Income |
46.4 |
(4.4) |
14.4 |
41.4 |
1.2 |
Yes |
0.2 |
97 |
4.6 |
(1.1) |
0.3 |
Henderson International Income |
198.1 |
5.9 |
26.7 |
55.8 |
1.1 |
No |
4.6 |
103 |
3.5 |
0.1 |
0.8 |
Invesco Perp Select Global Eq Inc |
50.5 |
1.8 |
27.6 |
55.6 |
1.0 |
Yes |
(0.7) |
111 |
3.2 |
(0.2) |
0.6 |
London & St Lawrence |
98.1 |
(0.8) |
22.5 |
51.4 |
0.9 |
Yes |
(4.7) |
99 |
4.2 |
(0.7) |
0.5 |
Murray International |
1,211.5 |
7.5 |
8.2 |
29.6 |
0.7 |
No |
3.9 |
115 |
4.8 |
(0.2) |
0.0 |
Scottish American |
357.8 |
5.7 |
24.9 |
37.7 |
0.9 |
No |
0.1 |
124 |
4.0 |
(0.1) |
0.6 |
Seneca Global Income & Growth Trust |
57.7 |
0.9 |
22.0 |
42.3 |
1.5 |
No |
0.2 |
111 |
4.0 |
(0.6) |
0.6 |
Sector weighted average |
5.7 |
14.9 |
36.8 |
0.9 |
2.0 |
114 |
4.5 |
(0.2) |
0.3 |
||
STS rank in sector |
4 |
4 |
7 |
4 |
6 |
7 |
6 |
4 |
5 |
7 |
Source: Morningstar, Edison Investment Research. Note: TR=NAV total return. Sharpe ratio is a measure of risk-adjusted return. The ratios shown are calculated by Morningstar for the past 12- and 36-month periods by dividing a fund’s annualised excess returns over the risk-free rate by its annualised standard deviation. Net gearing is total assets less cash and equivalents as a percentage of net assets (100 = ungeared).
The board
STS currently has six non-executive directors, although this will drop to five when Chairman Neil Donaldson, who has been a board member since the trust’s reconstruction in 2005, steps down at the AGM in July 2016. He will be succeeded by Rachel Beagles, a director since 2010. Andrew Irvine, senior independent director, has also been on the STS board since 2005. Angus Gordon Lennox was appointed in November 2013 and Mark Little became a director in October 2014. The newest director, John Evans, joined the board in February 2016. The directors have backgrounds in business, finance and investment management.
|