Last close As at 05/08/2026
—
— 0.00 (0.00%)
Market capitalisation
—
Research: Investment Companies
Schroder AsiaPacific Fund
Schroder AsiaPacific Fund |
Stock selection in a growth region |
Investment trusts |
18 March 2016 |
Share price/discount performance
Three-year cumulative perf. graph
Gearing
Analysts
|
|||||||||||||||||||||||||||||||||||||||||||||||||||||||||||||||||||||||||||||||||||||
Schroder AsiaPacific Fund (SDP) seeks to deliver long-term capital growth by investing in companies in Asia, excluding Japan. Since launch in 1995, the portfolio has been managed by Matthew Dobbs, who focuses on individual stock selection, with an awareness of macroeconomic factors. He is supported by a large research team based in Asia. There is a focus on companies with visible earnings growth, sustainable returns and valuation support. Over most time periods, the performance of the fund versus the benchmark has been positive.
12 months ending |
Total share price |
Total NAV |
Benchmark* |
MSCI World |
FTSE All-Share |
29/02/12 |
15.5 |
11.8 |
3.8 |
0.1 |
1.5 |
28/02/13 |
14.9 |
19.2 |
11.4 |
16.5 |
14.1 |
28/02/14 |
(13.9) |
(13.6) |
(9.6) |
10.2 |
13.3 |
28/02/15 |
29.3 |
26.0 |
20.8 |
17.0 |
5.6 |
29/02/16 |
(10.3) |
(8.1) |
(11.8) |
(1.3) |
(7.3) |
Source: Thomson Datastream. Total return basis. Note: *Benchmark is MSCI AC Far East ex-Japan until 30 January 2011 and MSCI AC Asia ex-Japan thereafter.
Investment strategy: Focused on stock selection
SDP offers diversified exposure to the Asia Pacific ex-Japan region via a portfolio of 70-90 stocks, selected primarily on a bottom-up basis. Holdings tend to fall into four broad categories: positive transition, core stocks with superior business models, opportunistic positions and those based on intrinsic value. The manager is not constrained by the benchmark and the portfolio has a high active share. At the end of February 2016, the portfolio had a high active share of 72.6%, with 22.7% of the portfolio in non-index stocks. Input to stock selection is provided by a team of 43 analysts based in seven Asian regional offices, including India.
Market outlook: Valuation may present an opportunity
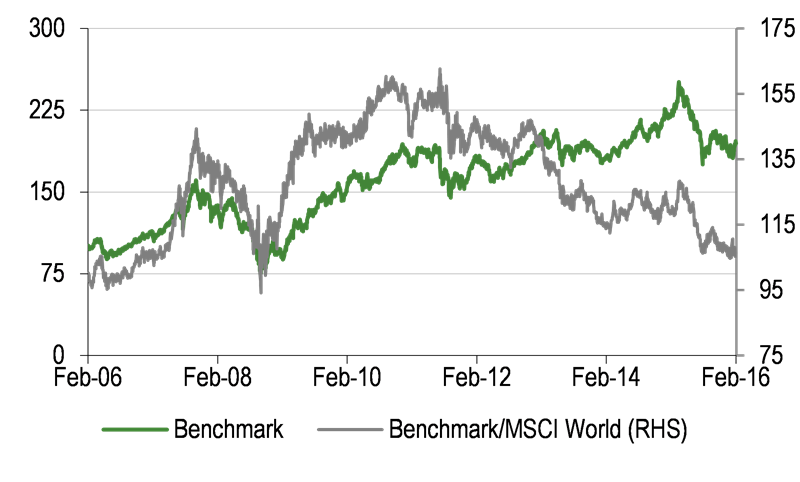
Asian equities have lagged the world market since 2011, primarily as a result of a strong US market. Heightened concerns regarding developments in the Chinese economy have led to a further leg down in relative performance. Although global growth estimates are being revised down, the outlook for GDP growth in the Asia Pacific ex-Japan region is significantly above that for advanced economies, driven in part by rising disposable incomes and relatively low household debt. As a result, the P/E valuation discount of c 20% in the region versus the world index may present an opportunity to investors with a longer-term outlook.
Valuation: Potential for discount to narrow
The current cum-income discount of 11.0% is wider than the one-, three-, five- and 10-year averages, probably reflecting concerns about China. Given the positive long-term performance of the fund, over time, if sentiment towards the region improves there is the potential for the discount to narrow. An informal discount control policy aims to maintain the long-term, cum-income discount below 10%.
Schroder AsiaPacific Fund is a research client of Edison Investment Research Limited
Exhibit 1: Trust at a glance
Investment objective and fund background |
Recent developments |
|||||||||||||||||||||||||||||||||||||||||||||||||||||||||||||||||||||||||||
Schroder AsiaPacific Fund aims to achieve capital growth through investment primarily in the equity of companies located in the continent of Asia (excluding the Middle East and Japan), together with the Far Eastern countries bordering the Pacific Ocean, with the aim of achieving growth in excess of the MSCI All Countries Asia ex-Japan index in sterling terms over the longer term. Until 30 January 2011, the benchmark was the MSCI All Countries Far East ex-Japan index, but it was changed to an index that included India to reflect the growing importance of the Indian stock market. |
■ 28 January 2016: Retirement of chairman Rupert Carington. ■ 17 December 2015: Annual report for year to 30 September 2015. NAV TR of -3.3% vs -6.0% for the benchmark MSCI All Countries Asia ex-Japan index. Share price TR of -5.7%. ■ 17 December 2015: Final dividend of 4.20p declared, an increase of 53% year-on-year. ■ 28 May 2015: Half-yearly report for the six months ending 31 March 2015. NAV TR of 15.2% vs 14.8% for the benchmark. Share price TR of 14.0%. |
|||||||||||||||||||||||||||||||||||||||||||||||||||||||||||||||||||||||||||
Forthcoming |
Capital structure |
Fund details |
||||||||||||||||||||||||||||||||||||||||||||||||||||||||||||||||||||||||||
AGM |
January 2017 |
Ongoing charges |
1.03% |
Group |
Schroder Unit Trust Ltd |
|||||||||||||||||||||||||||||||||||||||||||||||||||||||||||||||||||||||
Annual results |
December 2016 |
Net gearing |
5.8% |
Managers |
Matthew Dobbs |
|||||||||||||||||||||||||||||||||||||||||||||||||||||||||||||||||||||||
Year end |
30 September |
Annual mgmt fee |
Tiered, 0.80-0.95% (page 7) |
Address |
31 Gresham Street, |
|||||||||||||||||||||||||||||||||||||||||||||||||||||||||||||||||||||||
Dividend paid |
February |
Performance fee |
None |
|||||||||||||||||||||||||||||||||||||||||||||||||||||||||||||||||||||||||
Launch date |
November 1995 |
Trust life |
Indefinite |
Phone |
020 7658 3206 |
|||||||||||||||||||||||||||||||||||||||||||||||||||||||||||||||||||||||
Continuation vote |
Five yearly, next in 2021 |
Loan facilities |
£30m revolving, £30m o’draft |
Website |
||||||||||||||||||||||||||||||||||||||||||||||||||||||||||||||||||||||||
Dividend policy and history |
Share buyback policy and history |
|||||||||||||||||||||||||||||||||||||||||||||||||||||||||||||||||||||||||||
Dividend paid annually in February. While the trust is focused on capital growth, it has paid dividends in 18 of its 20 years. |
SDP targets a discount of below c 10%. Issuance in the chart below includes exercise of subscription shares. |
|||||||||||||||||||||||||||||||||||||||||||||||||||||||||||||||||||||||||||
|
|
|||||||||||||||||||||||||||||||||||||||||||||||||||||||||||||||||||||||||||
Shareholder base (as at 14 March 2016) |
Geographical breakdown of portfolio (as at 29 February 2016) |
|||||||||||||||||||||||||||||||||||||||||||||||||||||||||||||||||||||||||||
|
|
|||||||||||||||||||||||||||||||||||||||||||||||||||||||||||||||||||||||||||
Top 10 holdings (as at 29 February 2016) |
||||||||||||||||||||||||||||||||||||||||||||||||||||||||||||||||||||||||||||
|
||||||||||||||||||||||||||||||||||||||||||||||||||||||||||||||||||||||||||||
Source: Schroder AsiaPacific Fund, Edison Investment Research, Morningstar, Thomson. Note: *N/A where not in February 2015 top 10.
Market outlook: Higher relative growth
Over the last 12 months, the benchmark has been weak in both absolute and relative terms, reflecting increasing concerns about developments in the Chinese economy in particular. However, despite global and Asian growth expectations generally being revised down, forecast GDP growth in Asia ex-Japan is still significantly higher than for advanced economies. On a longer-term view, drivers include growth in consumption as a result of higher disposable income, still relatively low household debt and low unemployment, growth in trade and financial services and infrastructure spending. Looking at valuation, the Datastream Asia ex-Japan index forward P/E multiple now stands at a c 20% discount to the world index, close to the low end of the five-year range.
For investors wanting to take advantage of the depressed valuations in the region, but nervous of exposure to value traps, a fund such as SDP with an active stance based on stock selection could be appealing.
|
Exhibit 2: Market valuation and performance |
|
Asia ex-Japan benchmark and relative |
DS Asia ex-Japan vs DS World valuation comparison |
|
|
|
Source: Thomson Datastream, Edison Investment Research |
|
Fund profile: Stock selection in Asia Pacific ex-Japan
SDP was launched in 1995 to seek capital growth from investing in companies in Asia excluding Japan. Since inception it has been managed by Matthew Dobbs, now head of global small-cap equities at Schroders. Having joined the company in 1981, he has been running Asian specialist funds since 1985. Dobbs works closely with Richard Sennitt in Schroder’s London office; he also manages the Schroder Oriental Income Fund. The SDP portfolio targets 70-90 holdings. There is a focus on companies with visible earnings growth, sustainable returns and valuation support, which can lead to significant underweight positions in certain sectors and countries. Risk controls dictate that no more than 15% can be invested in a single company and no more than 10% can be invested in other UK-listed investment companies. Up to 5% may be invested in unlisted securities, but in practice no such investments are held. While portfolio composition largely reflects individual stock selection and a consideration of fundamental risks, a proprietary risk management system provides an independent assessment, giving a quantitative view of the portfolio characteristics.
The fund manager: Matthew Dobbs
The manager’s view: Value in China
The manager can see value in parts of the Chinese stock market, having been cautious about the rally seen up to mid-2015. Dobbs acknowledges that there are risks that the economic situation in China deteriorates significantly, with the scale of credit growth a particular concern and underlying ‘real’ growth probably running in the region of 3-4%. Against this he believes the authorities will be able to navigate out of a worst-case scenario that might involve a collapse in the currency, deflation or a significant rise in bad debts. Positively, recent consumer statistics are not bad, with migrant worker wages up 7% year-on-year, for example. China is not losing share in the export market and the trade surplus is rising. China is the key domestic risk to Asian equities but, with the regional market now on a 1.2x price to book value, markets are at a level where, historically, buying has been rewarded.
Portfolio turnover can vary and has been 31.3% over the last 12 months. There are a number of new positions in the portfolio, but over the last 12 months, the basic core shape of the portfolio has not changed very much. The key investible themes remain the same, eg strong free cash flow generation, low-cost production and sustainable yield.
The portfolio is underweight the top decile companies in terms of market capitalisation. Dobbs comments that this does not reflect a top-down decision, but arises from stock selection and the rich opportunity set among mid- and smaller-cap companies in Asia, particularly in the consumer-related sectors. By contrast, some of the mega-caps face structural headwinds.
Asset allocation
Investment process: Stock selection drives performance
Matthew Dobbs and his colleague Richard Sennitt are based in London. They both have many years’ experience of investing in Asia (Dobbs has 34 and Sennitt has 22) and have daily contact with Schroders’ analysts based in Asia. The team of 43 operates from seven regional offices, including India. During 2015, Raymond Maguire was appointed as the new head of Asia research; he has introduced a new research template, which facilitates the screening of a broader universe of stocks.
The investment process is based around stock selection, with ideas generated by the manager and the in-house analysts. Resources include company meetings and quantitative screens focusing on macro- and company-specific factors including cash flow, earnings revisions and valuation. Country allocation is conducted each month using the output of a proprietary quantitative model and the manager’s qualitative views. Potential portfolio holdings are researched internally and models constructed with a standard format to eliminate where possible the differences in accounting regimes and to allow comparisons between companies in the same industry or region. Stocks are given a ranking based on their perceived quality, their valuation and the analyst’s level of conviction. The manager focuses on companies with visible earnings growth, sustainable returns and valuation support. They are ranked based on his view of upside/downside potential and his level of conviction. Weightings within the portfolio reflect these considerations and the primary objective is to create a portfolio with an appropriate level of stock-specific risk. There is also a proprietary risk management system, which provides a quantitative view of the characteristics of the portfolio. Investment restrictions are in place to ensure adequate diversification and spread of investment risk (see Fund profile section).
Current portfolio positioning
At the end of February 2016, SDP’s portfolio comprised 80 stocks compared with a range of 70 to 90 and a peer group average of c 70. The top 10 holdings accounted for 39.6% versus 33.7% at the end of February 2015. Eight of the top 10 positions were held at the end of both years. The portfolio has a high active share of 72.6%, with 22.7% of the portfolio in non-index stocks (as at the end of February 2016).
Exhibit 3: Top 10 active over/underweights at 29 February 2016
Overweight |
Active vs index (% pts) |
Underweight |
Active vs index (% pts) |
|
Jardine Strategic |
4.8 |
China Construction Bank |
(1.8) |
|
Fortune Real Estate |
4.1 |
ICBC |
(1.3) |
|
TSMC |
3.5 |
CK Hutchison |
(1.2) |
|
China Pacific Insurance |
3.2 |
Bank of China |
(1.1) |
|
Apollo Hospitals |
1.9 |
Infosys |
(1.1) |
|
Gujarat Pipavav Port |
1.8 |
Hong Kong Exchanges |
(0.9) |
|
Techtronic Industries |
1.8 |
Housing Development Finance |
(0.8) |
|
Hongkong Land |
1.6 |
Ping An Insurance |
(0.8) |
|
HKT Trust |
1.6 |
Sun Hung Kai Properties |
(0.7) |
|
Ayala Land |
1.6 |
Reliance Industries |
(0.7) |
Source: Schroder AsiaPacific Fund. Note: Index is MSCI AC Asia ex-Japan.
The top 10 overweight and underweight positions are shown in Exhibit 3. Looking at the top overweight positions, there is diversification by industry and geography. The manager has been cautious on both Chinese banks and insurance companies, as shown by the largest underweight positions, where four of the top 10 are in these industries. However, as evidence of the stock-specific, active nature of the SDP portfolio, the fourth overweight position is a Chinese insurance company with positive fundamentals in a sector with reasonable secular growth.
Geographically, the fund is heavily weighted to Hong Kong/China (50.4% at the end of February) with a 9.7% overweight. This is comprised of an overweight position in Hong Kong and an underweight position in China. The underweight position in China has been reduced with market weakness but, as the top underweights list shows, there are still significant stocks that Dobbs wishes to avoid. He sees many companies in Hong Kong as attractively valued; balance sheets have strengthened, dividend yields are attractive and managements are acting in the interests of shareholders. The overweight position in India (12.2% of the portfolio, overweight by 2.9%) has been reduced as a result of profit taking. Korea is the largest underweight position (-7.6%).
Exhibit 4: Sector allocations 29 February 2016 (%)
Portfolio end February 2016 |
MSCI AC Asia ex-Japan index weight |
Active weight vs index weight (% points) |
Trust weight/index weight (x) |
|
Consumer discretionary |
15.2 |
8.6 |
6.6 |
1.8 |
Telecom services |
11.5 |
6.6 |
4.9 |
1.7 |
Industrials |
13.4 |
9.1 |
4.3 |
1.5 |
Healthcare |
5.6 |
2.7 |
2.9 |
2.1 |
Information technology |
25.2 |
23.7 |
1.5 |
1.1 |
Materials |
4.2 |
4.5 |
(0.3) |
0.9 |
Financials |
28.8 |
30.5 |
(1.7) |
0.9 |
Energy |
1.4 |
4.2 |
(2.8) |
0.3 |
Utilities |
0.0 |
4.3 |
(4.3) |
N/A |
Consumer staples |
0.2 |
5.8 |
(5.6) |
0.0 |
Cash |
-5.5 |
0.0 |
(5.5) |
N/A |
100.0 |
100.0 |
0.0 |
Source: Schroder AsiaPacific Fund, Edison Investment Research
On a sector allocation basis, in line with our report dated 29 April 2015, the portfolio remains overweight consumer discretionary focusing on good-quality growth companies. The largest underweight sector is consumer staples, reflecting high valuations in this area and structural headwinds.
Performance: Good record over a multi-year period
SDP has generated strong relative performance in share price and NAV terms over both short- and long-term periods, as shown in Exhibit 6. There have been periods of underperformance, most recently in April 2015, when China A shares and second-line stocks rallied sharply. SDP stuck to its strategy, the rally was short lived and the trust has continued to outperform (Exhibit 7).
The manager indicates that 60–70% of the net outperformance of 3.8% of the SDP NAV versus the MSCI AC Asia ex-Japan Index in 2015 was as a result of stock selection, especially in China. The focus has been on quality companies exhibiting real growth. There was also positive performance from stock selection in Taiwan, India and Korea.
On a geographic allocation basis, overweight positions in Hong Kong and India added to performance, as did zero exposure to Malaysia and an underweight position in Singapore.
Performance was negatively affected by exposure to Thailand, both in terms of an overweight position and from stock selection. An underweight position in Korea was a modest detraction from performance, but was more than made up for by positive stock selection.
|
Exhibit 5: Investment trust performance to 29 February 2016 |
|||||||||
Price, NAV and benchmark total return performance, one-year rebased |
Price, NAV and benchmark total return performance (%) |
||||||||
|
|
||||||||
|
Source: Thomson Datastream, Edison Investment Research. Note: Three-, five- and 10-year performance figures annualised. |
|||||||||
|
Exhibit 6: Share price and NAV total return performance, versus indices (percentage points) |
|||||||||
|
One month |
Three months |
Six months |
One year |
Three years |
Five years |
10 years |
||
Price relative to benchmark |
3.7 |
1.3 |
1.4 |
1.6 |
3.6 |
18.9 |
22.8 |
||
NAV relative to benchmark |
0.8 |
2.6 |
2.9 |
4.1 |
3.8 |
19.7 |
25.0 |
||
Price relative to MSCI World TR £ |
3.5 |
0.6 |
(0.2) |
(9.1) |
(21.6) |
(10.7) |
30.7 |
||
NAV relative to MSCI World TR £ |
0.6 |
1.9 |
1.3 |
(6.9) |
(21.4) |
(10.1) |
33.1 |
||
Price relative to FTSE All-Share TR £ |
3.7 |
3.3 |
5.7 |
(3.2) |
(9.9) |
3.2 |
48.2 |
||
NAV relative to FTSE All-Share TR £ |
0.8 |
4.6 |
7.3 |
(0.9) |
(9.8) |
3.9 |
51.0 |
||
|
Source: Thomson Datastream, Edison Investment Research. Note: Data to end February 2016. Geometric calculation. |
|||||||||
|
Exhibit 7: NAV performance relative to benchmark over 10 years |
|||||||||
|
|||||||||
|
Source: Thomson Datastream, Edison Investment Research |
|||||||||
Discount: Modestly wider than peers
The trust has the authority to buy back up to 14.99% of its shares to manage the discount to NAV. The board is proactive with regard to discount management, having an informal discount control policy to maintain the long-term cum-income discount below 10%, but does not wish to interfere with the natural liquidity in the shares. The last buyback was on 11 December 2015 (152,000 shares at 262.32p).
At 17 March 2016, SDP’s cum-income discount to NAV stood at 11.0%. This is wider than the average over one, three, five and 10 years (range of 7.5% to 10.5%) and modestly wider than the peer group average (see Exhibit 9).
|
Exhibit 8: Discount over three years (to cum-income NAV) |
|
|
Source: Thomson Datastream, Edison Investment Research |
Capital structure and fees
SDP is a conventional investment trust with one class of share. There are currently 169.1m shares in issue and no shares are held in treasury. The trust has an indefinite life subject to a five-year continuation vote, with the next due at the 2021 AGM. During FY15, borrowings were restructured to lower costs. The US$75m revolving credit facility was replaced with a £30m revolving credit facility, of which £29.7m has been drawn down, and a £30 million overdraft. The current level of net gearing of 5.8% is well below the maximum allowed limit of 20%.
Schroders Investment Management receives a tiered management fee starting at 0.95% pa on the first £100m of assets, 0.90% pa on the next £200m, 0.85% pa on the next £100m and 0.80% on assets in excess of £400m. Ongoing charges were 1.03% in FY15, down from 1.08% in FY14. There is no performance fee.
Dividend policy
SDP is focused on capital growth rather than yield; it does not have a yield target or a progressive dividend policy. A dividend has been paid in 18 out of 20 possible years; the exceptions were 2000 and 2001. The dividend was maintained or increased between FY07 and FY13. It declined by 18% in FY14 due to a lower revenue return, which was partly as a result of increased exposure to India, where yields tend to be lower. The FY15 dividend of 4.20p (99% payout) was 53% higher than in FY14, on a 51% higher revenue return, although part of the increase was due to factors that may not be repeated, including currency movements and a modest rise in the gearing. This equates to a current dividend yield of 1.6%.
Peer group comparison
There are 15 trusts in the AIC Asia Pacific ex-Japan sector. The five peers most directly comparable to SDP are highlighted in Exhibit 9. SDP is the second largest trust in the group. It has outperformed the weighted peer group average over one, three and five years. Risk-adjusted returns, as measured by the Sharpe ratio, have smaller negative values than the average over both one and three years. The discount is currently wider than the peer average and the net gearing is modestly lower.
Exhibit 9: Asia Pacific ex-Japan investment trusts (performance at 29 February)
% unless stated |
Market cap £m |
NAV TR 1 year |
NAV TR 3 year |
NAV TR 5 year |
NAV TR 10 year |
Sharpe 1y (NAV) |
Sharpe 3y (NAV) |
Discount (ex-par) |
Ongoing charge |
Perf. |
Net gearing |
Dividend yield (%) |
Schroder AsiaPacific |
449.7 |
(8.1) |
0.0 |
33.2 |
143.3 |
(1.3) |
(0.2) |
(11.0) |
1.1 |
No |
103.0 |
2.6 |
Aberdeen Asian Income |
308.5 |
(12.2) |
(13.7) |
33.6 |
148.0 |
(1.8) |
(0.8) |
(8.6) |
1.3 |
No |
111.0 |
5.3 |
Aberdeen Asian Smaller |
279.2 |
(9.5) |
(8.0) |
54.8 |
246.6 |
(2.1) |
(0.6) |
(14.8) |
1.5 |
No |
113.0 |
2.0 |
Aberdeen New Dawn |
183.0 |
(19.2) |
(18.4) |
3.0 |
96.7 |
(2.1) |
(0.8) |
(12.4) |
1.1 |
No |
112.0 |
2.5 |
Asian Total Return Inv Company |
148.8 |
(1.7) |
3.9 |
17.8 |
110.8 |
(1.1) |
(0.1) |
(6.8) |
1.1 |
Yes |
104.0 |
1.6 |
Edinburgh Dragon |
468.3 |
(16.1) |
(15.0) |
10.0 |
113.0 |
(1.9) |
(0.7) |
(12.5) |
1.2 |
No |
110.0 |
1.2 |
Fidelity Asian Values |
167.4 |
(1.5) |
19.6 |
33.9 |
160.4 |
(0.9) |
0.3 |
(13.6) |
1.4 |
No |
99.0 |
0.8 |
Henderson Far East Income |
323.4 |
(8.0) |
(5.2) |
25.3 |
108.7 |
(1.3) |
(0.4) |
(3.6) |
1.1 |
No |
103.0 |
6.8 |
Invesco Asia |
157.4 |
(9.2) |
6.0 |
26.4 |
133.2 |
(1.3) |
(0.0) |
(9.9) |
1.1 |
No |
102.0 |
2.0 |
JPMorgan Asian |
200.8 |
(13.0) |
(4.7) |
2.2 |
66.7 |
(1.4) |
(0.3) |
(12.8) |
0.9 |
No |
106.0 |
1.0 |
Martin Currie Asia Unconstrained |
99.2 |
(11.3) |
(9.3) |
4.8 |
45.4 |
(1.6) |
(0.5) |
(14.8) |
1.2 |
No |
103.0 |
2.8 |
Pacific Assets |
229.3 |
(5.4) |
19.5 |
58.5 |
132.8 |
(1.5) |
0.4 |
(1.7) |
1.3 |
No |
100.0 |
1.3 |
Pacific Horizon |
100.7 |
(13.9) |
(4.7) |
10.0 |
98.3 |
(1.4) |
(0.3) |
(12.9) |
1.0 |
No |
99.0 |
0.2 |
Schroder Oriental Income |
437.9 |
(4.4) |
5.3 |
52.5 |
176.2 |
(1.1) |
(0.1) |
(2.4) |
0.9 |
Yes |
114.0 |
4.3 |
Scottish Oriental Smaller Cos |
235.5 |
(7.4) |
0.2 |
52.7 |
270.0 |
(1.5) |
(0.3) |
(13.0) |
1.0 |
Yes |
95.0 |
1.5 |
Sector weighted average |
(9.4) |
(2.4) |
30.9 |
144.6 |
(1.5) |
(0.3) |
(9.4) |
1.1 |
2.2 |
106.2 |
2.7 |
|
SDP rank in sector |
2 |
7 |
7 |
7 |
6 |
6 |
6 |
7 |
7 |
8 |
5 |
Source: Morningstar, Edison Investment Research. Note: TR = NAV total return. The Sharpe ratio is a measure of risk-adjusted return. The ratios shown are calculated by Morningstar for the past 12- and 36-month periods by dividing a fund’s annualised excess returns over the risk-free rate by its annualised standard deviation. Net gearing is total assets less cash and equivalents as a percentage of net assets. Non-performance data at 17 March 2016.
The board
There are currently five members of the board, all non-executive and independent of the manager. Having been chairman since the fund launch in 1995, the Honourable Rupert Carington (chairman) retired at the January 2016 AGM. He is succeeded by Nicholas Smith, who was appointed to the board in 2010. The other members are Anthony Fenn (appointed in 2005), Rosemary Morgan (appointed in 2012), James Williams (appointed in 2014) and Keith Craig (appointed in 2015). All of the board members have lived and worked in Asia.
|