Last close As at 05/08/2026
—
— 0.00 (0.00%)
Market capitalisation
—
Research: Investment Companies
Schroder AsiaPacific Fund (SDP) invests in markets across the Asia Pacific region (excluding Japan) with the aim of achieving capital growth. Managed by Matthew Dobbs since launch in 1995, the trust is the largest and among the most liquid in its peer group. It has produced top-quartile NAV total returns over one, three and five years, also beating its benchmark MSCI AC Asia ex-Japan index over one, three, five and 10 years in both NAV and share price terms. In spite of this, it trades at a wider discount than the peer group average. The manager focuses on companies with visible earnings growth, strong management, sustainable cash flows and valuation support. While sector and geographical weightings are an output of stock selection, there is a significant allocation towards Greater China and the information technology sector. Reflecting the growing level of dividends from Asian companies, SDP has a yield of just over 1%.
Written by
Schroder AsiaPacific Fund |
Strong returns from established Asia specialist |
Investment trusts |
11 August 2017 |
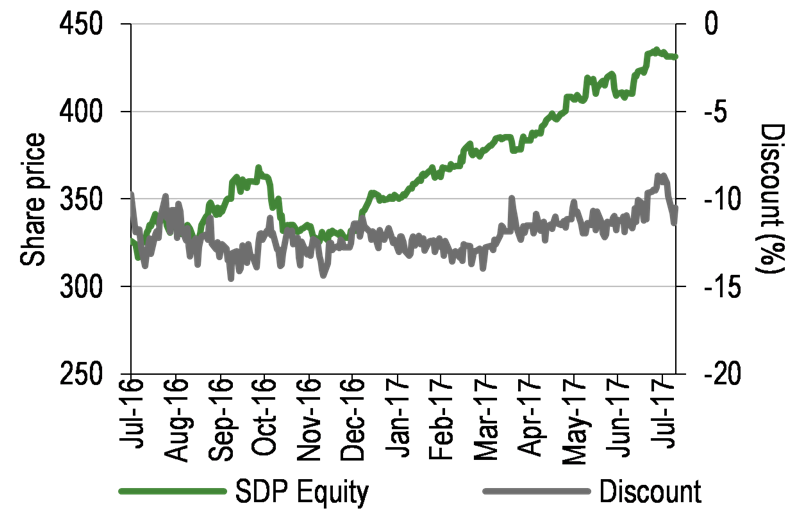
Share price/discount performance
Three-year performance graph
Gearing
Analysts
|
|||||||||||||||||||||||||||||||||||||||||||||||||||||||||||||||||||||||||||||||||||||||||||||
Schroder AsiaPacific Fund (SDP) invests in markets across the Asia Pacific region (excluding Japan) with the aim of achieving capital growth. Managed by Matthew Dobbs since launch in 1995, the trust is the largest and among the most liquid in its peer group. It has produced top-quartile NAV total returns over one, three and five years, also beating its benchmark MSCI AC Asia ex-Japan index over one, three, five and 10 years in both NAV and share price terms. In spite of this, it trades at a wider discount than the peer group average. The manager focuses on companies with visible earnings growth, strong management, sustainable cash flows and valuation support. While sector and geographical weightings are an output of stock selection, there is a significant allocation towards Greater China and the information technology sector. Reflecting the growing level of dividends from Asian companies, SDP has a yield of just over 1%.
12 months ending |
Share price |
NAV |
MSCI AC Asia ex-Japan (%) |
MSCI World |
FTSE All-Share (%) |
31/07/13 |
12.9 |
12.4 |
11.7 |
27.4 |
24.3 |
31/07/14 |
4.5 |
3.9 |
6.5 |
4.1 |
5.6 |
31/07/15 |
4.7 |
6.1 |
1.4 |
13.5 |
5.4 |
31/07/16 |
22.2 |
20.5 |
15.8 |
17.0 |
3.8 |
31/07/17 |
34.7 |
33.3 |
28.2 |
16.9 |
14.9 |
Source: Thomson Datastream. Note: All % on a total return basis in GBP.
Investment strategy: Four-step bottom-up process
As well as travelling frequently to the region to meet companies, SDP’s manager can draw on the extensive Asia-based analyst team at Schroders to help generate ideas for the portfolio. The investment process is based on four characteristics: knowledge (idea generation and company meetings), insight (fundamental and valuation analysis), discipline (constructing a portfolio of 70-90 stocks) and conviction (monitoring to ensure all holdings still deserve their position).
Market outlook: Asia cheaper, but not cheap
Global equity markets have performed strongly over the past year, particularly for UK-based investors who have benefited from sterling weakness. Asian markets are no exception but, although they remain at a valuation discount to the global index, forward P/E ratios are above the 10-year average, suggesting that investors could benefit from taking a more selective and valuation-aware approach to the region.
Valuation: Discount broadly average
At 9 August 2017, SDP’s shares traded at a 10.5% discount to cum-income NAV. This was wider than the 12-month low of 8.7% seen in late July, as the share price lagged a rising NAV, narrower than the one-year average of 12.0% and broadly in line with three- and five-year averages. The board may buy back shares when the discount exceeds 10%, but prefers not to interfere with the natural liquidity of the shares. Although SDP is focused on capital growth, the portfolio does generate some income, substantially all of which is paid out as dividends. Based on the current share price, SDP yields 1.1%.
Exhibit 1: Trust at a glance
Investment objective and fund background |
Recent developments |
||||||||||||||||||||||||||||||||||||||||||||||||||||||||||||||||||||||||||||
Schroder AsiaPacific Fund aims to achieve capital growth through investment primarily in the equity of companies located in the continent of Asia (excluding the Middle East and Japan), together with the Far Eastern countries bordering the Pacific Ocean, with the aim of achieving growth in excess of the MSCI All Countries Asia ex-Japan index in sterling terms over the longer term. Until 30 January 2011, the benchmark was the MSCI All Countries Far East ex-Japan index, but it was changed to an index that included India to reflect the growing importance of the Indian stock market. |
■ 22 June 2017: Half-year report for the six months ended 31 March. NAV TR +11.8% and share price TR +11.8% versus +10.4% for the benchmark MSCI AC Asia ex-Japan index (all in sterling). Management fee cut from 0.80-0.95% to 0.75-0.90%, effective from 1 April 2017. ■ 6 March 2017: SDP chairman Nicholas Smith appointed as a non-executive director of Polarcus. |
||||||||||||||||||||||||||||||||||||||||||||||||||||||||||||||||||||||||||||
Forthcoming |
Capital structure |
Fund details |
|||||||||||||||||||||||||||||||||||||||||||||||||||||||||||||||||||||||||||
AGM |
January 2018 |
Ongoing charges |
1.1% |
Group |
Schroder Unit Trusts Ltd |
||||||||||||||||||||||||||||||||||||||||||||||||||||||||||||||||||||||||
Annual results |
December 2017 |
Net gearing |
4.9% |
Manager |
Matthew Dobbs |
||||||||||||||||||||||||||||||||||||||||||||||||||||||||||||||||||||||||
Year end |
30 September |
Annual mgmt fee |
Tiered 0.75-0.90% (see page 7) |
Address |
31 Gresham Street, |
||||||||||||||||||||||||||||||||||||||||||||||||||||||||||||||||||||||||
Dividend paid |
February |
Performance fee |
None |
||||||||||||||||||||||||||||||||||||||||||||||||||||||||||||||||||||||||||
Launch date |
November 1995 |
Trust life |
Indefinite |
Phone |
020 7658 3206 |
||||||||||||||||||||||||||||||||||||||||||||||||||||||||||||||||||||||||
Continuation vote |
Five-yearly, next in 2021 |
Loan facilities |
£50m revolving, £30m overdraft |
Website |
|||||||||||||||||||||||||||||||||||||||||||||||||||||||||||||||||||||||||
Dividend policy and history (financial years) |
Share buyback policy and history (financial years) |
||||||||||||||||||||||||||||||||||||||||||||||||||||||||||||||||||||||||||||
Dividends paid annually in February. While the trust is focused on capital growth, a dividend has been paid in 19 of the last 21 years. |
SDP targets a discount below c 10%. Issuance in the chart below includes exercise of subscription shares. |
||||||||||||||||||||||||||||||||||||||||||||||||||||||||||||||||||||||||||||
|
|
||||||||||||||||||||||||||||||||||||||||||||||||||||||||||||||||||||||||||||
Shareholder base (as at 4 July 2017) |
Portfolio exposure by geography (adjusted for gearing, as at 30 June 2017) |
||||||||||||||||||||||||||||||||||||||||||||||||||||||||||||||||||||||||||||
|
|
||||||||||||||||||||||||||||||||||||||||||||||||||||||||||||||||||||||||||||
Top 10 holdings (as at 30 June 2017) |
|||||||||||||||||||||||||||||||||||||||||||||||||||||||||||||||||||||||||||||
|
|||||||||||||||||||||||||||||||||||||||||||||||||||||||||||||||||||||||||||||
Source: Schroder AsiaPacific Fund, Edison Investment Research, Bloomberg, Morningstar. Note: *N/A where not in June 2016 top 10.
Market outlook: Selective approach may be advisable
As shown in Exhibit 2 below (left-hand chart), Asian equities have kept pace with the heavily US-dominated MSCI World index over the past 10 years, initially outperforming following the global financial crisis and recovering from the sharp falls seen in the period of heightened risk-aversion from mid-2015 to early 2016. Returns since mid-2016 have been boosted for UK investors by the weakness of sterling.
The right-hand chart shows average forward P/E valuations for the Datastream Asia ex-Japan, both in absolute terms and relative to the Datastream World index, over the same period. Asia ex-Japan valuations remain at a significant discount of c 15% to the average for the world index. However, this may indicate that Asian markets are simply less expensive than other markets, rather than being empirically cheap. Having risen modestly over the past year, the average forward P/E of 13.3x for the Asia ex-Japan index is 9% above the 10-year average, while the World index P/E of 15.7x is 20% above the 10-year average. While valuations have been supported by earnings growth in recent months, the risks at an aggregate level are arguably to the downside. In particular, the trend towards monetary policy normalisation could dent demand for equities, as returns on lower-risk assets begin to look more attractive. Against such a backdrop, investors may prefer a fund with a valuation-aware investment approach that focuses on not overpaying for growth.
|
Exhibit 2: Market performance and valuation |
|
Asia ex-Japan versus world and UK equities (TR, in sterling) |
Forward P/E for DS Asia ex Japan and relative to DS World |
|
|
|
Source: Thomson Datastream, Edison Investment Research |
|
Fund profile: Long-established Asia specialist
Schroder AsiaPacific Fund (SDP) has been managed since its launch in 1995 by Matthew Dobbs, a specialist Asia fund manager with Schroders for more than 30 years. The investment trust is managed for capital growth, with a broad investment remit covering Asia (excluding Japan) and the Far Eastern countries bordering the Pacific. It holds a relatively concentrated portfolio, diversified by country, industry and size, chosen on a bottom-up basis with input from Schroders’ large team of analysts based in the region. The investment process targets companies with visible earnings growth, good corporate governance and sustainable returns, trading at attractive valuations. Stock selection is unconstrained versus the MSCI AC Asia ex-Japan benchmark index, although no more than 15% of the portfolio may be invested in any one company, and SDP may not own more than 20% of the equity of any company. The manager is permitted to invest up to 5% of the portfolio in unlisted securities, and may use derivatives for efficient portfolio management. Gearing is permitted up to 20% of net assets (net gearing of 4.9% at end-June).
The fund manager: Matthew Dobbs
The manager’s view: Still value to be found in Asia
Dobbs argues that while stock valuations in Asia are no longer as compelling as they were during the correction seen in mid-2015, there is still value to be found in the region. Meanwhile, company earnings have been strong, with upward estimate revisions in 2016 and the first half of 2017. Economic indicators such as purchasing managers’ indices show a reasonably constructive outlook, although Dobbs says that this is largely reflected in the stock market. Against this backdrop, after a strong recovery in cyclical stocks in 2016, the manager has taken some profits, commenting that his approach is not to seek “growth at any price”.
From a macro perspective, Dobbs says India is still “the lion that hasn’t roared”, with limited progress made on Prime Minister Modi’s much-vaunted reform agenda and mixed views among market participants on the success of 2016’s demonetisation programme. While India is at an earlier stage of development than China in terms of credit growth, which could provide longer-term economic support, Dobbs says that he has taken profits as the stock market has become more expensive, although any correction could prompt a reassessment. Indonesia – like India, a beneficiary of a political ‘new broom’ in 2014 – looks interesting in the long term, the manager says, although the market has not reached a valuation level where he would be comfortable making a significant allocation.
Dobbs points out that paying dividends has become increasingly important to Asian companies. He says growth of cash flow is interesting, driven by businesses being disciplined in their capital expenditure. While SDP invests for capital growth, the manager favours companies with sufficient cash flows to support a dividend.
Asset allocation
Investment process: Disciplined, bottom-up approach
Fund manager Matthew Dobbs and alternate manager Richard Sennitt are based in London, but travel frequently to Asia to meet company managements face-to-face, and are in regular contact with a 36-strong analyst team spread across seven regional offices from Mumbai to Sydney. Between them the managers have been investing in Asia for more than half a century, and the analysts have an average of 15 years’ experience.
SDP’s investment process is based on four key characteristics: knowledge, insight, discipline and conviction.
■
Knowledge: investment ideas may be drawn from the managers’ own extensive experience, the analyst team in the region, global sector specialists in Schroders’ London office, sell-side research or the output of quantitative screens.
■
Insight: rigorous long-term fundamental analysis is undertaken on candidate stocks. The analysts build models forecasting the development of the balance sheet and cash flows over as long a period as possible, as well as assessing quality of management, corporate governance and sustainability. There is a focus on identifying positive long-term change rather than short-term catalysts. Each company is assigned a fair value target, and a rating based on the analyst’s level of conviction that the stock will outperform or underperform the market.
■
Discipline: portfolio construction is concentrated (70-90 stocks), valuation-driven, unconstrained by country or sector weights in the index, and risk-aware.
■
Conviction: only the team’s ‘best ideas’ are included in the portfolio. Ongoing analysis ensures that the investment case for all stocks held remains sound, and valuation versus fair value targets is constantly monitored. Stocks are generally sold when they reach their valuation target, with the manager rotating into better-value opportunities. Although targets are set on a three-year view, it is not uncommon for a stock to reach the estimated fair value sooner than this.
Portfolio turnover has fallen in recent years, from 66% in FY12 to an average of 39.2% in the three years to FY16, implying a holding period of just over three years.
Current portfolio positioning
At 30 June 2017, SDP had 74 holdings, a slight decrease on 78 a year earlier and modestly higher than the 66-stock average for the peer group. The top 10 holdings made up 39.1% of the portfolio. Greater China (China, Hong Kong and Taiwan) is the dominant geographical weight at 58.8% of the portfolio (see Exhibit 1), although within this, Hong Kong is the only overweight position versus the MSCI AC Asia ex-Japan benchmark. SDP’s manager stresses that portfolio construction is bottom-up and that geographical and sector weights are an output of stock selection. However, macro factors do have a bearing on industry-level fundamentals, which in turn affect the operating environment for individual companies. Against a broadly positive economic backdrop, Dobbs comments that the portfolio is positioned quite pro-cyclically, with overweight positions in sectors such as information technology and consumer discretionary, and underweights in defensive areas like consumer staples and utilities (Exhibit 4). The underweight to financials has been reduced (to 6.5pp at 31 March versus 12.1pp at 31 October 2016), as a result of selective investments in inexpensively valued banks, funded mainly by an increase in gearing.
Exhibit 3: Top 10 active over/underweights at 31 March 2017
Overweight |
Active vs index (% pts) |
Underweight |
Active vs index (% pts) |
|
Jardine Strategic |
2.4 |
China Construction Bank |
(1.8) |
|
Taiwan Semiconductor Mfr |
2.1 |
China Mobile |
(1.8) |
|
China Pacific Insurance |
2.1 |
Bank of China |
(1.0) |
|
Fortune Real Estate |
1.9 |
Housing Development Finance |
(0.9) |
|
Hyundai Motor |
1.8 |
CK Hutchison |
(0.9) |
|
Alibaba Group |
1.8 |
HK Exchanges & Clearing |
(0.8) |
|
Swire Properties |
1.7 |
Ping An Insurance |
(0.8) |
|
Kerry Properties |
1.7 |
Infosys |
(0.8) |
|
Gujarat Pipavav Port |
1.7 |
Baidu |
(0.8) |
|
LG Chem |
1.7 |
Reliance Industries |
(0.7) |
Source: Schroder AsiaPacific Fund, Edison Investment Research
The high weighting to information technology in both absolute and relative terms is informed by investment themes relating to disruption and new business models in the region. Dobbs points out lower landline penetration in the region, for example, has led to Asian consumers embracing mobile phones much more readily than those in the West, which in turn feeds into more open attitudes to tech-enabled business areas such as e-commerce, which is disrupting traditional retail business models.
Exhibit 4: Sector allocations 31 March 2017 (%, unless shown)
Portfolio end-March 2017 |
MSCI AC Asia ex-Japan index weight |
Active weight vs index (% pts) |
Trust weight/index weight (x) |
|
Information technology |
37.4 |
28.4 |
9.0 |
1.3 |
Financials |
17.1 |
23.6 |
(6.5) |
0.7 |
Consumer discretionary |
12.5 |
9.6 |
2.9 |
1.3 |
Real estate |
8.8 |
5.9 |
2.9 |
1.5 |
Industrials |
8.7 |
8.0 |
0.7 |
1.1 |
Telecommunications |
6.6 |
5.2 |
1.4 |
1.3 |
Materials |
6.3 |
4.7 |
1.6 |
1.3 |
Energy |
3.4 |
4.4 |
(1.0) |
0.8 |
Healthcare |
2.6 |
2.2 |
0.4 |
1.2 |
Consumer staples |
0.7 |
4.6 |
(3.9) |
0.2 |
Utilities |
0.0 |
3.4 |
(3.4) |
0.0 |
Cash |
(4.0) |
0.0 |
(4.0) |
N/A |
100.0 |
100.0 |
0.0 |
Source: Schroder AsiaPacific Fund, Edison Investment Research.
Performance: Outperforming over short and long term
|
Exhibit 5: Investment trust performance to 31 July 2017 |
|
Price, NAV and benchmark total return performance, one-year rebased |
Price, NAV and benchmark total return performance (%) |
|
|
|
Source: Thomson Datastream, Edison Investment Research. Note: Three, five and 10-year performance figures annualised. |
|
As shown in Exhibit 5 (left-hand chart), SDP has opened up a clear performance lead over the MSCI AC Asia ex-Japan index so far in 2017. This feeds through into NAV and share price total return outperformance of the index over almost all the periods shown in the right-hand chart. Performance has also been positive versus the UK domestic market and the universe of developed markets globally over almost all periods (Exhibit 6). SDP’s manager says stock selection, rather than country allocation, has been the biggest contributor to the recent outperformance, with a reasonably even spread of strongly performing companies across Hong Kong, Korea, India and China, and to a lesser extent Taiwan and Thailand. Dobbs comments that this has been achieved amid a value/cyclical recovery without having to compromise on SDP’s principal focus on quality growth companies with good management and strong cash flows. As shown in Exhibit 7, NAV outperformance of the benchmark has followed a reasonably steady path over the past five years, with periods of noticeable underperformance having been both isolated and short-lived.
|
Exhibit 6: Share price and NAV total return performance, relative to indices (%) |
||||||||
|
One month |
Three months |
Six months |
One year |
Three years |
Five years |
10 years |
|
Price relative to MSCI AC Asia ex-Japan |
1.7 |
3.0 |
6.0 |
5.0 |
14.5 |
13.6 |
30.2 |
|
NAV relative to MSCI AC Asia ex-Japan |
(1.0) |
(0.4) |
1.6 |
4.0 |
13.2 |
11.2 |
24.1 |
|
Price relative to MSCI World |
4.6 |
9.6 |
16.8 |
15.1 |
11.0 |
(1.2) |
24.9 |
|
NAV relative to MSCI World |
1.9 |
6.0 |
11.9 |
14.0 |
9.7 |
(3.4) |
19.0 |
|
Price relative to FTSE All-Share |
4.3 |
9.6 |
15.1 |
17.2 |
37.1 |
23.3 |
68.7 |
|
NAV relative to FTSE All-Share |
1.6 |
6.0 |
10.3 |
16.0 |
35.6 |
20.6 |
60.8 |
|
|
Source: Thomson Datastream, Edison Investment Research. Note: Data to end-July 2017. Geometric calculation. |
||||||||
|
Exhibit 7: NAV TR performance relative to MSCI AC Asia ex-Japan over five years (%) |
||||||||
|
||||||||
|
Source: Thomson Datastream, Edison Investment Research |
||||||||
Discount: Broadly stable but wider than peers
SDP’s discount has been broadly stable in a range of 10-14% over the past two years, narrowing to a 12-month low of 8.7% at 28 July 2017 before widening again to 10.5% on 9 August. The trust may buy back shares if the discount exceeds 10%, although use of this power has been relatively limited. SDP’s discount is above the average of its peer group in spite of its improved performance record, holding out the possibility of further narrowing if the recent improvement is maintained.
|
Exhibit 8: Share price premium/discount to NAV (including income) over three years (%) |
|
|
Source: Thomson Datastream, Edison Investment Research |
Capital structure and fees
Structured as a conventional investment trust, SDP has one class of share, with 167.6m ordinary shares in issue at 9 August 2017. Up to 14.99% may be repurchased each year to manage a discount, and in the past 12 months, 290,000 shares have been bought back at a cost of £1.0m. A continuation vote is scheduled to take place every five years, with the next due at the 2021 AGM. Borrowing is available through a £50m multi-currency revolving credit facility and a £30m overdraft, with £53.2m drawn at end-H117 versus £22.9m at the 30 September 2016 year-end. This represents 7.0% of net assets at 31 July 2017, compared with a maximum permitted gearing level of 20%.
SDP has recently adjusted its fee structure. Previously, Schroder Investment Management received a tiered annual management fee starting at 0.95% on the first £100m of assets, then 0.90% on the next £200m, 0.85% on the next £100m and 0.80% on assets above £400m. With effect from 1 April 2017, the fee on the first £300m of assets will be 0.90%, falling to 0.80% between £300m and £600m and 0.75% above £600m. This should have the effect of reducing ongoing charges from the current level of 1.1%, although as the change is effective from the halfway point of the current financial year, its full impact will not be seen until FY18. There is no performance fee.
Dividend policy and record
SDP invests for capital growth rather than income, and has no specific commitments to pay a dividend. This gives it the flexibility to invest in faster-growing, smaller companies that may have lower payout ratios than more mature companies. Dividends have, however, been paid in 19 out of 21 years and have tended to be at a level largely commensurate with net income. SDP’s dividend has grown at a compound annual rate of 11.6% over the last five years and the trust has a dividend yield of 1.1% based on the 9 August share price. For H117, net revenue per share was 0.83p, more than twice the level of H116. However, given that the vast majority of revenues (75% of gross and 92% of net in FY16) arise in the second half of the year, it is arguably too early to make any predictions as to the magnitude of any potential increase in SDP’s FY17 dividend.
Peer group comparison
There are 15 trusts in the AIC Asia Pacific ex-Japan sector, including two with a focus on smaller companies and three that have a specific income remit. Exhibit 9 shows data on all 15 trusts, but we have highlighted the five that we see as most directly comparable to SDP. SDP is the largest trust in the sector and has a solid medium-term performance record, ranking third for NAV total returns over one and three years, and fourth over five years. Over 10 years it ranks sixth and is still ahead of the weighted average return. In spite of this, the discount to NAV is wider than average. Ongoing charges are average and there is no performance fee. Gearing is broadly in line with the generally low level for the peer group. SDP’s dividend yield is below the whole-sector average but is only marginally lower than the 1.3% weighted average with the three income funds excluded.
Exhibit 9: AIC Asia Pacific ex-Japan peer group as at 31 July 2017*
% unless stated |
Market cap £m |
NAV TR |
NAV TR |
NAV TR |
NAV TR 10 year |
Ongoing charge |
Perf. |
Discount (cum-fair) |
Net |
Dividend yield (%) |
Schroder Asia Pacific |
727.3 |
32.8 |
71.9 |
106.1 |
190.5 |
1.1 |
No |
(9.0) |
105 |
1.1 |
Aberdeen Asian Income |
392.0 |
17.2 |
30.9 |
52.4 |
202.2 |
1.2 |
No |
(7.1) |
106 |
4.5 |
Aberdeen Asian Smaller |
369.7 |
14.5 |
30.9 |
75.1 |
293.4 |
1.8 |
No |
(14.0) |
110 |
1.0 |
Aberdeen New Dawn |
263.8 |
26.6 |
39.3 |
62.0 |
164.1 |
1.1 |
No |
(13.2) |
109 |
1.8 |
Edinburgh Dragon |
670.3 |
21.6 |
42.8 |
62.5 |
175.0 |
1.1 |
No |
(11.6) |
107 |
0.9 |
Fidelity Asian Values |
260.5 |
17.8 |
65.3 |
122.1 |
184.3 |
1.3 |
No |
(5.8) |
99 |
1.2 |
Henderson Far East Income |
449.5 |
17.5 |
40.7 |
71.5 |
137.1 |
1.2 |
No |
2.4 |
102 |
5.4 |
Invesco Asia |
231.9 |
30.4 |
67.3 |
126.3 |
211.4 |
1.0 |
No |
(11.7) |
97 |
1.6 |
JPMorgan Asian |
321.8 |
36.9 |
73.6 |
108.5 |
108.8 |
0.8 |
No |
(7.9) |
100 |
3.8 |
Martin Currie Asia Unconstrained |
140.3 |
25.4 |
50.1 |
69.8 |
74.5 |
1.1 |
No |
(11.5) |
102 |
2.0 |
Pacific Assets |
306.6 |
12.8 |
51.0 |
98.2 |
106.2 |
1.3 |
No |
(0.8) |
100 |
1.0 |
Pacific Horizon |
155.2 |
39.0 |
58.9 |
94.6 |
107.9 |
1.1 |
No |
(7.8) |
108 |
0.1 |
Schroder Asian Total Return |
244.7 |
28.0 |
74.8 |
103.6 |
137.3 |
1.0 |
Yes |
(1.5) |
106 |
1.4 |
Schroder Oriental Income |
621.4 |
17.2 |
51.3 |
97.1 |
210.3 |
0.9 |
Yes |
1.3 |
107 |
3.5 |
Scottish Oriental Smaller Cos |
323.5 |
18.9 |
43.7 |
97.9 |
282.4 |
1.0 |
Yes |
(10.7) |
100 |
1.1 |
Weighted average |
23.0 |
52.1 |
88.3 |
181.8 |
1.1 |
(6.8) |
104 |
2.1 |
||
SDP rank in sector |
1 |
3 |
3 |
4 |
6 |
9 |
9 |
8 |
10 |
Source: Morningstar, Edison Investment Research. Note: *Performance data as at 27 July 2017. TR=total return. Net gearing is total assets less cash and equivalents as a percentage of net assets (100 = ungeared).
The board
SDP has five non-executive directors, all of whom are independent of the manager. Chairman (since January 2016) Nicholas Smith has served on the board since 2010. Anthony Fenn (who will retire at the 2018 AGM) was appointed in 2005, Rosemary Morgan in 2012, James Williams in 2014 and Keith Craig in 2015. All the directors have lived and worked in Asia.
|
|
Research: TMT
TXT reported H117 revenue growth of 8.9% y-o-y, with a small decline in Q217 revenues of 1.1%. The company has agreed to sell the TXT Retail business for €85m with completion expected by the end of October. While we continue to include TXT Retail in our forecasts until the deal completes, we provide an illustration of the TXT Group income statement taking into account the disposal.