Last close As at 05/08/2026
—
— 0.00 (0.00%)
Market capitalisation
—
Research: Investment Companies
Schroder AsiaPacific Fund
Written by
Schroder AsiaPacific Fund |
Hand-picked best ideas for long-term growth |
Investment trusts |
5 January 2017 |
Share price/discount performance
Three-year performance vs index
Gearing
Analysts
|
|||||||||||||||||||||||||||||||||||||||||||||||||||||||||||||||||||||||||||||||||||||||
Schroder AsiaPacific Fund (SDP) seeks to deliver capital growth by investing in companies in Asia, excluding Japan. The portfolio is managed by experienced manager Matthew Dobbs, whose focus is on stock selection. He is supported by a large Asia-based research team. Since the trust’s launch in 1995, Dobbs’s aim has been to build, monitor and manage a diverse portfolio of companies that exhibit visible earnings growth potential, sustainable returns and valuation support. Over most time periods, performance versus the benchmark has been positive.
12 months ending |
Total share price return (%) |
Total NAV return (%) |
MSCI AC Asia ex-Japan (%) |
MSCI World |
FTSE All-Share (%) |
31/12/12 |
21.4 |
25.2 |
17.0 |
10.7 |
12.3 |
31/12/13 |
(3.1) |
(2.0) |
1.2 |
24.3 |
20.8 |
31/12/14 |
17.1 |
16.0 |
11.3 |
11.5 |
1.2 |
31/12/15 |
(0.6) |
(0.2) |
(3.9) |
4.9 |
1.0 |
31/12/16 |
26.6 |
27.7 |
25.8 |
28.2 |
16.8 |
Source: Thomson Datastream. Note: All % on a total return basis in pounds sterling.
Investment strategy: A diverse but select portfolio
SDP offers exposure to the Asia Pacific ex-Japan region via a diversified portfolio, currently of 71 stocks, selected primarily on a bottom-up basis. The manager is not constrained by the benchmark and adopts a long-term, patient investment approach. Input to stock selection is provided on a daily basis by a 40-strong team of dedicated analysts based in seven Asian regional offices, including India.
Market outlook: Scope for upside surprise
In spite of the MSCI AC Asia ex-Japan index’s strong absolute and relative performance over the last 18 months, macroeconomic and political concerns remain, most recently with the election of Donald Trump as US president-elect, and its implications for Asian exports, adding to investor angst. That said, rising consumer income in sizeable, largely untapped markets (eg China, India, Indonesia and Vietnam), continuing dominance in large-scale precision manufacturing (eg Taiwan and Korea) and a strong, ‘sink or swim’ work ethic, alongside an 18% P/E valuation discount to the world index, may present an opportunity to investors with a long-term outlook.
Valuation: Scope for discount to narrow
The current cum-income discount of 11.5% is marginally wider than the three-, five- and 10-year averages, arguably reflecting investor funds being drawn towards more income-oriented strategies in what remains an ultra-low interest rate environment. Given the relatively attractive valuation of Asian equities and the positive long-term total return performance of the fund, we see potential for the discount to narrow, alongside continuing long-term NAV outperformance.
Exhibit 1: Trust at a glance
Investment objective and fund background |
Recent developments |
|||||||||||||||||||||||||||||||||||||||||||||||||||||||||||||||||||||||||||
Schroder AsiaPacific Fund aims to achieve capital growth through investment primarily in the equity of companies located in the continent of Asia (excluding the Middle East and Japan), together with the Far Eastern countries bordering the Pacific Ocean, with the aim of achieving growth in excess of the MSCI All Countries Asia ex-Japan index in sterling terms over the longer term. Until 30 January 2011, the benchmark was the MSCI All Countries Far East ex-Japan index, but it was changed to an index that included India to reflect the growing importance of the Indian stock market. |
■ 12 December 2016: Annual report for year to 30 September 2016. NAV TR of 40.9% vs 36.6% for the benchmark MSCI All Countries Asia ex-Japan index. Share price TR of 41.3%. ■ 12 December 2016: Final dividend of 4.75p declared, an increase of 13.1% year-on-year. ■ 8 June 2016: Half-yearly report for the six months ending 31 March 2016. NAV TR of 11.0% vs 11.4% for the benchmark. Share price TR of 12.1%. ■ 28 January 2016: Retirement of chairman Rupert Carington. |
|||||||||||||||||||||||||||||||||||||||||||||||||||||||||||||||||||||||||||
Forthcoming |
Capital structure |
Fund details |
||||||||||||||||||||||||||||||||||||||||||||||||||||||||||||||||||||||||||
AGM |
January 2017 |
Ongoing charges |
1.1% |
Group |
Schroder Unit Trusts Ltd |
|||||||||||||||||||||||||||||||||||||||||||||||||||||||||||||||||||||||
Interim results |
June 2017 |
Net gearing |
0.9% |
Manager |
Matthew Dobbs |
|||||||||||||||||||||||||||||||||||||||||||||||||||||||||||||||||||||||
Year end |
30 September |
Annual mgmt fee |
Tiered, 0.80-0.95% (page 7) |
Address |
31 Gresham Street, London EC2V 7QA |
|||||||||||||||||||||||||||||||||||||||||||||||||||||||||||||||||||||||
Dividend paid |
February |
Performance fee |
None |
|||||||||||||||||||||||||||||||||||||||||||||||||||||||||||||||||||||||||
Launch date |
November 1995 |
Trust life |
Indefinite |
Phone |
020 7658 3206 |
|||||||||||||||||||||||||||||||||||||||||||||||||||||||||||||||||||||||
Continuation vote |
Five yearly, next in 2021 |
Loan facilities |
£30m revolving, £30m overdraft |
Website |
||||||||||||||||||||||||||||||||||||||||||||||||||||||||||||||||||||||||
Dividend policy and history |
Share buyback policy and history |
|||||||||||||||||||||||||||||||||||||||||||||||||||||||||||||||||||||||||||
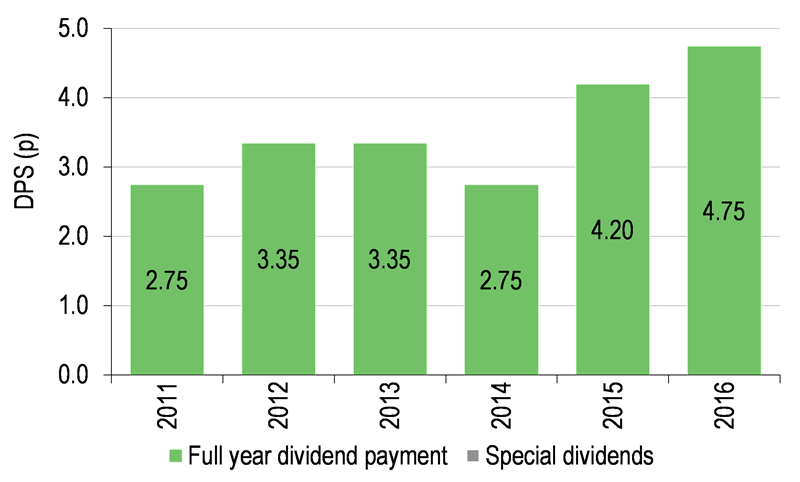
Dividend paid annually in February. While the trust is focused on capital growth, it has paid dividends in 19 of its 21 years. |
Issuance in the chart below includes exercise of subscription shares. |
|||||||||||||||||||||||||||||||||||||||||||||||||||||||||||||||||||||||||||
|
|
|||||||||||||||||||||||||||||||||||||||||||||||||||||||||||||||||||||||||||
Shareholder base (as at 31 October 2016) |
Geographical breakdown of portfolio (as at 31 October 2016) |
|||||||||||||||||||||||||||||||||||||||||||||||||||||||||||||||||||||||||||
|
|
|||||||||||||||||||||||||||||||||||||||||||||||||||||||||||||||||||||||||||
Top 10 holdings (as at 31 October 2016) |
||||||||||||||||||||||||||||||||||||||||||||||||||||||||||||||||||||||||||||
|
||||||||||||||||||||||||||||||||||||||||||||||||||||||||||||||||||||||||||||
Source: Schroder AsiaPacific Fund, Edison Investment Research, Morningstar, Thomson Reuters, Bloomberg. Note: *N/A where not in October 2015 top 10.
Market outlook: Rising discretionary spend in China
Over the last 12 months, SDP’s benchmark, the sterling-denominated MSCI AC Asia ex-Japan index, has recovered strongly on the back of less negative sentiment with regard to the Chinese economy, easy global monetary policy, as well as, perhaps most significantly for UK-based investors, the sustained weakness of sterling relative to other major currencies. Also contributing to the index’s performance has been the improving share price performances among the region’s plethora of high-tech manufacturers and automation specialists, which have benefited from rising US demand, and stronger than expected sales of smartphones. Meanwhile, Chinese foreign holiday bookings, film consumption, e-commerce and social media usage continue to rise sharply and this trend is similar across much of the rest of Asia. It suggests that while consumers elsewhere in the world may be reining in expenditure, a swathe of hitherto untapped Asian consumers is having a significant incremental impact on demand as collective levels of disposable income steadily rise – this sizeable and fast-growing market is likely to remain a key earnings driver for Asia plc for the foreseeable future. Moreover, it seems unlikely to us that President-elect Trump will want to jeopardise access to these high-growth markets by aggressively implementing protectionist policies at home in the US.
The MSCI All Countries Asia ex-Japan index comprises a rich and diverse range of companies operating in many different countries and sectors. Taking the average P/E of Asian ex Japan equities and comparing it with the average P/E of global stocks shows that the former currently stands at a 19% discount to the latter (Exhibit 2), close to the low end of the five-year range. This discount may in part reflect negative sentiment towards Asia following periods of relative underperformance over the last five years. If so, given the relative improvement in performance witnessed in 2015 and 2016 to date, there is arguably scope for that discount to narrow, should the improved performance be sustained. For investors wanting to take advantage of the depressed valuations in the region, SDP, with an active stance based on stock selection, could be appealing. Unlike a tracker fund, SDP arguably offers investors additional peace of mind, as a result of its independent board and the collective input and intellectual capital of Schroders’ 40+ strong dedicated Asian equities research team coupled with the knowledge and experience of the fund’s manager.
|
Exhibit 2: Market performance and valuation |
|
Asia ex-Japan benchmark and relative |
DS Asia ex-Japan vs DS World valuation comparison |
|
|
|
Source: Thomson Datastream, Edison Investment Research |
|
Fund profile: 21 years under Dobbs’s tenure
SDP was launched in 1995 and has been managed by Matthew Dobbs, who joined Schroders in 1981, since inception. Having been managing Asian specialist funds at Schroders for over 30 years, Dobbs is one of its most experienced fund managers. Based in the London office, he works alongside Richard Sennitt, another experienced member of the team. Dobbs is foremost a stock picker and favours companies with visible earnings growth, sustainable returns and valuation support. As a result of adopting this approach, the portfolio is a reflection of Dobbs’s best ideas and is therefore unlikely to closely resemble the benchmark index, both in terms of geographic and sector weightings. However, there are risk controls in place that dictate that no more than 15% can be invested in a single company. There is also a proprietary risk management system to provide the manager with a quantitative view of the portfolio characteristics.
The fund manager: Matthew Dobbs
The manager’s view: Trump victory leads to buying opportunity
The manager is keen to emphasise the rich diversity of sectors and countries that comprise the fund’s investment universe – ranging from economies like India, where average income per capita is a fraction of that found in the UK, to the manufacturing hubs of Taiwan and Korea where it is similar, to the trading centres of Singapore and Hong Kong, where it is significantly higher. He also underlines the fact that nearly half of the world’s population resides in the region.
Following the election of Donald Trump, Asian stock markets fell particularly sharply, with the shares of Taiwanese and Korean exporters hardest hit, reflecting fears over US protectionism. Dobbs believes these fears are overdone and sees much of the selling as having been indiscriminate. When others were arguably panic selling, Dobbs saw this as an opportunity to pick up high-quality companies on attractive valuations. That said, the manager does not view all Asian equities as cheap and continues to emphasise the need to be selective and opportunistic.
Dobbs continues to have concerns regarding the Chinese economy – its lack of transparency, its weakening foreign exchange reserve, and the over-indebtedness of state-owned enterprises (SOEs). Against this, he believes the authorities will be able to avoid a worst-case scenario. While the manager can see value in parts of the Chinese stock market, he continues to steer clear of SOEs and particularly banks. Portfolio turnover can vary and has held steady at around 30% over the last 12 months, which equates to an average holding period of around three years. Dobbs is keen to stress that low turnover is not an end in itself and that there have been and will continue to be times during which it is opportune to make sizeable changes to the portfolio to take advantage of significant one-off sector valuation anomalies, as was the case following the 2008 financial crisis.
The portfolio is overweight mid-cap companies; Dobbs says this reflects the fact that, in his view, this is where the most attractive long-term investment opportunities lie. He believes that mid- and smaller-cap companies in Asia tend to be more entrepreneurial and dynamic. By contrast, some of the mega-caps face structural headwinds and operate in mature sectors where demand is low and may be vulnerable to state interference. Moreover, global consumer, corporate and government indebtedness remain high, creating a tough environment for large companies to grow earnings in mature markets, further encouraging the manager to favour smaller companies operating in growth sectors.
Asset allocation
Investment process: Stock selection is key
Investments are spread across the region and selected as a result of carrying out research and due diligence at the company level, rather than taking a top-down approach. Ideas are generated by both the manager and the 40-strong team of in-house analysts. Much importance is placed on face-to-face meetings with management. Once all the due diligence has been carried out, Dobbs assesses the extent of the likely upside potential as well as the downside risk, before making the final investment decision.
While both the manager and the team of analysts take a long-term view when researching new investment ideas (rather than basing a stock recommendation on the short-term direction in the oil price, for example), once a stock has earned its place in the portfolio it is kept under close watch, with the manager seeking to remain both patient and vigilant, ready to reassess the position if the facts change. It may be that the expected upside at the time of initial investment is reached earlier than envisaged, prompting a reassessment and possible exit, or it may be that circumstances change such that the holding is sold to take advantage of a more compelling opportunity elsewhere.
Weightings in the portfolio reflect the manager’s conviction, which takes into account the size and liquidity of the company’s free float (number of tradable shares).
Current portfolio positioning
At the end of October 2016, SDP’s portfolio comprised 71 stocks, at the lower end of the range of 70 to 90. The top 10 holdings accounted for 40.1% of assets. The portfolio reflects the unconstrained investment remit and bottom-up bias such that 23.4% of the portfolio was in non-index stocks (as at the end of October 2016).
Exhibit 3: Top 10 active over/underweights at 31 October 2016
Overweight |
Active vs index (% pts) |
Underweight |
Active vs index (% pts) |
|
Jardine Strategic |
4.8 |
China Construction Bank |
(1.8) |
|
TSMC |
2.9 |
ICBC |
(1.3) |
|
China Pacific Insurance |
2.1 |
Bank of China |
(1.0) |
|
Fortune Real Estate |
2.0 |
CK Hutchison |
(1.0) |
|
BHP Billiton |
1.9 |
Housing Development Finance |
(0.9) |
|
AIA Group |
1.8 |
HK Exchanges & Clearing |
(0.9) |
|
Gujarat Pipavav Port |
1.8 |
Infosys |
(0.8) |
|
Kerry Properties |
1.7 |
Ping An Insurance |
(0.8) |
|
Reliance Industries |
1.6 |
China Mobile |
(0.8) |
|
PT Bank Mandiri |
1.6 |
CNOOC |
(0.7) |
Source: Schroder AsiaPacific Fund, Edison Investment Research
The top 10 overweight and underweight positions are shown in Exhibit 3. The manager has been cautious on financials, especially banks, and on Chinese banks in particular. Exemplifying the bottom-up approach is the recent selection of London-listed Australian mining company BHP Billiton – although the manager tends to avoid commodity-related sectors due to lack of margin and a highly competitive marketplace, he made an exception for this company, which he views as the lowest cost producer, meaning that it will likely prove most resilient in a sustained downturn.
Geographically, Dobbs has been finding most value in Taiwan, especially following the US elections, and has been adding to exposure there. Meanwhile, the underweight position in China has been selectively reduced and, if combined with the overweight positions in Hong Kong and Taiwan, shows an overweight exposure to the Greater China region as a whole (60.9%). The overweight position in India has continued to be reduced as valuations have strengthened. Korea is the largest underweight position (-4.1pp), reflecting in part the large number of companies vulnerable to state intervention. For similar reasons, the fund has no exposure to Malaysia, the fund’s second biggest underweight, which has been beneficial to performance over the last 12 months.
On a sector allocation basis (see Exhibit 4), the largest overweight is in technology, which constitutes primarily large blue-chip manufacturers such as Taiwan’s semiconductor producer TSMC, which is heavily integrated into the supply chain of companies like Apple. Exposure to the technology sector takes advantage of China’s rapidly growing e-commerce and entertainment industry via companies like Tencent, the country’s largest and most used internet service portal. The fund has a zero weighting in utilities, reflecting the manager’s reticence to invest in regulated entities.
Exhibit 4: Sector allocations 31 October (%, unless shown)
Portfolio end-October 2016 |
MSCI AC Asia ex-Japan index weight |
Active weight vs index (pp) |
Trust weight/index weight (x) |
|
Information technology |
34.6 |
27.7 |
6.9 |
1.2 |
Telecommunication services |
8.9 |
5.7 |
3.2 |
1.6 |
Industrials |
11.1 |
8.0 |
3.1 |
1.4 |
Consumer discretionary |
12.3 |
9.4 |
2.9 |
1.3 |
Real estate |
8.6 |
6.0 |
2.6 |
1.4 |
Materials |
5.7 |
4.3 |
1.4 |
1.3 |
Healthcare |
3.0 |
2.5 |
0.5 |
1.2 |
Energy |
4.7 |
4.2 |
0.5 |
1.1 |
Utilities |
0.0 |
3.7 |
(3.7) |
N/A |
Consumer staples |
0.6 |
5.0 |
(4.4) |
0.1 |
Financials |
11.4 |
23.5 |
(12.1) |
0.5 |
Cash |
(0.9) |
N/A |
(0.9) |
N/A |
100.0 |
100.0 |
0.0 |
Source: Schroder AsiaPacific Fund, Edison Investment Research. Ranked by active weight.
Performance: Stock selection gives SDP the edge
Outperformance of the benchmark over the last 12 months has come primarily as a result of strong stock selection, especially in China and Taiwan but also in India, while the biggest detractor has been Thailand, where telecoms exposure was hurt by intensifying competition in a tough regulatory environment. Exhibit 6 illustrates the fund’s record of generating strong relative performance over the long term as well as the short term. While much of the absolute performance gain over the last year has been driven by sterling weakness, Dobbs sees little merit in putting currency hedging in place to mitigate the loss should sterling strengthen. This is because the team’s expertise lies in stock picking, not predicting future currency movements. In Taiwan, the portfolio holdings in several of its major electronics manufacturing companies performed well as the growth in demand for digital mobile communications, especially the iPhone 7, surpassed expectations. Meanwhile, a very low weighting in banks, and having nothing in Malaysia, also proved positive over the last 12 months.
|
Exhibit 5: Investment trust performance to 31 December 2016 |
|
Price, NAV and benchmark total return performance, one-year rebased |
Price, NAV and benchmark total return performance (%) |
|
|
|
Source: Thomson Datastream, Edison Investment Research. Note: Three-, five- and 10-year performance figures annualised. |
|
Exhibit 6: Share price and NAV total return performance, relative to indices (%)
|
One month |
Three months |
Six months |
One year |
Three years |
Five years |
10 years |
Price relative to MSCI AC Asia ex-Japan |
1.7 |
(0.3) |
2.3 |
0.7 |
9.5 |
8.9 |
23.7 |
NAV relative to MSCI AC Asia ex-Japan |
0.7 |
(0.5) |
1.7 |
1.6 |
10.0 |
14.1 |
25.4 |
Price relative to MSCI World TR GBP |
(2.7) |
(8.3) |
(1.2) |
(1.3) |
(1.7) |
(16.0) |
22.2 |
NAV relative to MSCI World TR GBP |
(3.7) |
(8.5) |
(1.7) |
(0.4) |
(1.3) |
(12.0) |
23.9 |
Price relative to FTSE All-Share |
(4.1) |
(5.5) |
2.0 |
8.4 |
23.5 |
7.1 |
63.9 |
NAV relative to FTSE All-Share |
(5.0) |
(5.7) |
1.4 |
9.4 |
24.1 |
12.2 |
66.3 |
Source: Thomson Datastream, Edison Investment Research. Note: Data to end-December 2016. Geometric calculation.
Discount: Scope to narrow from current level
The trust has the authority to buy back shares and the board is proactive in this regard but at the same time not wishing to interfere with the natural liquidity in the shares. At 30 December 2016, SDP’s cum-income discount to NAV stood at 11.5%.
|
Exhibit 7: Discount over three years (to cum-income NAV), % |
|
|
Source: Thomson Datastream, Edison Investment Research |
Capital structure and fees
SDP is a conventional investment trust with one class of share. There are currently 167.6m shares in issue. The trust has an indefinite life subject to a five-year continuation vote, with the next due at the 2021 AGM. During FY15, borrowings were restructured to reduce costs. The US$75m revolving credit facility was replaced with a £30m revolving credit facility, of which £29.7m has been drawn down, and a £30m overdraft. At the time of writing, the net effective gearing is 0.9%, well below the maximum allowed limit of 20%. This reflects the manager’s view that valuations are not compelling at present, such that he prefers to keep most of his powder dry for more attractive buying opportunities in the future.
Schroder Investment Management receives a tiered management fee starting at 0.95% pa on the first £100m of assets, 0.90% pa on the next £200m, 0.85% pa on the next £100m and 0.80% on assets in excess of £400m. Ongoing charges were 1.1% in FY16, up slightly from 1.0% in FY15. There is no performance fee.
Dividend policy
SDP is focused on capital growth rather than yield; it does not have a yield target or a progressive dividend policy, and this allows it greater flexibility to invest in less mature, typically smaller businesses that tend to have lower dividend payout ratios, but arguably superior scope for long-term total return. That said, the fund has increased its dividend in 19 out of 21 years since launch. The weakening of sterling in FY16 served to enhance the fund’s revenue enabling a material rise in dividend of 13.1%, following on from a 53% rise for FY15. SDP has historically provided its shareholders with both capital and income growth and this remains a core long-term objective. SDP’s dividend yield at the time of writing is 1.4%, reflecting the fact that the fund is well diversified across low-yield growth companies as well as the more mature income-producing stalwarts.
Peer group comparison
There are 15 trusts in the AIC Asia Pacific ex-Japan sector, three of which focus on income and two on smaller companies. Exhibit 8 shows data on all 15 trusts for comparative purposes, but we have highlighted the five peers that we view as being most directly comparable to SDP. SDP is the second largest trust in the group by market cap, as well as being one of the oldest. The trust’s increase in size over two decades primarily reflects absolute returns through organic growth, rather than additional share issuance. The discount to NAV is wider than the sector average, reflecting the greater demand currently for income-oriented strategies, with Asian income funds typically trading at close to NAV, skewing the average. NAV total return over the last year has been broadly in line with the peer group average, but is ahead of the peer group over both three and five years.
Exhibit 8: Asia Pacific ex-Japan investment trusts (as at 2 January 2017)
% unless stated |
Market cap £m |
NAV TR 1 Year |
NAV TR 3 Year |
NAV TR 5 Year |
NAV TR 10 Year |
Sharpe 1y (NAV) |
Sharpe 3y (NAV) |
Discount (ex-par) |
Ongoing charge |
Perf. fee |
Net gearing |
Dividend yield (%) |
Schroder Asia Pacific |
556.3 |
27.8 |
48.0 |
79.8 |
181.7 |
0.6 |
0.4 |
(11.6) |
1.1 |
No |
101 |
1.4 |
Aberdeen Asian Income |
363.2 |
30.3 |
25.8 |
57.6 |
191.4 |
0.7 |
(0.2) |
(6.8) |
1.3 |
No |
107 |
4.4 |
Aberdeen Asian Smaller |
339.0 |
32.1 |
31.3 |
97.7 |
319.3 |
1.2 |
(0.1) |
(14.8) |
1.8 |
No |
109 |
1.1 |
Aberdeen New Dawn |
223.6 |
27.7 |
24.7 |
47.1 |
140.7 |
0.5 |
(0.2) |
(11.5) |
1.1 |
No |
111 |
2.1 |
Edinburgh Dragon |
572.2 |
26.7 |
28.4 |
52.2 |
155.5 |
0.5 |
(0.1) |
(11.5) |
1.1 |
No |
109 |
1.1 |
Fidelity Asian Values |
234.2 |
37.7 |
61.1 |
103.9 |
219.1 |
1.4 |
0.6 |
(6.9) |
1.3 |
No |
101 |
1.3 |
Henderson Far East Income |
395.4 |
24.0 |
29.6 |
63.0 |
135.1 |
0.3 |
(0.1) |
3.5 |
1.2 |
No |
106 |
5.8 |
Invesco Asia Trust |
190.7 |
29.2 |
50.6 |
83.1 |
191.2 |
0.6 |
0.4 |
(10.2) |
1.0 |
No |
100 |
1.6 |
JPMorgan Asian |
259.5 |
26.7 |
37.3 |
61.4 |
96.5 |
0.4 |
0.1 |
(11.2) |
0.8 |
No |
102 |
0.9 |
Martin Currie Asia Unconstrained |
116.3 |
26.5 |
24.7 |
44.5 |
68.8 |
0.5 |
(0.2) |
(14.4) |
1.2 |
No |
104 |
2.4 |
Pacific Assets Trust |
286.4 |
23.4 |
53.5 |
110.2 |
159.8 |
0.3 |
0.6 |
1.4 |
1.3 |
No |
100 |
0.9 |
Pacific Horizon |
112.5 |
18.4 |
25.9 |
51.1 |
103.1 |
(0.1) |
(0.1) |
(10.7) |
1.1 |
No |
105 |
0.2 |
Schroder Asian Total Return Inv. Co |
185.9 |
28.9 |
53.0 |
73.4 |
125.8 |
0.8 |
0.5 |
(2.8) |
1.0 |
Yes |
111 |
1.5 |
Schroder Oriental Income |
553.6 |
30.9 |
50.5 |
94.5 |
213.5 |
0.8 |
0.4 |
1.6 |
0.9 |
Yes |
104 |
3.7 |
Scottish Oriental Smaller Cos |
282.6 |
24.6 |
36.2 |
93.9 |
321.0 |
0.4 |
0.1 |
(12.7) |
1.0 |
Yes |
91 |
1.3 |
Weighted average |
28.0 |
39.2 |
76.0 |
184.8 |
0.6 |
0.2 |
(7.3) |
1.1 |
104.2 |
2.2 |
||
Rank |
2 |
7 |
6 |
7 |
7 |
7 |
6 |
12 |
9 |
11 |
8 |
Source: Morningstar, Edison Investment Research. Note: TR = total return. The Sharpe ratio is a measure of risk-adjusted return. The ratios shown are calculated by Morningstar for the past 12- and 36-month periods by dividing a fund’s annualised excess returns over the risk-free rate by its annualised standard deviation. Net gearing is total assets less cash and equivalents as a percentage of net assets (100 = ungeared).
The board
There are currently five members of the board, all non-executive and independent of the manager. Since the January 2016 AGM the trust has been chaired by Nicholas Smith, who was first appointed to the board in 2010. The other directors are Anthony Fenn (appointed in 2005), Rosemary Morgan (appointed in 2012), James Williams (appointed in 2014) and Keith Craig (appointed in 2015). All of the board members have lived and worked in Asia.
|
|