“Edison is the go-to for a new investor to get full understanding of the investment case and business. Edison’s distribution reaches investors that we want to connect with directly.”
Join us for investment knowledge across your choice of sectors and equities.
To continue reading, log in or create a free account below.
Close
Close
Close
Create An Account
If you have an account with us, please click the sign in button below.
Have autos hit the brakes too hard?
Industrials
Have autos hit the brakes too hard?
Why now? A contrarian perspective
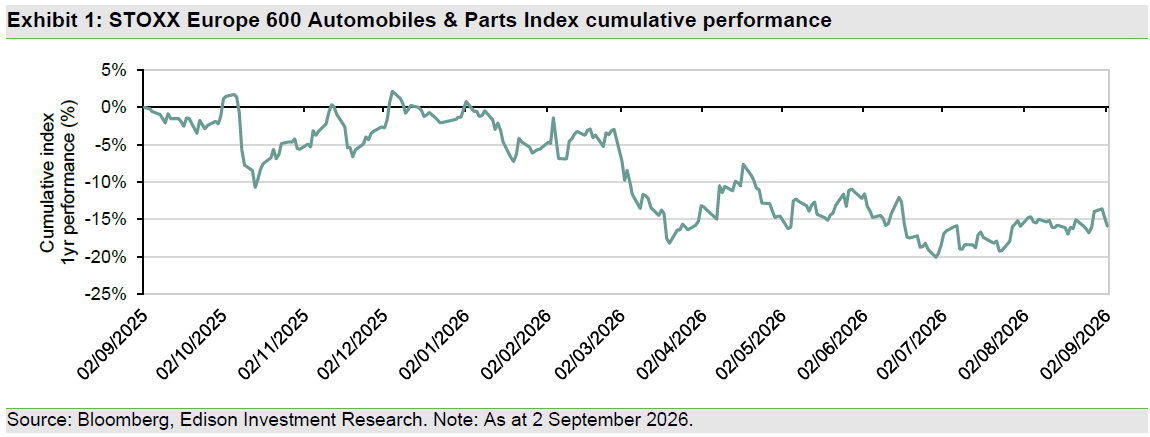
European auto equities have materially underperformed, but the medium-term outlook may be less negative than recent equity performance implies. The sector has fallen c 30% cumulatively over three years and c 32% over five years, versus gains of c 43% and c 38%, respectively, for MSCI Europe. The fundamental concerns are real: vehicle demand has weakened, Chinese competition has intensified, profitability remains under pressure and electrification is reshaping industry value pools. However, forecasts point to stabilisation rather than structural volume decline, while the STOXX Europe 600 Automobiles & Parts Index (SXAP) trades at just 0.60x book value. For a contrarian investor, the opportunity is therefore selective: a strong cyclical recovery may not be required if volumes stabilise, self-help supports margins and earnings expectations begin to find a floor.
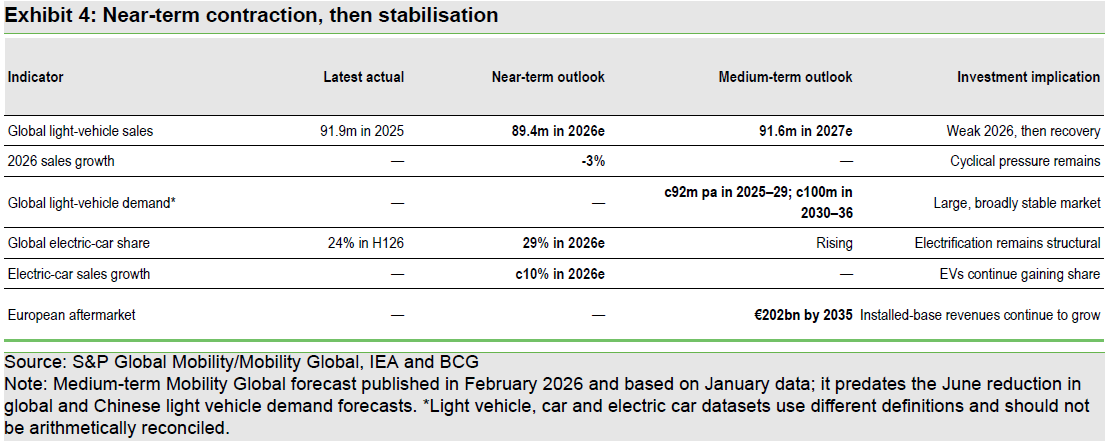
The industry backdrop remains difficult. S&P Global Mobility expects 89.4m global light vehicle sales in 2026, down 2.7% y-o-y, while Chinese car exports increased 65% in H126 and electric vehicle (EV) exports by more than 120%. Supplier economics also remain under pressure: 76% of CLEPA respondents expect 2026 margins below 5%, and 24% expect negative margins. China remains a structural competitive challenge, although sustaining the same pace of incremental marketshare gains may become harder as the base increases.
The counterpoint is that the outlook suggests stabilisation rather than structural decline. S&P expects global light vehicle sales to recover to 91.6m in 2027, while medium-term forecasts continue to imply a large and broadly stable global market. Electrification also remains a multi-powertrain transition: the International Energy Agency (IEA) expects EVs to account for 29% of global new car sales in 2026, leaving c 71% outside its EV category, while hybrids remain the largest EU powertrain category. The ageing European vehicle parc provides further support to aftermarket demand. Self-help offers another route to earnings recovery. At least a dozen OEMs and suppliers across the European and US peer universe are pursuing identifiable cost-reduction, restructuring, footprint or portfolio-simplification programmes. Some manufacturers are also reducing platform complexity and investment intensity. If volumes stabilise while these programmes deliver, the industry’s high fixed-cost base could allow margins to recover faster than revenues.
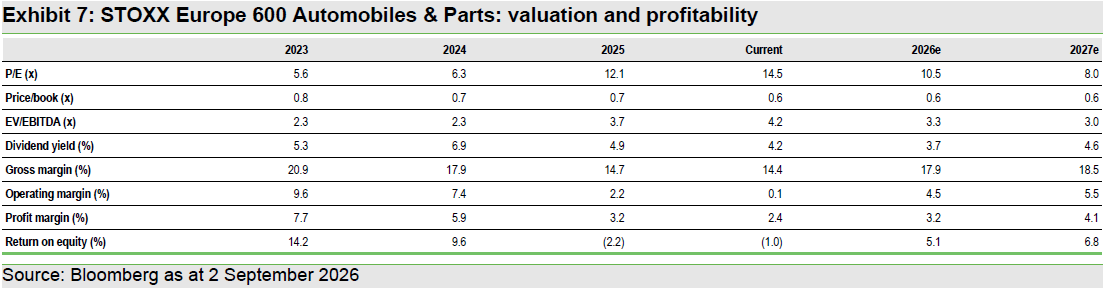
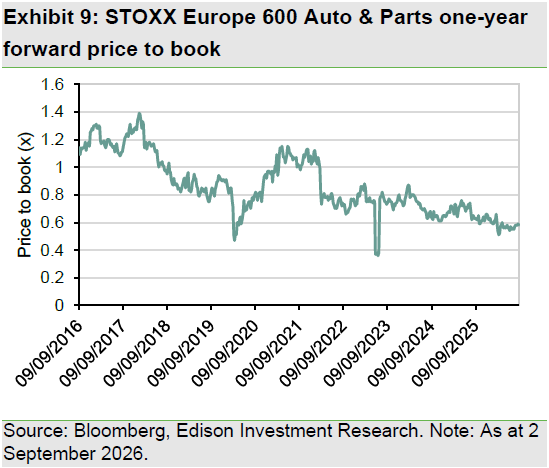
Valuation provides another potential reason to revisit the sector. The SXAP traded at 0.60x book value on 3 September 2026, versus highs of c 1.4x in 2017. Its operating margin fell from 9.6% in 2023 to 2.2% in 2025, while consensus expects a recovery to 4.6% in 2026e and 5.6% in 2027e. Some earnings normalisation is therefore assumed, but not a return to previous-cycle profitability. This lowers the hurdle for positive surprise, while execution risk remains.
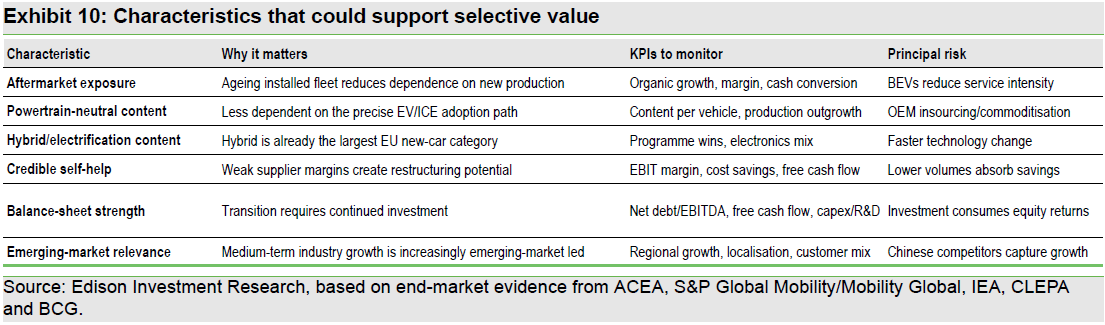
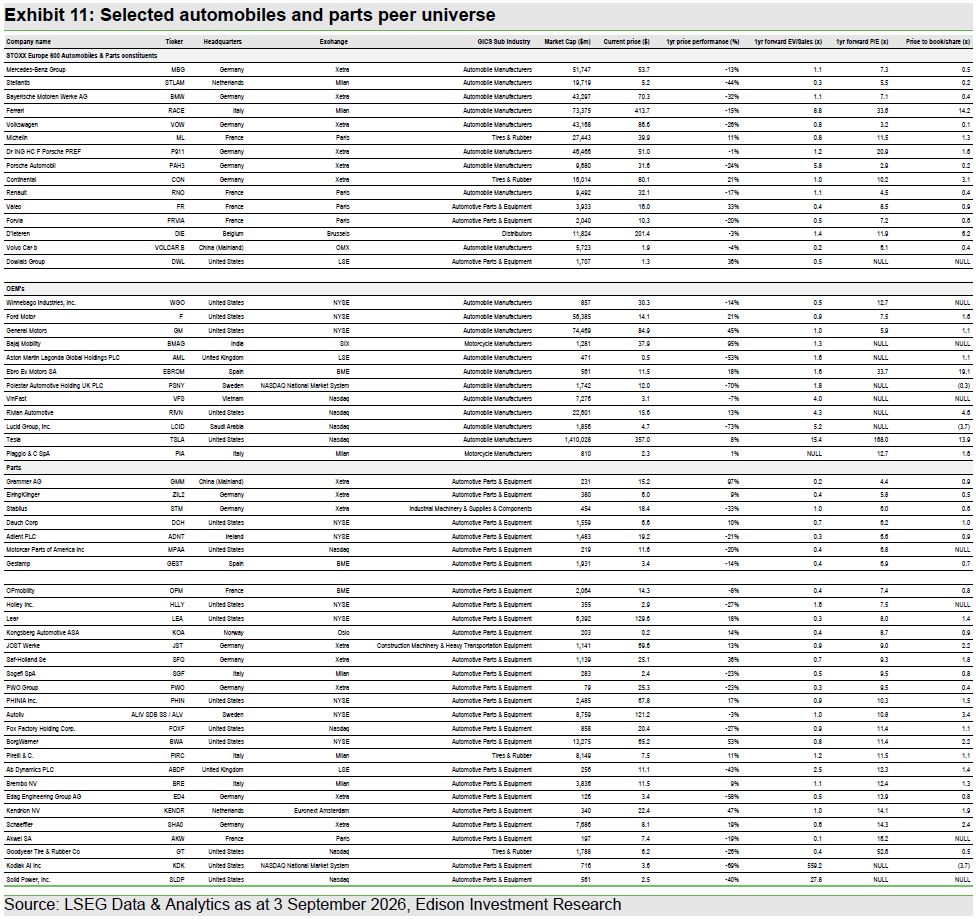
We see opportunities in selective companies rather than sectorwide. The opportunity is less about forecasting when conditions become good and more about identifying where expectations have already adjusted far enough. Businesses with credible self-help, resilient content, aftermarket exposure and strong balance sheets should be better positioned if conditions stabilise. To support investment idea generation, this report includes a wider automobiles & parts peer universe (Exhibit 11), ranked by forward EV/sales for OEMs and forward P/E for parts companies.
European auto equities have struggled to sustain a recovery
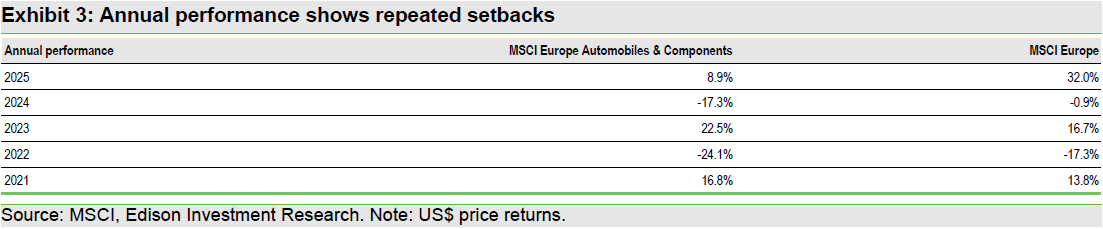
The scale of the sector’s relative underperformance is substantial. On the same MSCI methodology, the Automobiles & Components Index lagged MSCI Europe by 31.9pp over one year, 23.7pp per year over three years and 14.1pp per year over five years, based on our calculations (Exhibit 2).
The weakness has not been linear. The sector outperformed the wider European market in 2021 and 2023, but significant absolute and relative declines in 2022 and 2024, followed by substantial relative underperformance in 2025 and H126, have weighed heavily on longer-term returns.
There is an important index-construction caveat. The MSCI Europe Automobiles & Components Index contains only 10 constituents, led by Ferrari, Mercedes-Benz, Michelin, BMW and Volkswagen, and is concentrated in automobile manufacturers and tyres. It therefore captures European auto-sector sentiment well, but is not representative of the full breadth of the European component-supplier universe.
Out of favour for a reason
Volume expectations have weakened
The sector’s equity-market performance has coincided with downward revisions to vehicle demand. S&P Global Mobility’s June forecast reduced expected 2026 global light vehicle sales to 89.4m from 90.5m in April, while its 2027 forecast fell to 91.6m from 92.6m. The 2026 estimate compares with 91.9m sales in 2025 and implies a 2.7% y-o-y contraction.
The adjustment has been driven principally by China. S&P Global Mobility expects Chinese light vehicle sales to decline 7% to 25.38m units in 2026, 1.2m units below its April forecast. This is particularly relevant for European original equipment manufacturers (OEMs), and some Japanese manufacturers, given China’s importance as both a major end-market and a source of industry profits. Weaker Chinese demand therefore has a dual impact: it reduces local sales opportunities while also increasing the incentive for domestic manufacturers to redirect capacity into export markets. For an industry with significant fixed manufacturing costs, lower production and weaker utilisation can have a disproportionate effect on margins, particularly where pricing remains competitive.
Production forecasts tell a similar story. Mobility Global’s June 2026 production summary, compiled on 1 July, forecasts 90.7m light vehicles globally in 2026, down from 93.1m in 2025, before recovering to 91.6m in 2027. European production is forecast at 16.76m units in 2026 versus 17.05m in 2025, with only modest growth thereafter.
Our interpretation: Near-term industry volumes are unlikely to provide much operating leverage for European OEMs or suppliers. The more relevant question is whether current earnings can be sustained around broadly flat medium-term volumes.
Chinese competition has added to the pressure
Weak Chinese domestic demand has not translated directly into lower competitive intensity elsewhere. IEA data show Chinese car exports increased 65% y-o-y in H126, helping limit the decline in Chinese car production to c 6%, while EV exports increased by more than 120%. S&P Global Mobility estimates that higher Chinese exports add c 600,000 vehicles to global 2026 industry volumes relative to its previous assumptions, while also increasing pricing competition in destination markets.
The Chinese cost advantage extends beyond labour. In EVs, the IEA highlights integrated supply chains, battery capability and scale, and estimates Chinese manufacturers’ production costs at around 35% below those in developed economies. China also accounted for more than 80% of global battery-cell production in 2025, alongside even higher shares of cathode and anode active-material production.
This advantage is increasingly technological as well as cost led. Contemporary Amperex Technology (CATL) has remained the global leader in power batteries, with the company reporting a 39.2% global market share in 2025, while Chinese battery manufacturers have continued to advance technologies including lithium-ion batteries and solid-state batteries. The IEA also sees automotive value shifting from traditional mechanical components towards batteries, electronics and software, reinforcing the strategic importance of China’s position in these areas.
For incumbent suppliers, this creates two separate risks: pressure on vehicle pricing and market share (Chinese-made vehicles now represent c 7% of EU new car sales, according to the European Automobile Manufacturers’ Association (ACEA) as of April 2026) today, and the possibility that future content pools develop in areas where their competitive positions are weaker.
Supplier economics remain difficult
CLEPA’s Spring 2026 Pulse Check suggests that this pressure is already visible in suppliers’ profitability: 76% expect 2026 margins below 5%, while 24% expect negative profitability below -1%, compared with 15% expecting losses in the previous survey.
Margin pressure has also been evident among European OEMs. BMW reported an Automotive EBIT margin of 3.6% in H126, falling to 2.3% in Q2, while Volkswagen Group reported an H126 operating return on sales of 3.8%. Mercedes-Benz Cars’ adjusted return on sales was 4.0% in Q226 versus 5.1% a year earlier, reflecting, among other factors, intensified market pressure in China. Renault’s Automotive operating margin was 3.0% in H126, while Stellantis reported a 1.8% group adjusted operating income margin in Q226 and a negative 0.6% margin in Enlarged Europe.
Even Porsche has not been immune. Porsche’s group operating return on sales fell to 1.1% in 2025 from 14.1% in 2024, reflecting c €3.9bn of extraordinary expenses, including c €2.4bn related to product-strategy realignment and company rescaling and c €0.7bn of additional expenses associated with battery activities. Profitability has begun to recover in 2026, with Porsche reporting a 7.8% group operating return on sales in H126, but this remains well below the levels generated earlier in the cycle. Porsche’s case is notable because it illustrates how the costs associated with repositioning product portfolios and battery strategies can weigh materially on profitability even at historically high-margin OEMs.
Although these margins are only broadly comparable, the direction of travel reinforces the broader industry picture: profitability has been under pressure across both OEMs and the supplier base, increasing the importance of utilisation, pricing discipline, cost reduction and cash conversion.
At the same time, 73% of respondents in the CLEPA Pulse Check reported significant adjustments to their product portfolios, with examples including concentrating investment on electrification or software-driven platforms, phasing out lower-margin standardised components and redeploying automotive technology into adjacent industries.
There are also early signs that parts of the industry may be moving beyond peak investment intensity. Mercedes-Benz has said that capex and R&D investment peaked in 2025 and should begin to decline from 2026 onwards, alongside greater standardisation of components, modules and technology platforms. Stellantis is similarly seeking to improve capital efficiency through greater platform commonality, with around half of global volumes targeted to sit on three global platforms by 2030. Porsche, meanwhile, has already begun simplifying and rephasing its product strategy, including delaying a planned new EV platform and extending selected combustion and hybrid models.
VinFast Auto, a newer EV manufacturer, provides a further example of this shift. In our initiation of coverage, we highlighted the company’s transition to Vehicle Platform 2.0 and E/E Architecture 2.0, intended to increase component commonality, reduce part counts and simplify electronic architecture across the model range. The objective is to lower unit costs, improve manufacturing efficiency and reduce development complexity as volumes scale, supporting the company’s longer-term path towards profitability.
Restructuring initiatives complicate the interpretation of low headline multiples. Earnings may be cyclically depressed, but transition expenditure, R&D and restructuring can also prevent accounting earnings from converting into free cash flow. A low P/E is therefore not, in itself, sufficient evidence of value.
Low growth is not the same as no growth
The counterpoint to recent weakness is that the medium-term industry outlook still implies a large and broadly stable global vehicle market. S&P Global Mobility expects global light vehicle sales to recover from 89.4m in 2026 to 91.6m in 2027. Mobility Global’s February 2026 medium-term outlook, based on January data, envisaged approximately 92m vehicles annually in 2025–29 and c 100m in 2030–36, with most incremental demand coming from emerging markets. The June downgrade to Chinese demand means the latter should not be treated as an updated extension of the near-term forecast, but it remains useful evidence that the medium-term debate is around the level and geography of growth rather than the disappearance of global vehicle demand.
The pace of Chinese share gains may also become harder to sustain as the base increases. In China, EVs accounted for almost 55% of new car sales in 2025, up by around 6pp y-o-y, compared with average annual gains of roughly 10pp in 2020–24. EV sales growth also slowed to below 20% in 2025 from annual growth rates above 75% in 2020–24. The IEA expects China’s EV market share to rise to more than 60% in 2026, but with absolute EV sales broadly similar to 2025.
Our interpretation: This does not imply that competitive pressure from Chinese OEMs is easing, particularly given the rapid growth in exports, but as domestic EV penetration and Chinese brands’ share of key markets rise, sustaining the same rate of incremental market share gains becomes arithmetically more difficult. A moderation in the pace of market share loss could, at the margin, improve the earnings backdrop for incumbent European OEMs even without a meaningful recovery in underlying industry growth.
The outlook is subdued relative to previous auto cycles, but it is materially different from structural decline.
Our interpretation: If industry volumes stabilise around current levels, the strongest businesses do not necessarily require a broad demand recovery to generate acceptable equity returns. For loss-making or depressed-margin companies, a return to profitability could itself be a meaningful catalyst; and if volume growth does recover, the sector’s historically high fixed-cost base suggests that operating leverage could translate relatively quickly into margin and earnings improvement. The key question, therefore, is whether companies can sustain market share, protect cash conversion and rebuild profitability without materially increasing capital intensity.
Self-help could provide another lever
Self-help could provide an additional route to earnings recovery. Across the European and US peer universe included in this report (see Exhibit 11), at least a dozen OEMs and suppliers are currently pursuing identifiable cost-reduction, restructuring, footprint- or portfolio-simplification programmes. These range from Volkswagen’s target for more than €6bn of net annual cost improvement by 2030 and Stellantis’s €6bn annual cost-reduction target by 2028, to Mercedes-Benz’s planned 10% reduction in fixed costs and Lear’s targeted restructuring and automation savings.
Our interpretation: Self-help therefore provides a potential earnings lever that is less dependent on a broad recovery in vehicle demand. If volumes stabilise while these programmes deliver, the combination of lower fixed costs and historically high operating leverage could allow margins to recover faster than revenues.
Electrification is a more complex transition for traditional OEMs
EV adoption continues despite weakness in the overall car market. The IEA expects EVs to account for 29% of global new-car sales in 2026 and forecasts sales growth of around 10% y-o-y. EVs represented 24% of global car sales in H126 even as total global car sales fell by around 5%.
The IEA’s forecast therefore leaves c 71% of 2026 global new-car sales outside its EV category. This remains a significant structural transition, but it does not imply the immediate disappearance of other architectures.
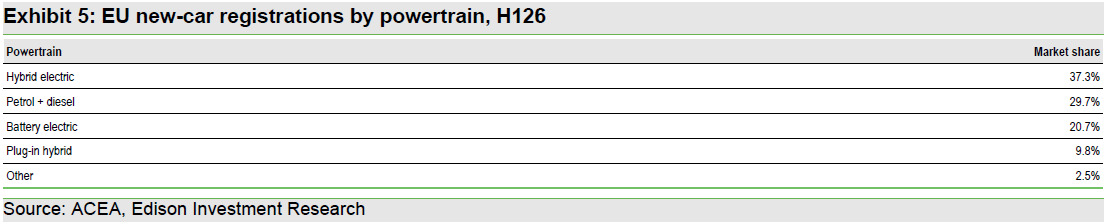
Europe illustrates this particularly clearly. In H126, hybrid EVs represented 37.3% of EU registrations, making them the largest powertrain category. Battery EVs represented 20.7%, plug-in hybrids 9.8% and petrol plus diesel 29.7%.
For suppliers, this makes the transition less binary than the headline debate suggests. Hybridisation can preserve parts of the conventional powertrain while adding electrical, electronic and thermal-management content. Battery EVs remove several traditional mechanical components but add new value pools in batteries, power electronics, sensors and software.
Our interpretation: For many suppliers, the more useful key performance indicator (KPI) is increasingly content per vehicle rather than vehicle volume alone. Businesses capable of increasing content across several architectures may be less sensitive to the precise speed of battery-electric adoption than suppliers concentrated in declining mechanical content.
The installed base supports aftermarket earnings
The transition in new registrations is occurring against an installed European vehicle base that changes much more slowly. The EU had almost 256m passenger cars on the road in 2024, up 1.4% y-o-y, and the average vehicle was 12.7 years old.
Battery EVs represented only 2.3% of the installed EU passenger-car fleet, with plug-in hybrids accounting for a further 1.4%. The overwhelming majority of vehicles requiring maintenance and replacement components therefore remain conventionally powered or hybrid.
This helps explain why aftermarket growth remains positive despite electrification. Boston Consulting Group (BCG) forecasts the European automotive aftermarket to reach €202bn by 2035, with the independent aftermarket representing approximately €117bn. It forecasts 2025–35 compound annual growth rates of 1.7% for authorised repair and 1.4% for the independent aftermarket.
The aftermarket is not insulated from EV adoption. BCG expects battery EVs to reduce maintenance frequency, while advanced driver assistance systems can reduce accident-related repairs. However, greater vehicle complexity also creates demand for higher-value electronic components and sensors, while an ageing vehicle parc supports replacement demand.
Our interpretation: Aftermarket exposure is better viewed as a partial buffer than as an EV hedge. Its attraction is that demand is tied to a large and ageing installed vehicle base rather than solely to annual new vehicle production.
Investment message: Electrification is advancing materially faster in new sales than through the installed vehicle base, supporting a longer tail for conventional aftermarket demand.
Current valuation lowers the hurdle for positive surprise
Sector valuation reflects much of this uncertainty. At 31 July 2026, the MSCI Europe Automobiles & Components Index traded on 7.94x forward earnings and 0.58x book value, compared with 14.99x and 2.52x, respectively, for MSCI Europe. Given the MSCI index’s concentration in OEMs and tyres, these multiples are best viewed as evidence of depressed sector sentiment rather than as a direct valuation benchmark for the broader supplier universe.
The longer history of the SXAP provides additional perspective. On Bloomberg data at 3 September 2026, the index traded at 0.60x book value, compared with 1.35–1.44x during 2013–17 and 0.81x as recently as 2023. Consensus implies a further decline to 0.57x in 2026e and 0.55x in 2027e. The de-rating on an asset-value basis has therefore been substantial and has persisted despite the changing composition of the sector.
Earnings-based multiples require more interpretation because current profitability is unusually depressed. The index’s reported P/E rose to 12.1x in 2025, largely reflecting the compression in earnings rather than a higher equity valuation. However, on consensus forecasts the multiple falls to 10.5x in 2026e and 8.0x in 2027e as earnings recover. A similar pattern is evident in EV/EBITDA, which declines from 4.2x currently to 3.3x in 2026e and 3.0x in 2027e.
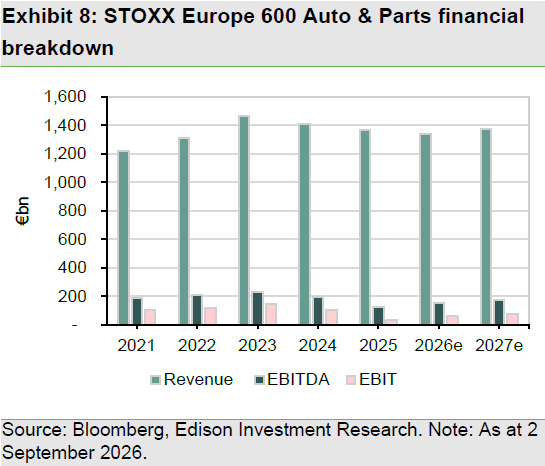
The important point, in our view, is that the low forward multiples are not independent of an expected recovery in profitability. The index’s operating margin declined from 9.6% in 2023 to 7.4% in 2024 and 2.2% in 2025, with Bloomberg’s current trailing measure close to break-even at 0.1%. Consensus expects this to recover to 4.6% in 2026e and 5.6% in 2027e. Gross margin is similarly expected to improve from c 14.4% currently to 18.5% by 2027e.
There is, therefore, already some earnings normalisation embedded in forecasts, but not a return to previous profitability. Even by 2027, the expected 5.6% operating margin would remain well below the 9.0–9.6% achieved in 2022–23. Return on equity (ROE) tells a similar story: ROE fell from 16.1% in 2022 and 14.2% in 2023 to negative 2.2% in 2025, with consensus expecting a recovery to 5.3% in 2026e and 6.8% in 2027e. The market is therefore forecasting an improvement from trough conditions, but not a return to the levels seen earlier in the cycle.
Cash generation also illustrates why investors have remained cautious. Free cash flow yield fell from 17.4% in 2022 and 10.8% in 2023 to 3.5% in 2024 and 2.8% in 2025. This deterioration has coincided with weaker margins and continued investment requirements across electrification, software and restructuring. At the same time, aggregate balance sheet leverage does not appear excessive: Bloomberg consensus indicates net debt/EBITDA of c 0.48x in 2026e and 0.40x in 2027e.
This combination is important for the investment case. The valuation picture remains mixed rather than uniformly inexpensive on every metric – and the low 2026–27e P/E multiples partly depend on the margin recovery already assumed by consensus. However, book-value, cash-flow and enterprise-value measures suggest that a considerable amount of scepticism remains embedded in valuations, while consensus profitability in 2027e remains materially below previous cycle levels.
Our interpretation: This lowers the hurdle for positive surprise, but does not remove execution risk. If volumes stabilise and restructuring allows operating margins to recover towards the 4–6% range currently expected for 2026–27, the industry’s fixed-cost base should allow a disproportionate improvement in earnings. A stronger volume recovery could provide further operating leverage. Conversely, failure to rebuild margins would make apparently low forward multiples less supportive than they first appear.
What could make investors return to the auto sector?
Base case: Stabilisation rather than recovery
Our base case is that 2026 remains difficult for global light vehicle demand, followed by a gradual recovery rather than a sharp cyclical rebound. This is broadly consistent with S&P Global Mobility’s expectation of 89.4m sales in 2026 and 91.6m in 2027. EV penetration continues to rise, but hybrid and conventional architectures remain economically relevant, particularly given the slow turnover of the installed fleet.
Under this scenario, company-specific factors – cost reduction, content growth, aftermarket exposure and cash conversion – should matter more than sector-level volume growth. For businesses operating at depressed margins, a return towards more normal profitability could itself become an important driver of earnings. If industry growth subsequently improves, the sector’s historically high fixed-cost base could also provide meaningful operating leverage, allowing relatively modest volume growth to translate into a more pronounced recovery in margins and earnings.
Bull case: The earnings floor becomes visible
A more constructive outcome would see global volume expectations stabilise, Chinese domestic demand improve and supplier restructuring translate into margin and free cash flow recovery.
Given current sector valuations, a bull case does not require a new auto cycle. Evidence that earnings expectations have stopped falling, margins are beginning to recover and free cash flow is improving could be enough to support a re-rating in selected companies. If volumes then recover more strongly, operating leverage could provide an additional earnings catalyst.
Bear case: Structural pressure overwhelms valuation support
The main risk is that apparently low valuations prove to be value traps. S&P reduced its 2026 global sales forecast by 1.1m vehicles between April and June, while the IEA has identified evidence of above-normal inventory build-up for Chinese EVs in some overseas markets. CLEPA’s latest survey also points to weak supplier profitability expectations.
Further volume downgrades, prolonged vehicle price deflation, stronger Chinese competition or sustained transition expenditure could therefore offset much of the apparent valuation support. In this scenario, low multiples would reflect structurally lower returns rather than cyclical dislocation.
Summary: Low expectations can become an asset
The case for reconsidering automobiles and parts is not that the industry’s problems have disappeared. Global demand has weakened, Chinese competitors continue to expand internationally, supplier profitability remains under pressure and electrification is changing where value is created within a vehicle.
What has become more interesting is the combination of low expectations and a less negative medium-term industry outlook than recent equity performance might suggest. The MSCI Europe Automobiles & Components Index has materially underperformed the wider European market over one, three and five years, while valuation multiples remain well below those of MSCI Europe. Near-term forecasts point to global light vehicle demand recovering after a difficult 2026, EVs continuing to gain share alongside hybrid and conventional vehicles, and the European aftermarket continuing to grow from a large and ageing vehicle base.
Underperformance alone does not make a contrarian investment case, particularly in a sector where structural change can persist for many years. What may make the current setup more interesting is the combination of depressed valuations, low earnings expectations and the possibility that the rate of deterioration begins to moderate. If vehicle volumes start to stabilise, restructuring begins to support margins and earnings revisions become less negative, investors may begin to reassess whether current valuations adequately reflect the sector’s medium-term earnings potential. Importantly, this does not require a return to historical growth rates. For companies where expectations have already adjusted substantially, the catalyst may simply be greater confidence that earnings have reached a more sustainable base.
Our conclusion remains selective rather than sector wide
The European auto sector continues to face genuine structural and cyclical challenges, including subdued volumes, Chinese competition, electrification-related investment and pressure on supplier profitability. However, current valuations and depressed earnings expectations mean that a strong cyclical recovery is not necessarily required for selected equities to perform. If volumes stabilise, restructuring programmes begin to support margins and free cash flow improves, the earnings outlook could become less negative even without a return to previous industry growth rates.
We would therefore favour businesses where the investment case does not depend on heroic assumptions, but rather on strong balance sheets, visible free cash flow, aftermarket exposure, content that remains relevant across several powertrains and credible self-help opportunities. Conversely, low headline multiples alone are unlikely to be sufficient where structural content loss, weak cash generation or persistently high capital intensity continue to erode returns.
For a contrarian investor, the opportunity is less about forecasting when conditions will improve and more about identifying where expectations have already adjusted far enough. Current sector forecasts imply only a partial recovery in profitability rather than a return to the 9–10% operating margins achieved earlier in the cycle. Evidence that volumes, margins, cash generation and earnings expectations have reached a sustainable floor could therefore be enough to prompt a reassessment of value. In that sense, the central question is not whether the European auto sector is about to enter another strong cycle, but whether selected companies simply need to begin to stabilise.
Value-selection framework
The opportunity is more likely to lie in stock selection than indiscriminate sector exposure. We would favour businesses with resilient aftermarket exposure, content that remains relevant across multiple powertrains, credible self-help programmes and balance sheets capable of funding the transition. These characteristics should matter more in an environment where industry volumes remain subdued, electrification is still evolving across several architectures and sector valuations already reflect a significant degree of pessimism.
Taken together, the most attractive opportunities should be those where earnings recovery does not depend on a strong cyclical rebound. Companies that can reduce costs, grow content per vehicle, improve cash conversion and benefit from even modest end-market stabilisation should be better placed to re-rate, while businesses facing structural content loss, weak cash generation or persistently high capital intensity may remain value traps despite low headline multiples.
Below (Exhibit 11) we have compiled a list of companies across the wider automobiles and parts sector and have sorted them in order from lowest to highest forward EV/sales multiples for the OEMs sector and lowest to highest P/E ratios for the parts sector.
*VinFast Auto is a client of Edison Investment Research.