Last close As at 05/08/2026
—
— 0.00 (0.00%)
Market capitalisation
—
Research: Energy & Resources
In this note, we update our short-term forecasts and NAV to reflect delays at South Disouq, with first gas postponed from mid-2019 to the end of 2019. Management is confident that first gas will be delivered in Q419, with the pipeline infrastructure largely installed. SDX retains the option to deliver first gas ahead of Q419 through a leased early production facility (EPF), but only a short window exists for this to be commercially viable ahead of the completion of the permanent central gas processing facility (CPF). Conservatively, we assume first gas at the end of 2019, a six-month delay to our previous forecasts. The impact of the South Disouq delay on NAV is small at -3%, as production is deferred, although there is a material impact on FY19 cash flow expectations (CFO -20%). However, the combined impact of the South Disouq delay and lower forecast Moroccan and NW Gemsa volumes reduce our RENAV by c 13% to 86.5p/share. We expect SDX Energy to end the year with $11m in cash and no debt ($10m undrawn). Delays are unlikely to have a knock-on effect on the company’s committed eight- to nine-well H219 exploration programme.
Written by
SDX Energy |
NAV and forecast update - South Disouq delays |
Forecast update |
Oil & gas |
16 April 2019 |
Share price performance
Business description
Next event
Analysts
SDX Energy is a research client of Edison Investment Research Limited |
|||||||||||||||||||||||||||||||||||||||||||||||||
In this note, we update our short-term forecasts and NAV to reflect delays at South Disouq, with first gas postponed from mid-2019 to the end of 2019. Management is confident that first gas will be delivered in Q419, with the pipeline infrastructure largely installed. SDX retains the option to deliver first gas ahead of Q419 through a leased early production facility (EPF), but only a short window exists for this to be commercially viable ahead of the completion of the permanent central gas processing facility (CPF). Conservatively, we assume first gas at the end of 2019, a six-month delay to our previous forecasts. The impact of the South Disouq delay on NAV is small at -3%, as production is deferred, although there is a material impact on FY19 cash flow expectations (CFO -20%). However, the combined impact of the South Disouq delay and lower forecast Moroccan and NW Gemsa volumes reduce our RENAV by c 13% to 86.5p/share. We expect SDX Energy to end the year with $11m in cash and no debt ($10m undrawn). Delays are unlikely to have a knock-on effect on the company’s committed eight- to nine-well H219 exploration programme.
Year-end |
Revenue |
PBT* |
Operating |
Net cash |
Capex |
Production |
12/17 |
39.2 |
32.8 |
21.6 |
25.8 |
(24.9)** |
3.2 |
12/18 |
53.7 |
7.1 |
36.2 |
17.3 |
(44.8) |
3.6 |
12/19e |
57.8 |
24.6 |
27.9 |
11.2 |
(36.0) |
4.3 |
12/20e |
79.3 |
36.3 |
53.9 |
36.4 |
(30.2) |
9.7 |
Note: *PBT is normalised, excluding amortisation of acquired intangibles, exceptional items and share-based payments. **Excludes Circle acquisition ($28.1m).
South Disouq pushed back
South Disouq is a key project for SDX and has the potential to be expanded from the current 50–60mmscfd of gas production to over 100mmscfd as incremental reserves are added. A six-month delay poses questions around the execution strategy and development concept, but ensuring alignment between the state, partners, local and international contractors can be a challenge, even for projects with local technical complexity.
SDX FY18 results in review
Production in FY18 at 3.6kboed was c 10% below our last published forecasts, driven by lower production at NW Gemsa where three wells remain shut in awaiting workover. Production continued to expand in Morocco reaching, more than 6mmscfd gross in March 2019 with the company guiding to a 9–11mmscfd exit rate for FY19. We now forecast average gross sales of 7.4mmscfd, down from 9.5mmscfd based on a slower than previously expected ramp-up in gas sales to new customers.
Valuation: NAV down 13% to 86.5p/share
Our NAV falls by 13%, driven by delays at South Disouq. However, the shares appear to be heavily discounting future growth potential in Egypt and Morocco. We believe successful delivery of South Disouq first gas by end 2019 and growth in Sebou gas sales to a 9–11mmscd exit rate is required to drive a re-rating.
FY19 forecasts reflect South Disouq delay
During 2018, SDX achieved operational and commercial success by growing Sebou gas sales, maintaining Egypt production levels, but South Disouq project execution fell behind management guidance. In Morocco, the company completed its drilling campaign with seven discoveries from nine drilled wells. SDX also acquired and processed 240km2 of 3D seismic leading to further drilling targets for its 12-well drilling campaign, expected to begin in Q319. Please see our update note published on 8 January for further details on upcoming drilling catalysts.
SDX’s FY18 net production increased 10% from FY17 to 3.6kboed, driving an 18% increase in EBITDA to $25.0m while maintaining a healthy net cash position of $17.3m as of 31 December 2018. Exhibit 1 below provides our updated forecasts for FY19 and FY20, and introduces forecasts for FY21, which reflect SDX’s FY18 reported results, South Disouq delays and a small change to our underlying oil price assumptions (gas unchanged). FY18 production was approximately 10% lower than Edison forecasts, due to North West Gemsa well shut-ins and slower ramp-up in Sebou gas sales. For 2019, the delaying to first gas at South Disouq in addition to lower production forecasts for North West Gemsa and Sebou negatively impacts our FY19 production forecast by -49% due to the high-volume nature of the project. This consequently decreases our revenue and EBTIDA forecast to $57.8m and $35.8m respectively.
Exhibit 1: Edison updated forecasts
Actuals |
New |
Old |
Change |
|||||||
2018 |
2019e |
2020e |
2021e |
2018e |
2019e |
2020e |
2018e |
2019e |
2020e |
|
Production (kboed) |
3.6 |
4.3 |
9.7 |
9.4 |
4.0 |
8.3 |
10.0 |
(10%) |
(49%) |
(2%) |
Revenue ($m) |
53.7 |
57.8 |
79.3 |
78.9 |
53.1 |
73.3 |
86.7 |
1% |
(21%) |
(9%) |
EBITDA ($m) |
25.0 |
35.8 |
53.9 |
53.8 |
25.2 |
50.2 |
64.6 |
(1%) |
(29%) |
(17%) |
FCF ($m) |
(8.0) |
(6.1) |
25.2 |
52.8 |
(9.9) |
7.1 |
46.9 |
(19%) |
(187%) |
(46%) |
|
||||||||||
Brent ($/bbl) |
71.19 |
65.15 |
62.00 |
65.92 |
71.40 |
61.00 |
64.58 |
N/A |
7% |
(4%) |
SD gas price ($/mcf) |
2.85 |
2.85 |
2.85 |
2.85 |
2.85 |
2.85 |
2.85 |
N/A |
N/A |
N/A |
Sebou gas price ($/mcf) |
10.50 |
10.47 |
10.55 |
10.44 |
10.50 |
10.47 |
10.55 |
N/A |
N/A |
N/A |
Source: SDX Energy, Edison investment Research
South Disouq first gas
Achieving first gas at South Disouq is a key milestone for SDX to drive production volume and cash flow growth. Gross plateau production at 50–60mmscfd gross (55% SDX working interest) is expected to add c 5.5kboed to group production (group production was 3.6kboed for FY18), at a price of $2.85/mcf. Gas will be sold to the Egyptian Natural Gas Holding Company (EGAS). However, early in April 2019, SDX announced a delay in the start-up for gas production at South Disouq awaiting completion of the main central gas processing facility (CPF), expected to be completed in Q419. Consequently, we update our valuation by delaying South Disouq gas production and revenue by six months to start at end 2019.
Valuation
We value SDX using a conventional NAV approach based on the NPV12.5 of the company’s producing assets minus overheads and net financial liabilities. A full breakdown of our NAV is provided in Exhibit 2, using data available in the company’s last published results, as well as public sources. Key changes from our previous valuation include:
1.
a delay in South Disouq first gas to end 2019;
2.
an increase in short-term oil price assumptions, which move to $65.15/bbl and $62.00/bbl for 2019 and 2020. Our long-term oil price assumption remains at US$70.0/bbl Brent (2022);
3.
lower production at NW Gemsa, due to well shut-ins and awaiting completion of workovers;
4.
reduced production in Morocco from an average 9.5mmscfd gross to 7.4mmscfd gross based on a delay in signing up new offtake relative to previous forecasts; and
5.
a minor change in go-forward FX from US$/£0.78 to US$/£0.77.
We note that SDX is relatively insensitive to oil price assumptions, with the bulk of the valuation consisting of gas sales at five-year fixed contracted prices in Morocco that average $10.5/mcf. Our FX assumption has also changed slightly to US$/£0.77, based on the average of the last six months ending in 31 March 2019. As a result, we have decreased our RENAV to 86.5p/share from 99.6p/share (-13%), with our core value decreasing from 83.6p/share to 70.1p/share (-16%).
Exhibit 2: SDX Energy detailed valuation
Asset |
Recoverable reserves |
Net risked value @12.5% |
||||||||
Country |
Diluted WI |
CoS |
Gross |
Net WI |
Net |
NPV |
Absolute |
GBp/ |
C$/ |
|
% |
% |
mmboe |
mmboe |
mmboe |
$/boe |
$m |
||||
Net cash at December 2018 |
17.3 |
6.6 |
0.1 |
|||||||
SG&A - NPV12.5 of 3yrs |
(18.1) |
(6.9) |
(0.1) |
|||||||
E&A expense for exploration prospects |
(14.2) |
(5.4) |
(0.1) |
|||||||
NPV of net receivable recovery |
16.8 |
6.3 |
0.1 |
|||||||
Sebou Pipeline residual value (50% cost) |
16.4 |
6.2 |
0.1 |
|||||||
Production |
||||||||||
Meseda Base + Workovers + Rabul |
Egypt |
50% |
90% |
8.4 |
4.2 |
1.6 |
7.4 |
28.0 |
10.6 |
0.1 |
Gemsa 2P |
Egypt |
50% |
100% |
4.2 |
2.1 |
2.1 |
11.2 |
23.4 |
8.9 |
0.1 |
Sebou 2P volume + discoveries to be booked |
Morocco |
75% |
100% |
0.7 |
0.5 |
0.5 |
34.9 |
18.2 |
6.9 |
0.1 |
Sebou 12-well programme |
Morocco |
75% |
75% |
4.3 |
3.2 |
3.2 |
30.4 |
73.6 |
27.8 |
0.4 |
South Disouq/Ibn Yunus |
Egypt |
55% |
100% |
17.6 |
9.7 |
9.7 |
2.5 |
24.3 |
9.2 |
0.1 |
Core NAV |
35.2 |
19.7 |
17.1 |
8.5 |
185.6 |
70.1 |
0.9 |
|||
Development upside |
||||||||||
Meseda Waterflood Upside |
Egypt |
50% |
50% |
5.3 |
2.6 |
1.0 |
5.1 |
6.7 |
2.5 |
0.0 |
Gemsa - Edison modelling on full field |
Egypt |
50% |
70% |
1.8 |
0.9 |
0.9 |
9.9 |
6.8 |
2.6 |
0.0 |
Exploration (known) |
||||||||||
Kafr el Sheik prospect x4 |
Egypt |
55% |
27% |
33.6 |
18.5 |
18.5 |
1.6 |
8.0 |
3.0 |
0.0 |
Abu Madi prospect x2 |
Egypt |
55% |
23% |
5.7 |
3.1 |
3.1 |
1.6 |
1.1 |
0.4 |
0.0 |
Young oil prospect |
Egypt |
55% |
19% |
50.0 |
27.5 |
27.5 |
4.0 |
20.8 |
7.9 |
0.1 |
Group RENAV |
131.6 |
72.4 |
68.2 |
229.0 |
86.5 |
1.1 |
||||
Source: Edison Investment Research. Note: Number of shares = 204.7m, FX = US$/£0.77.
Exhibit 3 breaks down our valuation by asset, showing where our base case core NAV sits relative to the current share price. SDX currently trades at a material discount to our core valuation, despite the South Disouq delay.
|
Exhibit 3: SDX Energy valuation waterfall |
|
|
Source: Edison Investment Research |
Financials
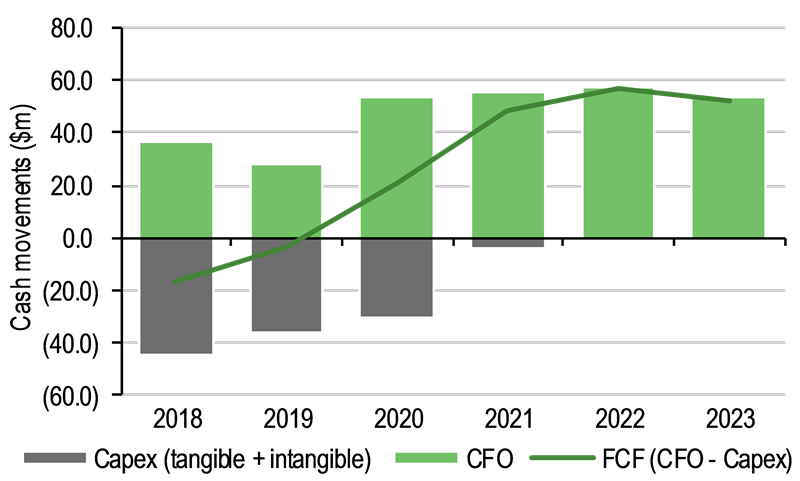
SDX retains a robust balance sheet, with cash and equivalents of $17.3m at end FY18 and no drawn debt. The company has access to up to $10m of its RBL borrowing base, which can be drawn down if required. Forecast cash or net debt will be driven by a combination of production start-up at South Disouq, production growth in Morocco and oil prices, as well as phasing of the company’s planned drilling programme. On our base case, we expect SDX to end FY19 with $11.2m of cash, but with a significant range of uncertainty without firm dates for the start-up of South Disouq, timing of Morocco gas sales FY19 exploration wells/costs.
|
Exhibit 4: Cash flow forecasts and committed capex |
Exhibit 5: Group production expectations* |
|
|
|
Source: Edison Investment Research |
Source: Edison Investment Research. Note: *Assumes South Disouq first gas at end 2019. |
|
Exhibit 4: Cash flow forecasts and committed capex |
|
|
Source: Edison Investment Research |
|
Exhibit 5: Group production expectations* |
|
|
Source: Edison Investment Research. Note: *Assumes South Disouq first gas at end 2019. |
Exhibit 6: Financial summary
IFRS, Year-end: December, US$000s |
|
2017 |
2018 |
2019e |
2020e |
2021e |
|
INCOME STATEMENT |
|||||||
Total revenues |
|
39,166 |
53,679 |
57,786 |
79,327 |
78,950 |
|
Cost of sales (direct expense) |
|
(10,254) |
(11,934) |
(15,059) |
(17,780) |
(16,700) |
|
Gross profit |
|
28,912 |
41,745 |
42,727 |
61,547 |
62,250 |
|
SG&A (expenses) |
|
(8,793) |
(7,270) |
(7,634) |
(8,015) |
(8,416) |
|
Other income/(expense) |
|
1,820 |
1,025 |
1,914 |
1,526 |
1,194 |
|
Exceptionals and adjustments |
|
(725) |
(10,458) |
(1,194) |
(1,194) |
(1,194) |
|
Depreciation and amortisation |
|
(17,824) |
(17,268) |
(11,007) |
(17,436) |
(15,787) |
|
Reported EBIT |
|
3,390 |
7,774 |
24,806 |
36,428 |
38,047 |
|
Finance income/(expense) |
|
(129) |
(542) |
0 |
0 |
0 |
|
Other income/(expense) |
|
29,558 |
(174) |
(174) |
(174) |
(174) |
|
Exceptionals and adjustments |
|
0 |
0 |
0 |
0 |
0 |
|
Reported PBT |
|
|
32,819 |
7,058 |
24,632 |
36,254 |
37,873 |
Income tax expense (includes exceptionals) |
|
|
(4,541) |
(7,021) |
(2,564) |
(2,186) |
(1,865) |
Reported net income |
|
|
28,278 |
37 |
22,068 |
34,068 |
36,007 |
Shares at end of period - basic |
|
|
204 |
205 |
205 |
205 |
205 |
BALANCE SHEET |
|
|
|
|
|
|
|
Property, plant and equipment |
|
|
54,445 |
48,680 |
68,176 |
76,379 |
63,719 |
Goodwill |
|
|
0 |
0 |
0 |
0 |
0 |
Intangible assets |
|
|
15,231 |
39,128 |
44,591 |
49,184 |
49,744 |
Other non-current assets |
|
|
2,724 |
3,394 |
3,394 |
3,394 |
3,394 |
Total non-current assets |
|
|
72,400 |
91,202 |
116,161 |
128,956 |
116,857 |
Cash and equivalents |
|
|
25,844 |
17,345 |
11,199 |
36,367 |
89,127 |
Inventories |
|
|
5,157 |
5,236 |
6,607 |
7,801 |
7,327 |
Trade and other receivables |
|
|
37,656 |
24,324 |
25,959 |
20,767 |
16,614 |
Other current assets |
|
|
0 |
0 |
0 |
0 |
0 |
Total current assets |
|
|
68,657 |
46,905 |
43,766 |
64,935 |
113,068 |
Non-current loans and borrowings |
|
|
0 |
0 |
0 |
0 |
0 |
Other non-current liabilities |
|
|
4,506 |
4,572 |
4,572 |
4,572 |
4,572 |
Total non-current liabilities |
|
|
4,506 |
4,572 |
4,572 |
4,572 |
4,572 |
Trade and other payables |
|
|
19,459 |
14,418 |
12,976 |
11,679 |
10,511 |
Current loans and borrowings |
|
|
0 |
0 |
0 |
0 |
0 |
Other current liabilities |
|
|
2,473 |
3,078 |
3,078 |
3,078 |
3,078 |
Total current liabilities |
|
|
21,932 |
17,496 |
16,054 |
14,757 |
13,589 |
Equity attributable to company |
|
|
114,619 |
116,039 |
139,301 |
174,563 |
211,764 |
Non-controlling interest |
|
|
0 |
0 |
0 |
0 |
0 |
CASH FLOW STATEMENT |
|
|
|
|
|
|
|
Profit before tax |
|
|
32,819 |
7,058 |
24,632 |
36,254 |
37,873 |
Net finance expenses |
|
|
0 |
0 |
0 |
0 |
0 |
Depreciation and amortisation |
|
|
17,824 |
17,268 |
11,007 |
17,436 |
15,787 |
Share based payments |
|
|
538 |
1,194 |
1,194 |
1,194 |
1,194 |
Other adjustments |
|
|
(34,613) |
3,224 |
(1,914) |
(1,526) |
(1,194) |
Movements in working capital |
|
|
5,412 |
8,584 |
(4,448) |
2,700 |
3,460 |
Interest paid / received |
|
|
0 |
0 |
0 |
0 |
0 |
Income taxes paid |
|
|
(364) |
(1,091) |
(2,564) |
(2,186) |
(1,865) |
Cash from operations (CFO) |
|
|
21,616 |
36,237 |
27,907 |
53,872 |
55,254 |
Capex |
|
|
(24,917) |
(44,810) |
(35,967) |
(30,231) |
(3,688) |
Acquisitions & disposals net |
|
|
(24,948) |
0 |
0 |
0 |
0 |
Other investing activities |
|
|
760 |
525 |
1,914 |
1,526 |
1,194 |
Cash used in investing activities (CFIA) |
|
(49,105) |
(44,285) |
(34,053) |
(28,704) |
(2,494) |
|
Net proceeds from issue of shares |
|
|
48,510 |
114 |
0 |
0 |
0 |
Movements in debt |
|
|
(43) |
(197) |
0 |
0 |
0 |
Other financing activities |
|
|
0 |
0 |
0 |
0 |
0 |
Cash from financing activities (CFF) |
|
|
48,467 |
(83) |
0 |
0 |
0 |
Increase/(decrease) in cash and equivalents |
|
|
20,978 |
(8,131) |
(6,146) |
25,167 |
52,761 |
Currency translation differences and other |
|
|
141 |
(368) |
0 |
0 |
0 |
Cash and equivalents at end of period |
|
25,844 |
17,345 |
11,199 |
36,367 |
89,127 |
|
Net (debt) cash start of period |
|
|
25,844 |
17,345 |
11,199 |
36,367 |
89,127 |
Movement in net (debt) cash over period |
|
|
21,119 |
(8,499) |
(6,146) |
25,167 |
52,761 |
Source: Company accounts, Edison Investment Research
|
|
Research: Industrials
Carbios’s FY18 results were slightly in advance of our estimates and the company remains on track to generate commercial revenues in 2020. We have adjusted our forecasts following the results and our DCF valuation remains at €15/share. However, a key factor in determining Carbios’s short-term valuation will be the nature of the financing for the PET bio recycling demonstration plant, which has yet to be disclosed.