Last close As at 05/08/2026
—
— 0.00 (0.00%)
Market capitalisation
—
Research: Industrials
Carbios’s FY18 results were slightly in advance of our estimates and the company remains on track to generate commercial revenues in 2020. We have adjusted our forecasts following the results and our DCF valuation remains at €15/share. However, a key factor in determining Carbios’s short-term valuation will be the nature of the financing for the PET bio recycling demonstration plant, which has yet to be disclosed.
Carbios |
Commercial revenues in 2020 |
Annual update |
Industrial support services |
16 April 2019 |
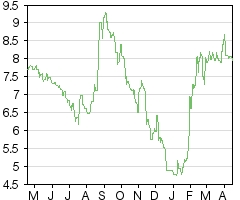
Share price performance
Business description
Next events
Analyst
Carbios is a research client of Edison Investment Research Limited |
|||||||||||||||||||||||||||||||||||||||||||||
Carbios's FY18 results were slightly in advance of our estimates and the company remains on track to generate commercial revenues in 2020. We have adjusted our forecasts following the results and our DCF valuation remains at €15/share. However, a key factor in determining Carbios’s short-term valuation will be the nature of the financing for the PET bio recycling demonstration plant, which has yet to be disclosed.
Year end |
Revenue (€m) |
PBT* |
EPS* |
DPS |
P/E |
Yield |
12/17 |
1.0 |
(4.6) |
(86.0) |
0.0 |
N/A |
N/A |
12/18 |
1.1 |
(4.3) |
(67.0) |
0.0 |
N/A |
N/A |
12/19e |
1.2 |
(4.8) |
(74.0) |
0.0 |
N/A |
N/A |
12/20e |
1.6 |
(4.2) |
(64.0) |
0.0 |
N/A |
N/A |
Note: *PBT and EPS are normalised, excluding amortisation of acquired intangibles, exceptional items and share-based payments.
FY18 results marginally ahead of forecasts
Carbios's FY18 results were slightly in advance of our estimates. While revenue matched our forecasts, lower than anticipated costs helped reduce reported operating losses to €4.2m, versus our forecast of losses of €4.6m. The other significant feature of the P&L was the higher than forecast tax credit (FY18: €1.2m vs Edison FY18e: €0.7m) due to an increase in R&D expenditure eligible for the credit. Net cash at year-end FY18 totalled €5.1m and Carbios believes it has sufficient resources to pursue current developments for the next 12 months. Significantly, however, current developments do not include financing the demonstration of its PET bio recycling technology, for which it will need to seek additional funding.
Scientific and commercial progress
Carbios continues to make scientific progress and advance towards the commercialisation of its technology. During FY18, Carbios revealed that it had depolymerized 97% of PET plastic in 16 hours and signed a letter of intent with KEM ONE to construct a PET bio recycling demonstration plant (c 200 tons pa) on KEM ONE’s industrial site at Saint-Fons. Since the year end, Carbios has received a further €4m grant from ADEME, produced the first PET bottle with 100% recycled plastic waste and announced, significantly, that it had signed a multi-year agreement with Novozymes. Under the terms of the agreement, Novozymes has committed to become a long-term exclusive supplier of Carbios’s plastic degrading enzyme. The commercial launch of Carbiolice is expected in 2020.
Valuation: Small increase in DCF valuation
In the absence of profits or significant short-term commercial revenues, we continue to consider a DCF based approach to be the best method for providing an indicative valuation. However, we need to add a caveat that the timing and scale of future cash flows remain highly uncertain. Following the release of the FY18 figures we have made minor adjustments to our forecasts and updated our DCF. Under our central case scenario, the valuation remains at €15/share, although this takes no account of the potential impact of financing the PET demonstration plant.
Managing the transition to commercial activity
FY18 results show reduction in losses
Carbios's FY18 results were slightly in advance of our forecasts. While revenue (mostly research service fees from Carbiolice – €0.72m out of total revenue of €1.083m) matched our forecasts, lower than anticipated costs (salaries, wages, social security and depreciation) helped reduce operating losses to €4.2m, versus our forecast of losses of €4.6m.
The other significant feature of the P&L was the higher than forecast tax credit (FY18: €1.2m vs Edison FY18e: €0.7m) due to an increase in R&D expenditure eligible for the tax credit. Overall net losses of €3.1m are c €0.8m better than FY17 and ahead of our forecast FY18 loss of €3.9m. Net cash at year-end FY18 totalled €5.1m, lower than our forecasts due to lower debt raising/receipt of repayable loans from funding bodies (despite €1.5m from Bpifrance). Nevertheless, due to the lower than anticipated cost base (and lower levels of underlying cash burn) Carbios now believes it has sufficient resources to pursue current developments for the next 12 months. Significantly, however, current developments do not include financing the demonstration plant (estimated cost €15–20m) for its PET biorecycling technology, for which it will need to seek additional funding.
Exhibit 1: Carbios’s FY18 financial highlights versus FY17 and Edison FY18e forecast
€m |
FY17 |
FY18 |
Change |
Edison |
Revenues |
0.98 |
1.08 |
+10.2% |
1.10 |
Reported Operating profit/(loss) |
(4.65) |
(4.24) |
+8.8% |
(4.60) |
Finance income/(expense) |
0.02 |
(0.03) |
N/A |
(0.01) |
Income before taxes & exceptional items |
(4.63) |
(4.26) |
+7.8% |
(4.61) |
Extraordinary items |
(0.01) |
(0.04) |
N/A |
0 |
Income tax credit |
0.70 |
1.19 |
+70.0% |
0.70 |
Profit/(loss) |
(3.94) |
(3.11) |
+21.1% |
(3.91) |
Cash at end of period (excludes repayable advances) |
7.55 |
5.15 |
-31.8% |
8.53 |
Source: Edison Investment Research, Carbios
FY18 commercial and scientific progress
FY18 was a year of continuing scientific progress. In March, Carbios announced that it had successfully depolymerized polyester fibres from textile waste and in July it revealed that it had depolymerized (carried out in a reactor of 1,000 litres) 97% of PET plastic in 16 hours (eight hours quicker than it had announced in April). On a commercial level, Carbios contributed (€1.1m out of a total of €3.35m) to the second round of financing of Carbiolice in July, and in November signed a letter of intent with KEM ONE to construct a PET biorecycling demonstration plant at KEM ONE’s industrial site in Saint-Fons. Dr Philippe Pouletty joined the Board of Directors as a representative of the largest shareholder, Truffle Capital, in September and Ian Hudson was appointed chairman in December (with effect from January 2019). Mr Hudson spent significant periods with ICI and DuPont de Nemours, and was also a member of the Foundation Board of IMD and a member of the Swiss-American Chamber of Commerce. After serving as chairman for three years, Jean Falgoux will continue as a member of the Board of Directors. Since the year end, Carbios has received a further €4m grant from ADEME, announced a joint venture development agreement with Novozymes and produced its first PET bottles from 100% recycled plastic waste. The commercial launch of Carbiolice remains on schedule for 2020.
Carbios: Strategy and business model
It is worth re-emphasising that Carbios’s business model is based on the use of enzymes produced by natural micro-organisms to degrade the polymers that make up plastic materials. Carbios is currently developing two new bioprocesses/products applicable to its targeted markets of polyethylene terephthalate (PET) and polylactic acid (PLA):
■
fully biodegradable plastics with a controlled lifespan (biodegradation);
■
infinite biorecycling of plastic waste, enabling the production of new plastics of the same quality as the original product (biorecycling); and
The financial model adopted by Carbios is based on licensing its products (enzymes, technologies and bioprocesses), either directly or via joint ventures, to other industrial companies. The licences are designed to generate revenue in the form of upfront payments, royalties and/or dividends. Subsidiary, Carbiolice, is expected to start generating commercial revenues from 2020, but it is worth examining the progress that has been made by Carbios in its key markets of PET and PLA.
PET
PET is strong and naturally transparent, and is one of the most commonly used polymers in the world. The global market for PET is worth c $100bn (70m tons) according to figures used by Carbios (sourced from Euromonitor) and is growing at a rate of 4% pa. PET is produced by the polymerization of ethylene glycol and terephthalic acid, and is mainly used to make bottles and textile fibres. Although PET is not biodegradable, it is widely recycled (EU recycling rate 52% according to Euromonitor). With a Chinese ban on the importation of plastic waste, there will be increased pressure to deal with plastic waste locally and, given the problems associated with landfill and the incineration of PET (it is not energy efficient and can produce harmful dioxins) alternative approaches will be required.
The process developed by Carbios for the degradation of PET is a biological one (most other techniques rely on chemical processes) and its enzymatic depolymerisation produces purified terephthalic acid (PTA) and monoethylene glycol (MEG), which are the building blocks used to manufacture polyester fibres and PET plastic products. Other degradation techniques produce bis-hydroxyethyl terephthalate monomer (BHET) or dimethyl terephthalate (DMT). Carbios argues that its technology and process offer advantages in terms of cost and ease of handling for PET producers.
Carbios’s solution is a ‘plug-and-play’ unit which can be attached to the front end of any operational plant to break down plastic waste. Carbios believe that its plug-and-play technology cannot be applied to rival processes. The company is currently in contact with PET plant owners, brand owners and enzyme producers regarding the deployment of its technology and remains confident that it will sign additional partnerships. It has already entered in to an agreement with L’Oréal and many brand owners are coming under pressure to make their packaging more environmentally friendly and, as a result, have made significant commitments to reduce the use of plastic, or recycle it. Evian, for example, has a stated ambition of using 100% recyclable plastic by 2025. Unilever has committed to ensure that all of its plastic will be recyclable, reusable or compostable by 2025. Enzyme producers also see the potential of the PET market (c $100bn pa). However, sourcing recyclable plastic, the feedstock in this process, will clearly be central to its success.
Carbios is expected to confirm in May that it will build a demonstration plant (sited in Lyon on the site of the second largest European PVC provider), with a view to the plant being up and running in late 2020 (Q4) or early 2021.
Carbios’s strategy will be to license its process and sell enzymes. Its preferred customers are PET producers, which by necessity are integrated down the chain into a requirement for PTA (a raw material of PET). However, customers could also include PTA producers not downward integrated into PET production. Carbios will aim for its first commercial PET plant in 2023 and will work on the basis of licensing its process at the rate of one plant a year until 2026. From 2027–30, Carbios will aim for two plants a year. The initial plants will be 100–200k tons pa, but will gradually increase in scale to 400k tons pa. Carbios will also consider selling its catalyst to PET producers operating its process through a tolling arrangement with enzyme producers.
The market for the biorecycling of PET remains in its infancy with no dominant market player. Carbios’s competitors include Loop and J-Plan. Loop’s technology breaks down PET into intermediate organic compounds, DMT and MEG, without heat or pressure. Loop has signed a multi-year supply agreement with PepsiCo Inc.
PLA – Carbiolice
Carbiolice was created in September 2016, and is an industrial and commercial joint venture with Bpifrance and Limagrain Céréales Ingrédients (a global seed producer). In the short term, Carbiolice produces corn-based compounds and biopolymers for plastic manufacturers involved in the production of bags/mulching films and derives some revenue from this business. However, in the longer term, Carbiolice will operate its patented enzymatic biodegradation technology (licensed from Carbios) to produce enzymated pellets (in master batch form). PLA is fully bio-sourced plastic, but not biodegradable in normal conditions and requires industrial composting. However, by embedding Carbios’s enzymes into the plastic material, the plastics are able to fully biodegrade over a controlled life span into base molecules. According to Carbios, these base molecules can be assimilated by the micro-organisms in nature but, crucially, the incorporation of its pellets into the plastic material leaves the performance of the polymers unchanged and does not require any modification to the plastic production facilities. Carbios’s technology can be applied to a variety of plastic products, including bags, disposable tableware and food packaging.
The progress towards commercial operation was confirmed in January of this year when Carbios announced that it had signed a multi-year agreement with Novozymes, under the terms of which Novozymes has committed to become a long-term exclusive supplier of Carbios’s proprietary plastic degrading enzymes (Evanesto). At the same time, Carbios confirmed that it expects to receive royalty payments from Carbiolice from 2020. We anticipate that Carbiolice will receive royalty payments of between 3–8% and that it will be entitled to c 30% of Carbiolice’s revenues. Carbiolice will target the global bioplastics market (1,000 tons/year) worth c $1bn and expected to grow by 50% by 2025. Carbiolice will initially operate one industrial plant capable of producing 4,000 tons (increasing to 8,000 tons by 2024) per year of master batch pellets (facilitating a mix of between 60–80,000 tons of PLA per year) and will ultimately target one-third of the market in the EU for soft biodegradable plastics.
Until the commencement of commercial operation, the Carbiolice project is funded by an €18m financing package, including €11m from Bpifrance. The €18m is scheduled to be released in three phases, over four years, on completion of technical and commercial objectives. The three partners of the project invested €4m in 2016 and in July 2018 a second round of financing of €3.35m (€1.1m from Carbios) was put in place. Carbios retains some additional financial commitments to Carbiolice which are milestone dependent (€1.1m in 2019 and €2.3m in 2020). Carbios will also receive R&D collaboration revenues of c €2.5m (over a three-year period), which will help support the industrial development of Carbiolice and serve as an additional source of income for Carbios.
Financials
Short-term financial forecasts are of less importance to Carbios than the long-term success of its technology. However, following the release of the FY18 results, we have updated our forecasts for FY19 and FY20. The changes are modest, reflecting mainly small adjustments to costs. EPS has however been boosted by an increased assumption for tax credits. The principal adjustments can be seen in Exhibit 2.
Exhibit 2: Changes to forecasts for FY19 and FY20
Revenue (€m) |
EPS* (€) |
PBT* (€m) |
|||||||
Old |
New |
% change |
Old |
New |
% change |
Old |
New |
% change |
|
2019e |
1.22 |
1.22 |
N/A |
(0.89) |
(0.74) |
16.9% |
(4.6) |
(4.8) |
N/A |
2020e |
1.40 |
1.60 |
14.3 |
(0.83) |
(0.64) |
22.9% |
(4.8) |
(4.2) |
+12.5% |
Source: Edison Investment Research. Note: *PBT and EPS are normalised, excluding amortisation of acquired intangibles, exceptional items and share-based payments.
Valuation
In the absence of profits, or significant short-term commercial revenues, we continue to consider a DCF based approach to be the best method for providing an indicative valuation. However, we need to add the caveat that the timing and scale of future cash flows remain highly uncertain. Following the release of the FY18 figures, we have updated our DCF. We continue to project cash flows to 2035 assuming a long-term EBIT margin of c 60%. For our central case, we use a discount rate of 15% and a perpetual growth rate of 2%. Under our central case scenario, the valuation remains at €15/share, although this takes no account of the potential impact of the financing of the PET demonstration plant. The sensitivity of our DCF to changes in margin assumption and discount rate can be seen in Exhibit 3.
Exhibit 3: Margin projection scenarios 2022-31 and valuation using a 15% or 20% discount rate
Scenario |
2022 |
2023 |
2024 |
2025 |
2026 |
2027 |
2028 |
2029 |
2030 |
2031 |
15% |
20% |
1 |
20% |
30% |
40% |
50% |
60% |
70% |
80% |
80% |
80% |
80% |
22 |
9 |
2 |
20% |
30% |
40% |
50% |
60% |
70% |
70% |
70% |
70% |
70% |
18 |
8 |
3 |
20% |
30% |
35% |
40% |
45% |
50% |
55% |
60% |
60% |
60% |
15 |
6 |
4 |
20% |
25% |
30% |
35% |
40% |
45% |
50% |
50% |
50% |
50% |
11 |
4 |
5 |
20% |
25% |
30% |
35% |
40% |
40% |
40% |
40% |
40% |
40% |
8 |
3 |
6 |
20% |
25% |
30% |
30% |
30% |
30% |
30% |
30% |
30% |
30% |
5 |
1 |
Source: Edison Investment Research
Exhibit 4: Financial summary
|
|
|
|
|
|
|
|
|||
|
|
|
€m |
2014 |
2015 |
2016 |
2017 |
2018 |
2019e |
2020e |
Year end December |
|
|
IFRS |
IFRS |
IFRS |
IFRS |
IFRS |
IFRS |
IFRS |
|
INCOME STATEMENT |
|
|
|
|
|
|
|
|
|
|
Revenue |
|
|
|
0.66 |
0.84 |
8.87 |
0.98 |
1.08 |
1.22 |
1.60 |
Reported Operating Profit |
|
|
(3.36) |
(4.06) |
3.55 |
(4.65) |
(4.24) |
(4.63) |
(3.99) |
|
Net Interest |
|
|
|
0.05 |
0.08 |
0.08 |
0.02 |
(0.03) |
(0.16) |
(0.16) |
Profit before tax (reported) |
|
|
(3.32) |
(3.98) |
3.63 |
(4.63) |
(4.26) |
(4.79) |
(4.16) |
|
Reported tax |
|
|
|
1.09 |
0.94 |
1.32 |
0.70 |
1.19 |
1.34 |
1.16 |
Profit after tax (reported) |
|
|
(2.23) |
(3.05) |
4.95 |
(3.93) |
(3.07) |
(3.45) |
(3.00) |
|
Extraordinary gain or loss |
|
|
0.02 |
(0.02) |
(0.03) |
(0.01) |
(0.04) |
0.00 |
0.00 |
|
Net income (reported) |
|
|
(2.21) |
(3.07) |
4.92 |
(3.94) |
(3.11) |
(3.45) |
(3.00) |
|
|
|
|
|
|
|
|
|
|
|
|
Basic average number of shares outstanding (m) |
|
3.75 |
3.78 |
3.85 |
4.57 |
4.62 |
4.66 |
4.66 |
||
EPS - basic reported (€) |
|
|
(0.59) |
(0.81) |
1.28 |
(0.86) |
(0.67) |
(0.74) |
(0.64) |
|
Dividend (c) |
|
|
|
0.00 |
0.00 |
0.00 |
0.00 |
0.00 |
0.00 |
0.00 |
|
|
|
|
|
|
|
|
|
|
|
Revenue growth (%) |
|
|
-26.2% |
26.1% |
959.7% |
-88.9% |
10.2% |
12.5% |
31.7% |
|
|
|
|
|
|
|
|
|
|
|
|
BALANCE SHEET |
|
|
|
|
|
|
|
|
|
|
Total Current Liabilities |
|
|
0.67 |
0.91 |
1.17 |
2.26 |
3.40 |
3.11 |
3.04 |
|
Accounts payable |
|
|
0.20 |
0.34 |
0.49 |
1.43 |
1.06 |
0.77 |
0.70 |
|
Other current liabilities |
|
|
0.47 |
0.57 |
0.67 |
0.83 |
2.34 |
2.34 |
2.34 |
|
Total Non-Current Liabilities |
|
1.95 |
3.01 |
3.15 |
3.71 |
3.71 |
8.71 |
13.71 |
||
Debt/Repayable advances |
|
|
1.95 |
3.01 |
3.15 |
3.71 |
3.71 |
8.71 |
13.71 |
|
Total Liabilities |
|
|
2.62 |
3.92 |
4.32 |
5.97 |
7.11 |
11.82 |
16.75 |
|
|
|
|
|
|
|
|
|
|
|
|
Total Shareholders Equity |
|
|
11.12 |
8.13 |
13.11 |
14.55 |
12.04 |
8.58 |
5.58 |
|
Common stock / Capital |
|
|
2.63 |
2.65 |
2.68 |
3.20 |
3.26 |
3.26 |
3.26 |
|
Additional paid-in capital / Share premium |
|
13.65 |
13.70 |
13.74 |
18.59 |
19.13 |
19.13 |
19.13 |
||
Retained earnings |
|
|
(2.96) |
(5.17) |
(8.24) |
(3.32) |
(7.26) |
(10.37) |
(13.82) |
|
Other reserves and surplus |
|
|
(2.21) |
(3.05) |
4.94 |
(3.94) |
(3.10) |
(3.44) |
(2.99) |
|
Total liabilities and equity |
|
|
13.73 |
12.04 |
17.43 |
20.52 |
19.15 |
20.40 |
22.33 |
|
Total assets |
|
|
|
13.73 |
12.04 |
17.43 |
20.52 |
19.15 |
20.40 |
22.34 |
Total current assets |
|
|
12.64 |
10.38 |
6.16 |
9.17 |
6.69 |
5.30 |
4.46 |
|
Cash and cash equivalents |
|
|
11.10 |
9.01 |
3.99 |
7.55 |
5.15 |
4.79 |
3.80 |
|
Accounts receivable |
|
|
1.40 |
1.22 |
1.95 |
1.46 |
1.48 |
0.45 |
0.60 |
|
Inventories |
|
|
|
0.02 |
0.01 |
0.02 |
0.01 |
0.02 |
0.02 |
0.02 |
Prepaid expenses |
|
|
0.12 |
0.13 |
0.22 |
0.15 |
0.04 |
0.04 |
0.04 |
|
Total Non-Current Assets |
|
|
1.09 |
1.67 |
11.27 |
11.35 |
12.46 |
15.10 |
17.88 |
|
Property Plant and equipment, net |
|
0.74 |
1.25 |
1.21 |
1.11 |
0.97 |
1.34 |
1.73 |
||
Other intangible assets |
|
|
0.13 |
0.23 |
0.37 |
0.57 |
0.69 |
0.76 |
0.85 |
|
Other non-current assets |
|
|
0.22 |
0.19 |
9.69 |
9.68 |
10.80 |
13.00 |
15.30 |
|
|
|
|
|
|
|
|
|
|
|
|
CASH FLOW |
|
|
|
|
|
|
|
|
|
|
Cash Flow from Operations |
|
|
|
|
|
|
|
|
|
|
Net income (loss) |
|
|
(2.21) |
(3.07) |
4.92 |
(3.94) |
(3.11) |
(3.45) |
(3.00) |
|
Depreciation and Amortization |
|
|
0.07 |
0.17 |
0.22 |
0.23 |
0.30 |
0.25 |
0.25 |
|
Other items |
|
|
|
(1.36) |
0.39 |
(0.51) |
1.49 |
(0.29) |
0.73 |
(0.21) |
|
|
|
|
(3.50) |
(2.52) |
4.64 |
(2.22) |
(3.08) |
(2.48) |
(2.95) |
Cash Flow from Investing |
|
|
|
|
|
|
|
|
|
|
Purchases of fixed assets |
|
|
(0.85) |
(0.79) |
(0.30) |
(0.33) |
(0.30) |
(0.69) |
(0.73) |
|
Other Investing Activities |
|
|
(0.02) |
0.00 |
(9.53) |
0.02 |
(1.14) |
(2.20) |
(2.30) |
|
Net cash used in investing activities |
|
(0.87) |
(0.79) |
(9.83) |
(0.31) |
(1.44) |
(2.89) |
(3.03) |
||
Cash Flow from Financing |
|
|
|
|
|
|
|
|
|
|
Change in Debt |
|
|
0.15 |
0.07 |
(0.04) |
(0.05) |
1.52 |
5.00 |
5.00 |
|
Change in Capital Stock |
|
|
0.17 |
0.06 |
0.07 |
5.38 |
0.60 |
0.00 |
0.00 |
|
Other Financing Activities |
|
|
0.55 |
1.08 |
0.14 |
0.77 |
0.00 |
0.00 |
0.00 |
|
|
|
|
|
0.87 |
1.22 |
0.17 |
6.09 |
2.12 |
5.00 |
5.00 |
Net Changes in Cash and Cash Equivalent |
|
(3.50) |
(2.09) |
(5.02) |
3.56 |
(2.40) |
(0.36) |
(0.99) |
||
Effect of Exchange Rates On Cash |
|
0.00 |
0.00 |
0.00 |
0.00 |
0.00 |
0.00 |
0.00 |
||
Cash and Cash Equivalents - Beginning |
|
14.60 |
11.10 |
9.01 |
3.99 |
7.55 |
5.15 |
4.79 |
||
Cash and Cash Equivalents - End |
|
11.10 |
9.01 |
3.99 |
7.55 |
5.15 |
4.79 |
3.80 |
||
Source: Carbios, Edison Investment Research.
|
|
Research: TMT
Keywords Studios looks structurally well placed to continue performing well in an industry where change and innovation are the norm. The company again showed the resilience of its model in FY18, delivering 10.1% l-f-l revenue growth and 53% adjusted EPS growth in the face of considerable industry turbulence. Looking ahead, we see sustained growth from the launch of streaming services by industry majors and the continued shift towards outsourcing. Keywords’ strategy, which has delivered a five-year EPS CAGR of 53%, appears sustainable. As such, we believe that the shares remain set for continued appreciation.