Last close As at 05/08/2026
—
— 0.00 (0.00%)
Market capitalisation
—
Research: Energy & Resources
2019 will be an active year for SDX with H119 focused on delivery of first gas at South Disouq, ahead of a return to the drill bit in H219. An eight to nine well programme targets both oil and gas prospectivity in Egypt and appraisal/development locations in Morocco. Drilling activity is expected to be financed through cash flow, undrawn debt ($10m accessible under a reserve-based facility) and an estimated end-FY18 cash position of $15.9m. We expect first gas from South Disouq and increased gas production in Morocco to provide cash flow to support a FY19 capital programme of an estimated US$38m. Our updated risked valuation stands at 99.6p/share (up from 92.7p/share, driven by FX and roll forward of NAV), but we drop our sales and cash flow forecasts for FY19 – a key driver being deferred gas sales in Morocco and a later start-up at South Disouq. Morocco and South Disouq combined make up 67% of our core valuation with contracted sale volumes not levered to the oil price.
Written by
SDX Energy |
South Disouq first gas and H219 drilling |
2019 activity preview |
Oil & gas |
8 January 2019 |
Share price performance
Business description
Next events
Analysts
SDX Energy is a research client of Edison Investment Research Limited |
|||||||||||||||||||||||||||||||||||||||||||||||||
2019 will be an active year for SDX with H119 focused on delivery of first gas at South Disouq, ahead of a return to the drill bit in H219. An eight to nine well programme targets both oil and gas prospectivity in Egypt and appraisal/development locations in Morocco. Drilling activity is expected to be financed through cash flow, undrawn debt ($10m accessible under a reserve-based facility) and an estimated end-FY18 cash position of $15.9m. We expect first gas from South Disouq and increased gas production in Morocco to provide cash flow to support a FY19 capital programme of an estimated US$38m. Our updated risked valuation stands at 99.6p/share (up from 92.7p/share, driven by FX and roll forward of NAV), but we drop our sales and cash flow forecasts for FY19 – a key driver being deferred gas sales in Morocco and a later start-up at South Disouq. Morocco and South Disouq combined make up 67% of our core valuation with contracted sale volumes not levered to the oil price.
Year |
Revenue |
PBT* |
Operating cash |
Net cash |
Capex |
12/16 |
12.9 |
(26.7) |
(1.9) |
4.7 |
(11.9) |
12/17 |
39.2 |
32.8 |
21.6 |
25.8 |
(24.9)** |
12/18e |
53.1 |
12.1 |
31.5 |
15.9 |
(42.6) |
12/19e |
73.3 |
34.2 |
43.5 |
23.0 |
(38.3) |
Note: *PBT is normalised, excluding amortisation of acquired intangibles, exceptional items and share-based payments. **Excludes Circle acquisition ($28.1m).
South Disouq first gas in H119
SDX aims to deliver first gas at South Disouq in H119 on completion of construction activity, well tie-ins and a 10km export pipeline. We expect cash generated from South Disouq gas sales, priced at $2.85/mcf, to provide funds for incremental well inventory beyond the four existing producers across SD-1X and Ibn Yunus.
H219 – a return to exploration
Exploration drilling will focus on Ibn Yunus lookalikes in Egypt, with at least two wells planned for H219. In addition, an upcoming bid round in Egypt could provide SDX with an option to extend its acreage position to include further Kafr el Sheik targets. SDX’s upcoming Egypt work programme will also likely include a test of oil potential at South Disouq through the four-way dip, 50mmbo unrisked Young prospect in H219/2020. In Morocco, SDX has an 87% appraisal/development well success rate based on calibrated 3D seismic and is looking to leverage this success targeting 20bcf of gross unrisked resource in H219/2020. Of the total 12-well programme planned for Morocco, three to four are expected in H219. We include risked exploration/appraisal potential in our valuation.
Valuation: 99.6p/share, 7% increase driven by FX
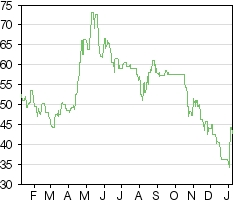
SDX’s share price has fallen alongside the wider UK E&P sector, despite its gas bias. We believe SDX needs to deliver South Disouq and Morocco sales growth in order to provide comfort on short-term cash flow projections. The increase in our valuation is driven by updating FX and rolling forward the NAV to a January 2019 discount date.
2019 activity overview
A key catalyst for SDX shareholders in H119 will be the delivery of first gas at South Disouq, Egypt. This should provide visibility of a return on investment in processing and transportation infrastructure which management expects to total net US$26.5m over 2018 and H119. This spend will provide the basis for the monetisation of incremental gas resource as SDX targets lookalike prospective resource in H219.
After the recent pause in drilling activity, H219 looks to be another active drilling period for SDX with the potential to drive organic growth in both Egypt and Morocco. Drilling is targeting gas prospectivity in proven-basins close to existing discoveries and infrastructure in addition to a more speculative well targeting the Young prospect looking to prove up oil potential mapped on SDX’s Egyptian acreage.
South Disouq first gas in H119
The delivery of first gas at South Disouq in H119 is a key milestone for SDX energy, and a key driver of group production volume and cash flow growth. Gross plateau production at 50–60mmscfd gross (55% SDX working interest) will add c 5.5kboed to group production in H119 (production is estimated at c 4kboed for FY18), at a price of $2.85/mcf, which is low when compared to SDX’s realised prices in Morocco of $10.50/mcf. Our valuation of South Disouq is based on a 100bcf development, with incremental volumes beyond this to be de-risked through further exploration.
|
Exhibit 1: South Disouq production forecasts |
Exhibit 2: South Disouq 100bcf development cash flow forecasts* |
|
|
|
Source: Edison Investment Research |
Source: Edison Investment Research. Note: *Cashflow prior to changes in working capital. |
|
Exhibit 1: South Disouq production forecasts |
|
|
Source: Edison Investment Research |
|
Exhibit 2: South Disouq 100bcf development cash flow forecasts* |
|
|
Source: Edison Investment Research. Note: *Cashflow prior to changes in working capital. |
H219 exploration campaign – incremental volumes
The focus of SDX’s follow-on drilling campaign in Egypt will be Ibn Yunus lookalike prospects, stratigraphic features that are identifiable as amplitude highs on 3D seismic. The mean prospective resource attributable of four worked-up Kafr el Sheik (KES) prospects is estimated at 70bcf unrisked, with at least one prospect to be drilled in H219. As shown in Exhibit 3, amplitude highs indicative of reservoir pay in stratigraphic traps are readily visible on 3D seismic above the Kafr el Sheik, shown as a dark black line.
|
Exhibit 3: South Disouq Kafr el Sheik prospectivity |
|
|
Source: SDX Energy |
In addition to the Kafr el Sheik prospect planned for H219, the company has identified another SD-1X analogue: a four-way dip closure with estimated mean recoverable volume of 17bcf. Our valuation includes five drill-ready prospects (unchanged), which we expect to be drilled over the next 18-24 months, but does not include potential incremental upside, which management estimates at more than 1tcf. Further prospects are likely to be worked up as SDX is currently acquiring an additional 170km2 3D seismic survey on acreage to the south of SD-1X, which should provide detail on Abu Madi and KES potential in the southern end of the block.
South Disouq oil potential – contingent well for H219?
Encouragement for further oil potential can be found in the producing oil fields in the Western Desert, 100km to the west, together with oil shows in four offset wells close to South Disouq. The prolific Western Desert Bahariya and Kharita reservoir sands were encountered at the SD-1X well location; the unlogged Kharita sands showed elevated gas readings, potentially indicating a sign of thermogenic source. Vitrinite reflectance analysis suggests that the Jurassic source rock at South Disouq is present in the oil window and SDX has identified a four-way dip structure with multiple mapped reservoir intervals to test the basin for liquids potential. The 50mmbo mean unrisked (four reservoir intervals) Young prospect is a contingent well that may be drilled in late 2019 or 2020 – we include Young with a 25% geological chance of success in our valuation (risked value of 7.4p/share). The key risks to oil prospectivity at South Disouq are migration and charge.
H219 Morocco exploration campaign
More than 60 leads have been identified across the basin, targeting unrisked potential in excess of 60bcf. The majority of these leads have been derisked by existing or recently acquired 3D seismic data coverage. A 240km2 3D seismic survey (Guebbas 3D) was conducted across the Gharb basin in 2018, with first data expected to be delivered in early 2019.
Should this dataset highlight better targets, up to three wells from the 12-well 2019/20 drilling campaign could be drilled across the area covered by this upcoming survey (these wells will be drilled towards the end of the campaign to ensure sufficient time for seismic interpretation).
We include 12 drill-ready prospects in our valuation, targeting 20bcf of mid-case, unrisked resource (three to four of these wells are likely to be drilled in H219). We view the Sebou/Gharb Centre wells as appraisal/development wells, given the company’s ability to locate gas-bearing sands on calibrated 3D seismic with more than an 80% chance of success. We include this upcoming, 12-well programme and the yet to be tested Lalla Mimouna discoveries in our core value, albeit with an 80% chance of success to reflect the potential for the discovery of some sand packages that fall below the minimum economic threshold for commerciality.
The discovery of thermogenic gas at Lalla Mimouna provides further confidence that deeper oil or gas potential exists in the pre-Nappe. Existing oil discoveries in the onshore Rharb Basin are small and of poor quality in the carbonate/fractured basement reservoir, but SDX would be targeting larger prospects in the Jurassic/Miocene sandstones below the Nappe. Exploration of deeper potential remains at an early stage and we do not include it in our valuation at this point in time.
Gas market development and demand expectations
SDX’s current gas production in Morocco matches the requirements of its current customer base, with existing producing wells being choked back to match demand and ensure prudent reservoir management.
SDX’s current gas customer base is dominated by two large customers: Super Cerame and CMCP, which combined are forecast to consume approximately 6mmscfd of natural gas. Incremental demand is set to come from Peugeot, where test sales began in Q418 alongside a number of ancillary equipment manufacturers including Citic Dicastal (an alloy wheel manufacturer) and Omnium Plastic (a leader in automotive exterior plastics), along with existing local manufacturers such as GPC (paper manufacturer) and Setaxam (food processor) switching from fuel oil to natural gas to fire their burners.
We update our market demand estimates based on company analysis of identified natural gas customers and SDX’s connection goals for 2018. We see a slightly lower rate of gas sales ramp-up in 2019 as customer tie-ins are completed (as per our July 2018 outlook note, we were below company guidance for 2018 at a 6mmscfd sales gas exit rate relative to guidance of 8–10mmscfd), but the underlying demand picture remains robust with Edison forecasting 9.5mmscfd of gas sales in 2019. Demand analysis suggests that piped gas sales have the potential to increase materially over the next two to three years.
Our 2019 demand forecast is based on our analysis of risked projected market demand. Here we use a simplistic approach, applying a 90% chance of success for sales to existing customer Super Cerame’s second plant, a 50% chance of success for new thermal customers and a 10% chance of success for large-scale power plant consumers. Our risked demand profile is shown in Exhibit 5, which implies a 2018 average gas sales rate of just over 6mmscfd, growing to 15mmscfd over the medium term.
Gas sales for FY19 have been deferred relative to our prior forecasts, which are a key driver of our lower sales and cash flow forecasts for FY19 in addition to our lower oil price assumption of $61/bbl Brent (from 71$/bbl Brent). FY19 revenues fall from $86.7m to $73.3m as a result. The NAV impact of this deferment is clearly less material as unsold gas volumes are monetised at a later date in our DCF rather than lost, but continued growth in customer connections, gas sales and adding to behind-pipe reserve is key to supporting our NAV estimate.
We constrain our valuation of SDX’s Moroccan booked gas reserves and contingent resource based on our expectations of market demand, with inclusion of the risk factors mentioned above.
|
Exhibit 4: Morocco risked gas demand forecasts |
Exhibit 5: Key consumers – risked demand |
|
|
|
Source: Edison Investment Research, SDX Energy |
|
Exhibit 4: Morocco risked gas demand forecasts |
|
|
Source: Edison Investment Research, SDX Energy |
|
Exhibit 5: Key consumers – risked demand |
|
|
Source: Edison Investment Research, SDX Energy |
Valuation update
Key changes include a slower sales gas ramp-up in Morocco, aligning our capex forecasts with Q318 reported actuals, rolling forward the discount date to 2019, and a reduction in short-term oil price assumptions, which move to US$71.7/bbl and US$61.0/bbl for 2019. Our long-term oil price assumption remains at US$70.0/bbl Brent (2022).
We note that SDX is relatively insensitive to oil price assumptions, with the bulk of the valuation consisting of gas sales at 5-year fixed contracted prices in Morocco that average $10.5/mcf. Our FX assumption has also changed slightly to US$/£0.78, based on the average of the last six months of 2018.
As a result, we have slightly increased our RENAV from 92.7p/share to 99.6p/share (+7%), with our core value standing at 83.6p/share. We note that our valuation has a significant core value component at 84% of our RENAV.
Exhibit 6: Changes to our valuation
Old (p/share) |
New (p/share) |
Change (%) |
|
Core NAV |
78.8 |
83.6 |
6 |
Development NAV |
3.4 |
4.7 |
30 |
Exploration risked upside |
10.6 |
11.3 |
8 |
Group RENAV |
92.7 |
99.6 |
7 |
Source: Edison Investment Research
A full breakdown of our risked valuation is provided in the table below. We split our valuation between core value, which includes booked 2P reserves, recent discoveries and low-risk development upside in Morocco. We include risked development upside at Meseda and Gemsa and risked exploration potential at South Disouq in our risked exploration NAV (RENAV).
Exhibit 7: SDX Energy detailed valuation
Recoverable reserves |
Net risked value @12.5% |
|||||||||
Asset |
Country |
Diluted WI |
CoS |
Gross |
Net WI |
Net |
NPV |
Absolute |
GBp/ |
C$/ |
% |
% |
mmboe |
mmboe |
mmboe |
$/boe |
$m |
||||
Net (debt)/cash – December 2018e |
100% |
100% |
15.9 |
6.1 |
0.1 |
|||||
SG&A – NPV12.5 of 3 years |
100% |
100% |
(13.0) |
(5.0) |
(0.1) |
|||||
E&A expense for exploration prospects |
100% |
100% |
(14.2) |
(5.4) |
(0.1) |
|||||
NPV of net receivable recovery |
100% |
100% |
16.8 |
6.4 |
0.1 |
|||||
Sebou pipeline residual value (50% cost) |
100% |
100% |
16.4 |
6.2 |
0.1 |
|||||
Production |
||||||||||
Meseda Base + Workovers + Rabul |
Egypt |
50% |
90% |
8.4 |
4.2 |
1.6 |
7.3 |
27.7 |
10.5 |
0.2 |
Gemsa 2P |
Egypt |
50% |
100% |
4.2 |
2.1 |
2.1 |
11.0 |
22.9 |
8.7 |
0.1 |
Sebou 2P volume + discoveries to be booked |
Morocco |
75% |
100% |
0.8 |
0.6 |
0.6 |
37.7 |
23.2 |
8.8 |
0.2 |
Sebou 12-well 2019 programme |
Morocco |
75% |
75% |
5.3 |
4.0 |
4.0 |
31.8 |
94.5 |
35.9 |
0.6 |
South Disouq/Ibn Yunus |
Egypt |
55% |
100% |
17.7 |
9.7 |
9.7 |
3.0 |
29.6 |
11.2 |
0.2 |
Core NAV |
36.4 |
20.6 |
18.0 |
9.6 |
219.8 |
83.6 |
1.4 |
|||
Development upside |
||||||||||
Meseda Waterflood Upside |
Egypt |
50% |
50% |
5.3 |
2.6 |
1.0 |
5.0 |
6.7 |
2.5 |
0.0 |
Gemsa - Edison modelling on full field |
Egypt |
50% |
75% |
1.6 |
0.8 |
0.8 |
9.5 |
5.6 |
2.1 |
0.0 |
Exploration (known) |
||||||||||
Kafr el Sheik prospects x4 |
Egypt |
55% |
27% |
33.6 |
18.5 |
18.5 |
1.6 |
8.0 |
3.0 |
0.1 |
Abu Madi prospect x2 |
Egypt |
55% |
23% |
5.7 |
3.1 |
3.1 |
1.6 |
1.1 |
0.4 |
0.0 |
Young oil prospect |
Egypt |
55% |
19% |
50.0 |
27.5 |
27.5 |
4.0 |
20.6 |
7.8 |
0.1 |
Group RENAV |
132.0 |
73.2 |
68.9 |
261.8 |
99.6 |
1.7 |
||||
Source: Edison Investment Research. Note: Number of shares = 204.7m, FX = US$/£0.78.
The waterfall diagram below shows our valuation relative to the current share price. SDX currently trades at a material discount to our core valuation, and we see potential for a re-rating as the company delivers first gas at South Disouq and continued gas sales ramp up in Morocco, demonstrating the FCF generation potential of these key value components.
|
Exhibit 8: SDX Energy valuation waterfall |
|
|
Source: Edison Investment Research |
Given recent oil price volatility, we provide a valuation sensitivity to our long-term Brent price (from 2022) in the table below. SDX shows relatively low oil price gearing for a UK-listed E&P given that fixed-price gas contracts in Egypt (South Disouq) and Morocco (Sebou) make up c 67% of our core valuation.
Exhibit 9: RENAV sensitivity to long-term Brent crude
WACC (%)/Brent ($/bbl) |
50 |
60 |
70 |
80 |
10.0% |
99 |
103 |
107 |
111 |
12.5% |
92 |
96 |
100 |
103 |
15.0% |
86 |
89 |
93 |
96 |
Source: Edison Investment Research
Financial summary
SDX retains a robust balance sheet with cash and equivalents of $18.7m as of Q318 and no drawn debt. The company has access to up to $10m accessible of its RBL borrowing base, which can be drawn down if required. Forecast cash or net debt at the end of 2019 will be driven by a combination of production start-up at South Disouq, production growth in Morocco and oil prices, as well as phasing of the company’s planned drilling programme. On our base case, we expect SDX to end FY19 with $23.0m of cash, but with a significant range of uncertainty without firm dates for the start-up of South Disouq, timing of Morocco gas sales and management guidance on the FY19 budget.
|
Exhibit 10: Cashflow forecasts and committed capex |
Exhibit 11: Group production expectations |
|
|
|
Source: Edison Investment Research |
|
Exhibit 10: Cashflow forecasts and committed capex |
|
|
Source: Edison Investment Research |
|
Exhibit 11: Group production expectations |
|
|
Source: Edison Investment Research |
Exhibit 12: Financial summary
Accounts: IFRS, Yr end: December, USD: Thousands |
|
2014 |
2015 |
2016 |
2017 |
2018e |
2019e |
2020e |
|
Total revenues |
|
|
24,533 |
11,372 |
12,914 |
39,166 |
53,116 |
73,270 |
86,742 |
Cost of sales |
|
|
(5,241) |
(7,030) |
(8,548) |
(28,078) |
(27,216) |
(34,180) |
(34,318) |
Gross profit |
|
|
19,292 |
4,342 |
4,366 |
11,088 |
25,900 |
39,090 |
52,425 |
SG&A (expenses) |
|
|
(2,898) |
(4,770) |
(3,679) |
(8,793) |
(5,500) |
(5,775) |
(6,064) |
Other income/(expense) |
|
|
1,130 |
1,021 |
1,701 |
1,820 |
1,186 |
1,914 |
1,526 |
Exceptionals and adjustments |
|
(3,831) |
(7,676) |
(29,089) |
(725) |
(9,500) |
(1,000) |
(1,000) |
|
Depreciation and amortisation |
|
|
(1,602) |
(2,057) |
(3,266) |
(17,824) |
(13,153) |
(15,960) |
(17,690) |
Reported EBIT |
|
|
13,693 |
(7,083) |
(26,701) |
3,390 |
12,086 |
34,229 |
46,888 |
Finance income/(expense) |
|
|
(1,009) |
(96) |
4 |
(129) |
0 |
0 |
0 |
Other income/(expense) |
|
|
0 |
18,289 |
0 |
29,558 |
0 |
0 |
0 |
Exceptionals and adjustments |
|
0 |
0 |
0 |
0 |
0 |
0 |
0 |
|
Reported PBT |
|
|
12,684 |
11,110 |
(26,697) |
32,819 |
12,086 |
34,229 |
46,888 |
Income tax expense (includes exceptionals) |
|
|
(4,328) |
(1,063) |
(1,503) |
(4,541) |
(5,785) |
(2,300) |
(2,319) |
Reported net income |
|
|
8,356 |
10,047 |
(28,200) |
28,278 |
6,302 |
31,929 |
44,569 |
Shares at end of period - basic |
|
|
376 |
38 |
80 |
204 |
205 |
205 |
205 |
|
|
|
|
|
|
|
|
|
|
Balance sheet |
|
|
|
|
|
|
|
|
|
Property, plant and equipment |
|
|
9,392 |
18,401 |
12,605 |
54,445 |
76,910 |
93,446 |
93,465 |
Goodwill |
|
|
0 |
0 |
0 |
0 |
0 |
0 |
0 |
Intangible assets |
|
|
16,460 |
23,473 |
10,623 |
15,231 |
13,700 |
19,521 |
22,693 |
Other non-current assets |
|
|
1,999 |
2,106 |
2,503 |
2,724 |
2,724 |
2,724 |
2,724 |
Total non-current assets |
|
|
27,851 |
43,980 |
25,731 |
72,400 |
93,334 |
115,691 |
118,881 |
Cash and equivalents |
|
|
17,935 |
8,170 |
4,725 |
25,844 |
15,946 |
23,025 |
69,971 |
Inventories |
|
|
0 |
1,188 |
1,698 |
5,157 |
4,999 |
6,278 |
6,303 |
Trade and other receivables |
|
|
3,306 |
6,678 |
9,463 |
37,656 |
28,242 |
29,094 |
23,275 |
Other current assets |
|
|
0 |
0 |
0 |
0 |
0 |
0 |
0 |
Total current assets |
|
|
21,241 |
16,036 |
15,886 |
68,657 |
49,187 |
58,397 |
99,549 |
Non-current loans and borrowings |
|
|
0 |
0 |
0 |
0 |
0 |
0 |
0 |
Other non-current liabilities |
|
|
608 |
286 |
290 |
4,506 |
4,506 |
4,506 |
4,506 |
Total non-current liabilities |
|
|
608 |
286 |
290 |
4,506 |
4,506 |
4,506 |
4,506 |
Trade and other payables |
|
|
1,686 |
3,556 |
3,674 |
19,459 |
13,621 |
12,259 |
11,033 |
Current loans and borrowings |
|
|
2,207 |
0 |
0 |
0 |
0 |
0 |
0 |
Other current liabilities |
|
|
5,142 |
928 |
389 |
2,473 |
2,473 |
2,473 |
2,473 |
Total current liabilities |
|
|
9,035 |
4,484 |
4,063 |
21,932 |
16,094 |
14,732 |
13,506 |
Equity attributable to company |
|
|
39,449 |
55,246 |
37,264 |
114,619 |
121,921 |
154,849 |
200,418 |
Non-controlling interest |
|
|
0 |
0 |
0 |
0 |
0 |
0 |
0 |
|
|
|
|
|
|
|
|
|
|
Cashflow statement |
|
|
|
|
|
|
|
|
|
Profit before tax |
|
|
12,684 |
11,110 |
(26,697) |
32,819 |
12,086 |
34,229 |
46,888 |
Net finance expenses |
|
|
0 |
0 |
0 |
0 |
0 |
0 |
0 |
Depreciation and amortisation |
|
|
1,602 |
2,057 |
3,266 |
17,824 |
13,153 |
15,960 |
17,690 |
Share based payments |
|
|
1,064 |
761 |
(47) |
538 |
1,000 |
1,000 |
1,000 |
Other adjustments |
|
|
1,670 |
(12,281) |
25,742 |
(34,613) |
7,314 |
(1,914) |
(1,526) |
Movements in working capital |
|
|
12,941 |
(2,183) |
(3,440) |
5,412 |
3,735 |
(3,493) |
4,568 |
Interest paid / received |
|
|
0 |
0 |
0 |
0 |
0 |
0 |
0 |
Income taxes paid |
|
|
(4,430) |
(4,678) |
(766) |
(364) |
(5,785) |
(2,300) |
(2,319) |
Cash from operations (CFO) |
|
|
25,531 |
(5,214) |
(1,942) |
21,616 |
31,503 |
43,482 |
66,300 |
Capex |
|
|
(13,634) |
(5,120) |
(11,890) |
(24,917) |
(42,588) |
(38,317) |
(20,881) |
Acquisitions & disposals net |
|
|
0 |
0 |
0 |
(24,948) |
0 |
0 |
0 |
Other investing activities |
|
|
1,110 |
4,836 |
825 |
760 |
1,186 |
1,914 |
1,526 |
Cash used in investing activities (CFIA) |
|
(12,524) |
(284) |
(11,065) |
(49,105) |
(41,401) |
(36,403) |
(19,354) |
|
Net proceeds from issue of shares |
|
|
0 |
0 |
10,127 |
48,510 |
0 |
0 |
0 |
Movements in debt |
|
|
0 |
(3,702) |
(96) |
(43) |
0 |
0 |
0 |
Other financing activities |
|
|
0 |
0 |
0 |
0 |
0 |
0 |
0 |
Cash from financing activities (CFF) |
|
|
0 |
(3,702) |
10,031 |
48,467 |
0 |
0 |
0 |
Increase/(decrease) in cash and equivalents |
|
|
13,007 |
(9,200) |
(2,976) |
20,978 |
(9,898) |
7,079 |
46,946 |
Currency translation differences and other |
|
|
(615) |
(565) |
(469) |
141 |
0 |
0 |
0 |
Cash and equivalents at end of period |
|
17,935 |
8,170 |
4,725 |
25,844 |
15,946 |
23,025 |
69,971 |
|
Net (debt) cash start of period |
|
|
15,728 |
8,170 |
4,725 |
25,844 |
15,946 |
23,025 |
69,971 |
Movement in net (debt) cash over period |
|
|
12,392 |
(7,558) |
(3,445) |
21,119 |
(9,898) |
7,079 |
46,946 |
Source: Company accounts, Edison Investment Research
|
|
Research: Industrials
Carr’s trading update for the first 18 weeks of FY19 indicates that both divisions are performing well. As the group is trading in line with management’s expectations for the full year, we leave our estimates and indicative valuation of 182p/share unchanged.