bp plc is a client of Edison Group. Edison Group produced and distributed this content. Edison Group does not hold any position in bp plc.
In two previous pieces of analysis (which you can find here and here ), we have examined the drivers of bp’s cash flow. We now turn to a deep-dive analysis of the distribution framework itself.
This final analysis dissects the mechanics of bp’s dividend and buyback program. We will examine the potential resilience of the dividend, the expected scale of buyback and the crucial role of the company’s capital frame. Crucially, we will also assess tangible, recent performance data to validate whether the plan is being successfully executed, before considering the key risks an investor must weigh up for a final portfolio decision.
The shareholder return framework: By the numbers
bp’s stated shareholder returns expectations is defined by a clear, quantitative framework, announced in February 2025.
- Total shareholder distribution: a stated expectation to return 30–40% of operating cash flow to shareholders over time (subject to board approval), delivered through a combination of dividends and share buybacks.
- Dividend: the expectation of an annual increase in the dividend per ordinary share of at least 4%, subject to board approval. Based on current consensus estimates for FY26, this policy supports a dividend yield of approximately 6%, which is higher than the peer average.
- Buyback program: a commitment to use share buybacks to distribute excess cash. A $750m buyback was announced for the third quarter of 2025.
Analyzing the dividend’s resilience
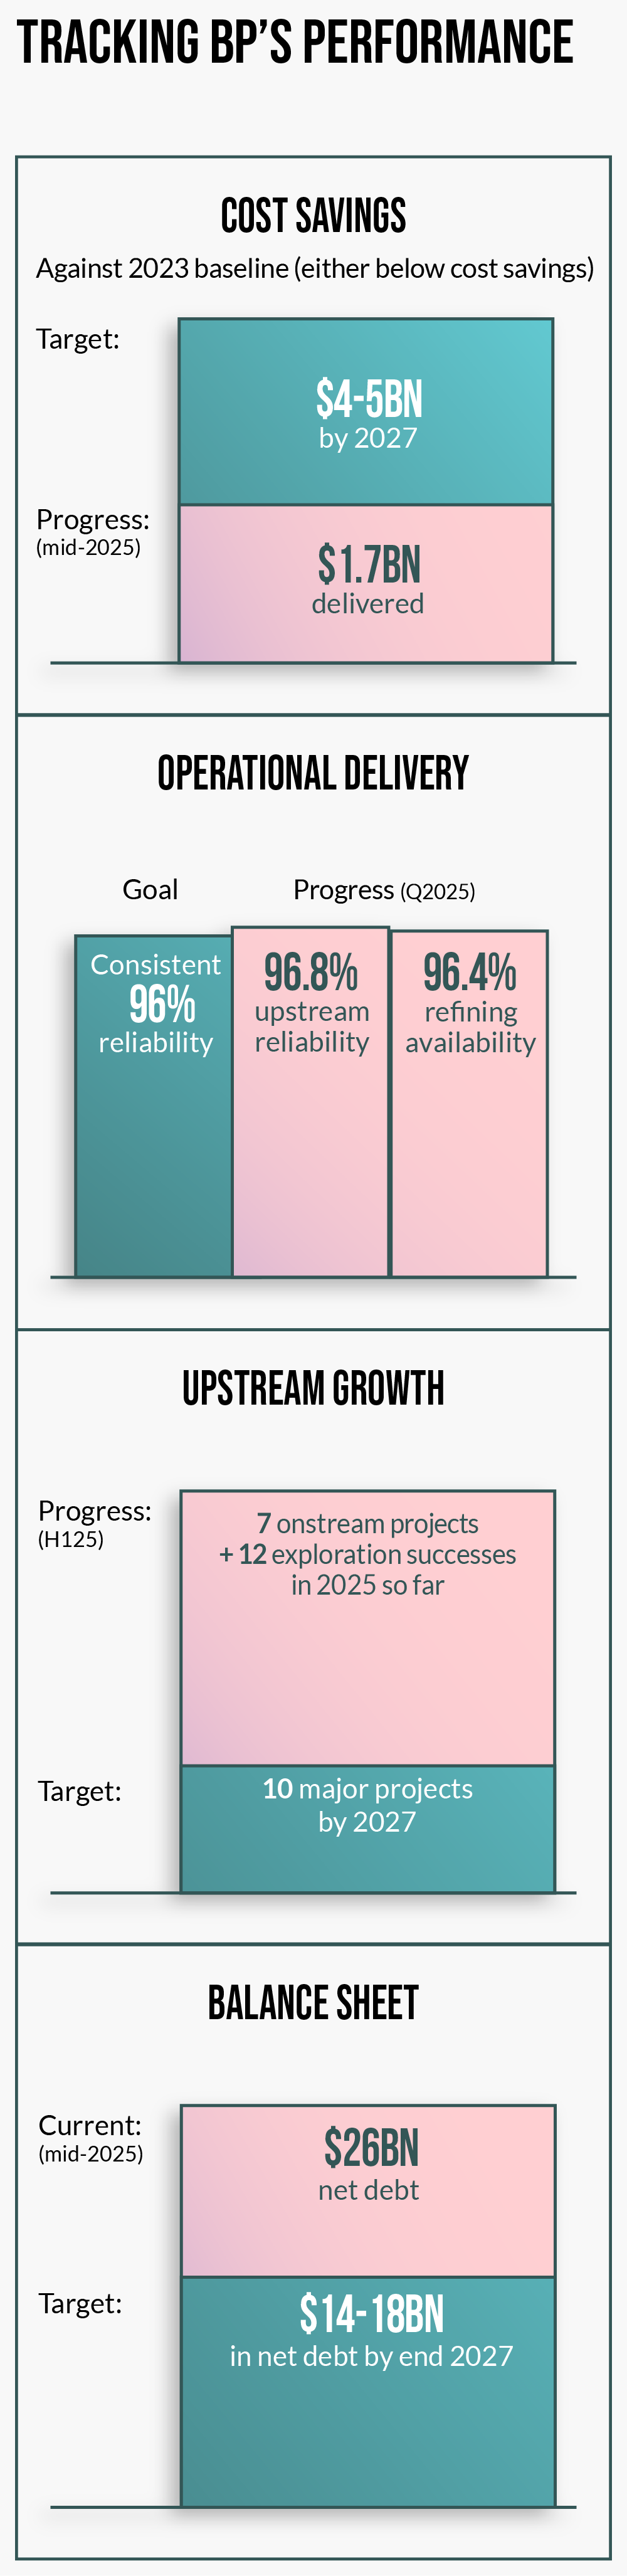
Shareholder distributions are only as resilient as the balance sheet that supports it. A key component of our analysis is bp’s plan to de-risk its financial foundation. The company has set a primary target to reduce net debt to a range of $14–18bn by the end of 2027, down from $26.0bn in mid-2025. This planned deleveraging is designed to be achieved primarily through a $20bn divestment program.
This program includes the strategic review of Castrol and the introduction of a partner into Lightsource bp, with proceeds from these specific transactions earmarked for debt reduction. A successful execution of this plan would create a more robust balance sheet, lowering financing costs and providing a crucial safety buffer for the dividend, thereby increasing its durability through the inherent volatility of commodity cycles.
The buyback program: A quantitative look
While the dividend provides a baseline for income, the buyback program offers significant upside and enhances per-share metrics. To understand its potential scale, we can create an illustrative model based on bp’s cash flow growth targets.
The company is targeting approximately $5.5–6.0bn in additional operating cash flow growth between 2024 and 2027. This growth is projected to come from two main sources: c $2bn from the upstream business and $3.5–4.0bn from the downstream business.
Achieving this would materially increase the total operating cash flow available for distribution. Applying the 30–40% distribution expectation to this larger cash flow base implies a capacity for a multi-billion-dollar annual cash return to shareholders.
It is critical to note that this is an illustrative model based on company targets, not a forecast. However, it demonstrates that if bp delivers on its operational plans, the buyback program has the potential to be a substantial tool for returning value and driving earnings per share growth through a reduced share count.
The need for a disciplined capital frame
The credibility of the shareholder return framework is directly linked to the company’s capital discipline. bp has updated its capital expenditure to a frame of $13–15bn annually for 2026–27. This is a reduction from the 2025 guidance of around $15bn and a clear drive towards capital efficiency.
This capex ceiling is a critical enabler. The reduction is primarily achieved by significantly lowering spend on transition businesses to $1.5–2.0bn per year, while simultaneously increasing investment in the higher-returning oil and gas business to approximately $10bn per year. By capping overall investment and reallocating it to the most cash-generative projects, a larger portion of the company’s growing operating cash flow is unlocked. This cash surplus is then available to service the dividend, fund the buyback program and pay down debt, which will structurally protect the shareholder return commitment.
Recent performance: Early proof points of delivery
The credibility of a plan is best measured by its execution. An analysis of bp’s most recent financial results from Q325 provides tangible, near-term validation that key elements of the strategy have started to be delivered:
- Operational achievements: the downstream cash flow improvements are predicated on achieving 96% refining availability. The Q325 results suggest bp is already delivering on this, reporting 96.6% availability for the quarter, alongside 96.8% reliability in the upstream business.
- The upstream growth engine: in the first half of 2025, bp brought seven major oil and gas projects onstream, demonstrating progress in advancing the project pipeline that underpins future cash flows.
- Cost reductions are on schedule: as of mid-2025, the company has already delivered $1.7bn in structural cost reductions against its 2023 baseline, indicating that the program is on track to meet its $4–5bn target.
Key risks to the framework
While recent performance provides positive indicators, risks remain:
- Execution risk: the targets are ambitious. The bear case centers on the risk of slippage in delivering the remainder of the cost reduction program and maintaining project timelines.
- Market risk: the framework’s capacity is sensitive to commodity prices. The targets are based on a reference price of approximately $74/bbl Brent in 2027. A sustained period of significantly lower prices would put pressure on the cash flow available for buybacks.
In conclusion
This analysis confirms that bp has established a multi-faceted framework for delivering shareholder returns. The case to have faith in management’s ability to deliver is not based on a single factor, but on an interconnected system: a resilient dividend policy is supported by a deleveraging plan; a substantial buyback program is funded by targeted cash flow growth; and both are protected by a disciplined capital frame.
Crucially, this forward-looking plan is now supported by tangible evidence of delivery from the company’s most recent results. While an investment decision must weigh up the remaining execution and market risks, our analysis concludes that bp has provided a clear and credible, data-driven case for investors seeking consistent and growing income.
Forward-looking targets are based on current expectations and planning assumptions. Actual results may differ materially based on various factors including but not limited to commodity prices, operational performance, regulatory changes, and global economic conditions.
Shareholder distributions, including dividends and share buybacks, are subject to the discretion of the board and may vary based on factors including, but not limited to commodity prices, cash flow generation, balance sheet considerations, and general business conditions. Past distributions are not indicative of future distributions.