Last close As at 06/08/2026
—
— 0.00 (0.00%)
Market capitalisation
—
Research: Financials
Flatex reported FY19 of earnings €14.9m (-15% y-o-y) and a ROE of 8.6%. Lower market volatility affected the results, as did the costs of expansion into the Dutch market before the decision to acquire 100% of DEGIRO in December 2019 for €60m cash plus €190m in shares. The EBITDA margin was 28.5%, down 16.8% y-o-y. The friendly acquisition of DEGIRO is transformational, with greater scale and breath of products. Management has identified €30m in annual synergies. The deal will make Flatex Europe’s largest retail online broker, present in 18 countries, although it is still awaiting regulatory approval. Although the share price has almost doubled since the announcement of the DEGIRO acquisition, the shares trade at a discount to peers on both P/E and EV/EBIT despite consensus forecasts of above-average growth.
Written by
Flatex |
Waiting for the regulatory go-ahead
Financial services |
Scale research report - Update
23 June 2020 |
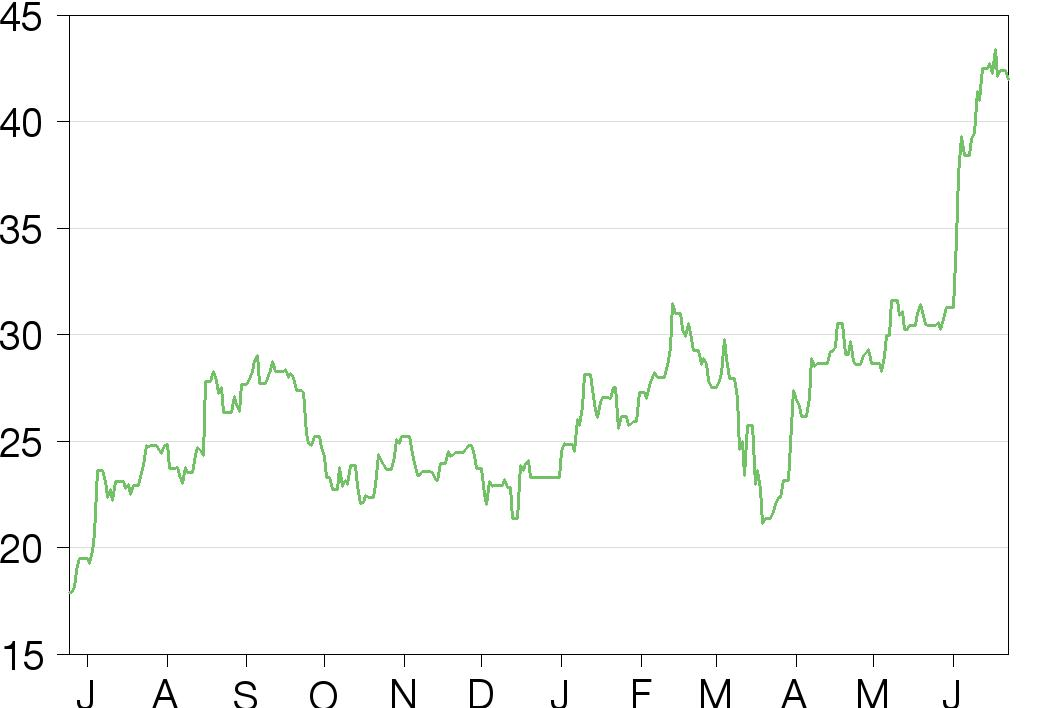
Share price graph
Share details
Business description
Bull
Bear
Analyst
|
Flatex reported FY19 of earnings €14.9m (-15% y-o-y) and a ROE of 8.6%. Lower market volatility affected the results, as did the costs of expansion into the Dutch market before the decision to acquire 100% of DEGIRO in December 2019 for €60m cash plus €190m in shares. The EBITDA margin was 28.5%, down 16.8% y-o-y. The friendly acquisition of DEGIRO is transformational, with greater scale and breath of products. Management has identified €30m in annual synergies. The deal will make Flatex Europe’s largest retail online broker, present in 18 countries, although it is still awaiting regulatory approval. Although the share price has almost doubled since the announcement of the DEGIRO acquisition, the shares trade at a discount to peers on both P/E and EV/EBIT despite consensus forecasts of above-average growth.
FY19: A mixed bag
Revenue was up 5.5% y-o-y, but the EBITDA margin of 28.5% was below >33.9% guidance. However, excluding one-off Dutch market entry costs it would have been 35%. Retail customers grew 27% y-o-y, ahead of expectations. Transaction volume declined by 1% as trading in lower-margin CFD and FX fell. However, trading in higher-margin products, such as ETP, is growing and financial (FIN) division revenue grew 5%. Financial debt was €81.5m (45% of equity) after paying €23.5m for an initial 9.4% DEGIRO stake. EBITDA was €37.6m and financial expenses only €3.1m. Adding the DEGIRO acquisition pro-forma results in debt of €118m, EBITDA of €51m and a debt to equity ratio of 56%, so debt levels would remain moderate.
DEGIRO merger transformational
The acquisition of DEGIRO, a Dutch pan-European online broker, would give Flatex greater scale and geographic presence, a proprietary trading engine and a broader product line. DEGIRO is a streamlined operation with a low-cost service centre in Sofia, Bulgaria. Based on FY19 pro-forma numbers, the combined entity would have 45% greater revenue and 34% more EBITDA and more than double the number of clients and transactions.
Valuation: Discount for premium growth
Flatex is trading on a P/E of 24.2x for FY20 and 17.6x for FY21 on consensus forecasts. Both its P/E and EV/EBIT ratios are at a discount to its B2B and B2C peer average despite consensus forecasting above-average growth. The acquisition’s regulatory approval could be a short-term catalyst for the share price.
|
Consensus estimates
Source: Flatex, Refinitiv |
Edison Investment Research provides qualitative research coverage on companies in the Deutsche Börse Scale segment in accordance with section 36 subsection 3 of the General Terms and Conditions of Deutsche Börse AG for the Regulated Unofficial Market (Freiverkehr) on Frankfurter Wertpapierbörse (as of 1 March 2017). Two to three research reports will be produced per year. Research reports do not contain Edison analyst financial forecasts.
FY19 results
Flatex reported FY19 of earnings €14.9m, down 15% y-o-y, and revenue of €132m, up 5.5% y-o-y. Reported EBITDA was €37.6m, down 11% y-o-y. The EBITDA margin was 28.5%, which is below management guidance of over 34%. Management blamed the costs of the expansion into the Dutch market, before the decision to acquire DEGIRO in December. Management estimates the EBITDA margin would have otherwise been 35%. In its presentation on the merger with DEGIRO in December 2019, management used an estimated FY19 EBITDA figure of €40m.
Flatex purchased an initial 9.4% stake (for €23.5m cash) in DEGIRO in December 2019 as a first step in the purchase of 100% of the company. Therefore, operationally there is no real impact from the DEGIRO announcement on the FY19 income statement.
The FIN division grew 5.3% while the technology (TECH) division fell 8.8% y-o-y. Consolidation effects and other revenue led to the higher revenue growth numbers, so the underlying segments’ growth is higher than the stand-alone figures.
Transaction volume fell 2% y-o-y, mainly due to reduced volume from lower margin contract for a difference (CFD, a form of derivative trading) and foreign exchange (FX) products. This FX and CFD volume decline is expected following the agreement in which Commerzbank took over Flatex’s CFD order flow execution as market marker. We also note that since 2017, the Federal Financial Supervisory Authority and the European Financial Supervisory Authority has gradually restricted CFD and FX trading. Flatex’s revenue growth is being delivered from higher-margin products, especially ETP, and it is encouraging to see that H219 total transaction volume grew 14% y-o-y despite the lower CFD/FX volume. We also note that market volatility (a key driver for revenue) was lower in FY19 than FY18.
Exhibit 1: Key performance indicators
Business volumes |
FY16 |
FY17 |
FY18 |
FY19 |
Transactions executed (000s) |
10,462 |
11,272 |
12,483 |
12,274 |
Number of retail customers (000s) |
212 |
254 |
290 |
368 |
Transactions per customer per year |
49.3 |
44.4 |
43.0 |
33.3 |
Customer assets under management (€m) |
10,855 |
11,794 |
10,995 |
14,586 |
of which: securities account volume |
9,512 |
10,910 |
10,000 |
13,600 |
of which: deposits account volume |
1,343 |
884 |
995 |
986 |
Year-on-year (%) |
||||
Transactions executed |
3 |
8 |
11 |
(2) |
Number of retail customers |
20 |
20 |
14 |
27 |
Transactions per customer per year |
(14) |
(10) |
(3) |
(22) |
Customer assets under management |
88 |
9 |
(7) |
33 |
Source: Flatex
The TECH division has been supporting the market entry of the online broker into the Netherlands. This included IT and expanding the production line. Basic modules were also created for other European markets. The company also highlighted progress in its cloud enterprise resource planning solutions and that its partnership with SAP was expanded to include a reselling component. This allows its core banking system (FTX:CBS) to be combined with SAP in a simpler, more integrated manner from a single source. The advanced stage of several contracts also helped boost results. The TECH division achieved a 45.2% EBITDA margin, which compares favourably to the management forecast of ‘more than 35.3%’.
The number of retail customers grew an impressive 27% to 368,000; management had forecast more than 320,000. Besides organic growth in core markets, this also reflected the successful expansion in the Netherlands in FY19. Customer assets under management grew 33% to €14.6bn, helped by favourable financial markets.
Exhibit 2: Income summary with segments
€ 000s |
FY17 |
FY18 |
FY19 |
FY19/18 |
|
FIN |
|||||
Revenues |
89,113 |
107,140 |
112,767 |
5.3% |
|
Raw materials and consumables used |
(28,688) |
(44,517) |
(45,465) |
2.1% |
|
Personnel expenses |
(15,353) |
(17,274) |
(21,294) |
23.3% |
|
Other administrative expenses |
(25,206) |
(17,001) |
(24,798) |
45.9% |
|
EBITDA |
19,866 |
28,348 |
21,209 |
-25.2% |
|
EBITDA margin % |
22.3% |
26.5% |
18.8% |
||
TECH |
|||||
Revenues |
30,642 |
39,730 |
36,230 |
-8.8% |
|
Raw materials and consumables used |
(3,937) |
(5,462) |
(5,608) |
2.7% |
|
Personnel expenses |
(2,702) |
(9,470) |
(8,018) |
-15.3% |
|
Other administrative expenses |
(3,050) |
(10,779) |
(6,234) |
-42.2% |
|
EBITDA |
20,952 |
14,018 |
16,370 |
16.8% |
|
EBITDA margin % |
68.4% |
35.3% |
45.2% |
||
Other/consolidation effects |
|||||
Revenues |
(12,742) |
(21,770) |
(17,045) |
-21.7% |
|
Raw materials and consumables used |
1,640 |
13,132 |
12,901 |
-1.8% |
|
Personnel expenses |
(5,088) |
4,830 |
3,904 |
-19.2% |
|
Other administrative expenses |
7,445 |
3,808 |
241 |
-93.7% |
|
EBITDA |
(8,744) |
0 |
0 |
||
TOTAL |
|||||
Revenues |
107,013 |
125,100 |
131,952 |
5.5% |
|
Raw materials and consumables used |
(30,985) |
(36,847) |
(38,172) |
3.6% |
|
Personnel expenses |
(23,143) |
(21,914) |
(25,409) |
15.9% |
|
Other administrative expenses |
(20,811) |
(23,972) |
(30,791) |
28.4% |
|
EBITDA |
32,074 |
42,368 |
37,580 |
-11.3% |
|
EBITDA margin % |
30.0% |
33.9% |
28.5% |
||
Depreciation and amortisation |
(5,590) |
(8,180) |
(12,829) |
56.8% |
|
Derecognition of financial assets* |
0 |
(3,570) |
0 |
||
EBIT |
26,484 |
30,618 |
24,751 |
-19.2% |
|
Financial results |
(1,288) |
(2,179) |
(3,123) |
43.3% |
|
EBT |
25,196 |
28,439 |
21,628 |
-23.9% |
|
Income tax expense |
(8,179) |
(10,965) |
(6,720) |
-38.7% |
|
Tax rate |
32.5% |
38.6% |
31.1% |
||
Earnings from continuing activities |
17,017 |
17,473 |
14,908 |
-14.7% |
|
Earnings from discontinued operations |
(220) |
0 |
0 |
||
Consolidated net profit |
16,797 |
17,473 |
14,908 |
-14.7% |
|
Source: Flatex. Note: *There was a write-down adjustment of €3.57m retrospective write-down of financial assets adjustment on FY18 figures. This reduces the reported FY18 earnings from €21m to €17.5m and the EPS from €1.12 to €0.98.
Volatility drives record Q120
Financial market volatility has been very high this year since the COVID-19 pandemic began. The economic uncertainty caused by the countering measures to control the disease has affected markets and volatility is a good thing for brokers. In April 2020, Flatex announced that more than 17m transactions (+130% y-o-y) had been executed in Q120 for Flatex and DEGIRO on a pro forma basis. There were more than 170,000 new customers in Q120, +324% versus Q119. The company disclosed that the pre-tax profit in Q120 of Flatex alone was greater than it was for FY19 (€21.6m).
We would caution that these volumes are extraordinary and are likely to come down when the market turbulence subsides.
DEGIRO purchase is transformational
Flatex’s DEGIRO purchase allows it greater scale, greater geographic presence, a proprietary trading engine and a broader product line. DEGIRO is a streamlined operation with a low-cost service centre in Sofia, Bulgaria and a wide presence across Europe.
The deal was announced on 13 December 2019 and is good for 100% of shares at a total price of €250m. The offer is €60m in cash and €190m in Flatex shares. The shares are priced at €25.33 each and 7.5m new shares will be issued. Flatex shares had been trading between €22 and €25 in the run-up to the announcement. The acquisition is fully supported by DEGIRO management and Flatex took a 9.4% initial stake paid in cash (€23.5m) in December 2019.
Approval by the regulatory authorities is yet to be finalised. The original expectation had been for a decision in Q220.
Flatex hired Lazard in mid-2019 to evaluate the strategic options of the business. At the time, it was explained to the market that the path taken could involve mergers, acquisitions, partnerships, new shareholders and even a possible sale of the company.
In its statements after the deal was announced, Flatex management stated it ‘realised that size, scaling, customer orientation and internationality are key success factors. We want to actively participate in the consolidation given our financial strength and to continue being in the driver seat. For our stakeholders, we consider inorganic growth to be significantly value creating’.
Flatex’s market share in its home market of Germany is already a dominant 50% with 25% in Austria. Although its expansion into the Netherlands was going well and Spain was lined up next, this acquisition allows a much quicker approach to scaling up aside from the other benefits from the acquisition.
Exhibit 3: 2019 pro-forma Flatex with DEGIRO combined
€m |
Flatex |
DEGIRO (est) |
Combined |
Mid-term ambition |
Revenue |
132 |
60 |
192 |
300 |
EBITDA |
37.6 |
13.7 |
51 |
150 |
Net profit |
15 |
10 |
25 |
|
Equity |
182 |
26 |
208 |
|
Brokerage clients (000s) |
368 |
470 |
838 |
|
Transactions (m), B2C only |
11.2 |
18.6 |
29.8 |
|
EPS (€) |
3.0 |
Source: Flatex
The acquisition allows Flatex to become the largest pan-European retail broker with a presence in 18 European counties and with the full value chain in-house.
The more than €30m annual synergies identified by the company are broken down as follows: flow-related (€15–20m); IT savings (€10–15m); single corporate structure (€3–5m); and greater scale, such as marketing and bargaining power (€3–5m).
Debt levels remain moderate after acquisition
Flatex’s balance sheet remains healthy, with moderate year-end debt of €81.5m. This is equivalent to 45% of equity, similar to FY18 (42%) and considerably below 75% in FY17.
If the regulators approve the deal (which we believe is likely), there is €36.5m to be paid in cash for the DEGIRO acquisition (the rest will be in shares). The deal with DEGIRO is being carried out on a net debt-free basis. Adding €36.5m to the existing debt and divide by the pro-forma combined equity FY19 of Flatex with DEGIRO (€212m) is equivalent to a debt to equity ratio of 56%. The pro-forma combined FY19 EBITDA of €51m makes the pro-forma debt level of €118m look very comfortable indeed.
The cash flow shown is driven greatly by changes in customer cash deposits in Flatex’s banking operations. These are customer cash balances and therefore not a significant indicator of available cash. We have shown the debt position to give a better idea of gearing. The company had a free liquidity position of €29.9m after the December payment for the 9.4% stake in DEGIRO.
Exhibit 4: Balance sheet and cash flow
Balance sheet (€000s) |
FY16 |
FY17 |
FY18 |
FY19 |
Intangible assets |
57,339 |
62,953 |
82,664 |
92,722 |
Other |
21,550 |
34,420 |
49,829 |
86,978 |
Total non current assets |
78,889 |
97,373 |
132,493 |
179,700 |
Financial assets at FVOCI |
514,335 |
177,517 |
57,374 |
61,547 |
Financial assets at FVPL |
1,234 |
1,006 |
893 |
214 |
Cash loans due to local authorities |
401,171 |
237,165 |
18,900 |
14,056 |
Current loans due to customers* |
122,472 |
175,415 |
213,675 |
362,552 |
Equity instruments FVOCI-EK |
82,465 |
68,644 |
||
Equity instruments FVPL-EK |
0 |
66,049 |
||
Other receivables due to banks |
12,328 |
12,610 |
40,466 |
31,239 |
Cash |
389,202 |
397,002 |
655,046 |
468,616 |
Other |
13,905 |
8,962 |
22,857 |
13,345 |
Assets from discontinued operations |
459 |
383 |
0 |
0 |
Total current assets |
1,454,647 |
1,009,677 |
1,091,676 |
1,086,262 |
Total assets |
1,533,995 |
1,107,433 |
1,224,169 |
1,265,962 |
Financial |
2,875 |
16,040 |
9,874 |
3,727 |
Other |
11,933 |
13,352 |
20,521 |
34,983 |
Total non-current liabilities |
14,808 |
29,392 |
30,395 |
38,710 |
Liabilities to customers |
1,339,845 |
885,112 |
955,489 |
950,777 |
Liabilities to banks |
60,275 |
61,010 |
57,259 |
71,694 |
Other financial liabilities |
3,813 |
7,463 |
2,219 |
6,131 |
Other |
24,624 |
11,732 |
15,151 |
16,449 |
Total current liabilities |
1,428,557 |
965,317 |
1,030,118 |
1,045,051 |
Total liabilities |
1,443,365 |
994,709 |
1,060,513 |
1,083,761 |
Equity |
90,630 |
112,724 |
163,656 |
182,202 |
Total financial liabilities |
66,963 |
84,513 |
69,352 |
81,552 |
Cash flow |
FY17 |
FY18 |
FY19 |
|
Cash flow operations - before banking |
23,729 |
17,536 |
49,427 |
|
Cash flow from banking operations |
-23,473 |
232,535 |
-206,673 |
|
Cash flow from operations |
112 |
250,071 |
-157,246 |
|
Cash flow from investments |
(12,587) |
(27,756) |
(33,189) |
|
Cash flow from financing |
20,273 |
32,160 |
4,005 |
|
Net cash flow |
7,799 |
254,475 |
(186,430) |
|
Cash and cash equivalent beg of year |
389,202 |
397,002 |
655,046 |
|
Cash and cash equivalent end of year |
397,002 |
655,046 |
468,616 |
Source: Flatex
Valuation
Flatex’s share price has almost doubled since 13 December, with the market reacting very positively to the acquisition news. Furthermore, the market volatility has led to both Flatex and DEGIRO to post strong business volume figures in the first quarter of 2020 as aforementioned.
Flatex is now trading on forward P/E ratios of 24.2x (FY20e) and 17.6x (FY21e) based on consensus forecasts. FY20 is above the average for B2B peers (22.0x), but below that of the B2C (28.1x if we exclude loss-making outlier Crealogix). However, its 2021 P/E is noticeably lower than the averages for B2B (23.7x) and B2C (23.3x, ex Crealogix). Consensus is forecasting a 38% increase in Flatex’s EPS in FY21, which is above average of its peers. The B2B average forecast EPS falls in FY21.
Consensus expects Flatex’s EBIT margin to increase from 31.6% to 34.8% between FY20 and FY21 and only one of the peers (Sopra Steria) in Exhibit 5 has a lower FY21 EV/EBIT than Flatex’s (12.2x).
So, besides the optimism regarding the DEGIRO acquisition, the market is also clearly positive about Flatex’s business model and the growth outlook underpinned by its healthy balance sheet and good competitive position. However, given the growth expectations, it is possible that some further positive re-rating of the shares may occur when (and if) the acquisition is approved the regulatory authorities.
Exhibit 5: Peer analytics
|
|
Curr. |
Shr price |
Mtk cap |
Rev grwth (y-o-y %) |
EBIT margin (%) |
P/E (x) |
EV/EBIT (x) |
||||
(curr) |
(€m) |
2020e |
2021e |
2020e |
2021e |
2020e |
2021e |
2020e |
2021e |
|||
FTKG.DE |
Flatex |
EUR |
42.0 |
822 |
56.5 |
31.8 |
31.6 |
34.8 |
24.2 |
17.6 |
17.5 |
12.1 |
AVANZ.ST |
Avanza |
SEK |
133 |
1,941 |
39.3 |
-5.0 |
51.2 |
43.9 |
26.6 |
32.3 |
84.8 |
104.4 |
CDBG.DE |
Comdirect |
EUR |
14 |
1,928 |
12.2 |
-4.2 |
34.0 |
28.5 |
18.2 |
22.2 |
14.6 |
18.2 |
ETFC.O |
Etrade |
USD |
48 |
9,581 |
-11.6 |
-5.6 |
35.5 |
34.5 |
17.5 |
19.5 |
53.0 |
57.9 |
FBK.MI |
FinecoBank |
EUR |
12 |
7,396 |
11.9 |
-1.4 |
62.8 |
62.0 |
24.7 |
25.1 |
12.1 |
12.4 |
IBKR.K |
Interactive brokers |
USD |
42 |
15,450 |
-7.5 |
-3.0 |
48.9 |
40.2 |
24.0 |
25.3 |
23.7 |
29.7 |
SQN.S |
Swissquote |
CHF |
80 |
1,158 |
12.9 |
7.8 |
26.0 |
27.4 |
20.8 |
17.7 |
63.4 |
56.0 |
Avg. B2B* |
|
|
|
9.5 |
-1.9 |
43.1 |
39.4 |
22.0 |
23.7 |
41.9 |
46.4 |
|
CLXN.S |
Crealogix |
CHF |
94 |
123 |
-1.7 |
5.2 |
-4.9 |
-2.8 |
-341.8 |
113.3 |
-24.0 |
-40.0 |
FRST.L |
First Derivatives |
GBP |
2,370 |
719 |
-2.9 |
6.0 |
12.9 |
13.1 |
37.7 |
31.3 |
24.3 |
22.5 |
GFTG.DE |
GFT |
EUR |
10 |
271 |
-0.1 |
6.8 |
4.0 |
5.4 |
20.0 |
14.8 |
19.1 |
13.3 |
SOPR.PA |
Sopra Steria |
USD |
109 |
2,252 |
-3.2 |
3.8 |
6.4 |
7.9 |
13.2 |
10.0 |
11.3 |
8.9 |
TEMN.S |
Temenos |
USD |
146 |
10,094 |
-2.9 |
12.7 |
34.5 |
33.9 |
41.7 |
37.0 |
37.5 |
33.8 |
Avg. B2C* |
|
|
|
-2.1 |
6.9 |
10.6 |
11.5 |
-45.9 |
41.3 |
13.6 |
7.7 |
|
Source: Refinitiv. * ex-Flatex Note: Priced at 22 June 2020.
General disclaimer and copyright Any Information, data, analysis and opinions contained in this report do not constitute investment advice by Deutsche Börse AG or the Frankfurter Wertpapierbörse. Any investment decision should be solely based on a securities offering document or another document containing all information required to make such an investment decision, including risk factors. This report has been commissioned by Deutsche Börse AG and prepared and issued by Edison for publication globally. Accuracy of content: All information used in the publication of this report has been compiled from publicly available sources that are believed to be reliable, however we do not guarantee the accuracy or completeness of this report and have not sought for this information to be independently verified. Opinions contained in this report represent those of the Edison analyst at the time of publication. Forward-looking information or statements in this report contain information that is based on assumptions, forecasts of future results, estimates of amounts not yet determinable, and therefore involve known and unknown risks, uncertainties and other factors which may cause the actual results, performance or achievements of their subject matter to be materially different from current expectations. Exclusion of Liability: To the fullest extent allowed by law, Edison shall not be liable for any direct, indirect or consequential losses, loss of profits, damages, costs or expenses incurred or suffered by you arising out or in connection with the access to, use of or reliance on any information contained on this note. No personalised advice: The information that we provide should not be construed in any manner whatsoever as, personalised advice. Also, the information provided by us should not be construed by any subscriber or prospective subscriber as Edison’s solicitation to effect, or attempt to effect, any transaction in a security. The securities described in the report may not be eligible for sale in all jurisdictions or to certain categories of investors. Investment in securities mentioned: Edison has a restrictive policy relating to personal dealing and conflicts of interest. Edison Group does not conduct any investment business and, accordingly, does not itself hold any positions in the securities mentioned in this report. However, the respective directors, officers, employees and contractors of Edison may have a position in any or related securities mentioned in this report, subject to Edison's policies on personal dealing and conflicts of interest. Copyright: Copyright 2020 Edison Investment Research Limited (Edison). Australia Edison Investment Research Pty Ltd (Edison AU) is the Australian subsidiary of Edison. Edison AU is a Corporate Authorised Representative (1252501) of Crown Wealth Group Pty Ltd who holds an Australian Financial Services Licence (Number: 494274). This research is issued in Australia by Edison AU and any access to it, is intended only for "wholesale clients" within the meaning of the Corporations Act 2001 of Australia. Any advice given by Edison AU is general advice only and does not take into account your personal circumstances, needs or objectives. You should, before acting on this advice, consider the appropriateness of the advice, having regard to your objectives, financial situation and needs. If our advice relates to the acquisition, or possible acquisition, of a particular financial product you should read any relevant Product Disclosure Statement or like instrument. New Zealand The research in this document is intended for New Zealand resident professional financial advisers or brokers (for use in their roles as financial advisers or brokers) and habitual investors who are “wholesale clients” for the purpose of the Financial Advisers Act 2008 (FAA) (as described in sections 5(c) (1)(a), (b) and (c) of the FAA). This is not a solicitation or inducement to buy, sell, subscribe, or underwrite any securities mentioned or in the topic of this document. For the purpose of the FAA, the content of this report is of a general nature, is intended as a source of general information only and is not intended to constitute a recommendation or opinion in relation to acquiring or disposing (including refraining from acquiring or disposing) of securities. The distribution of this document is not a “personalised service” and, to the extent that it contains any financial advice, is intended only as a “class service” provided by Edison within the meaning of the FAA (i.e. without taking into account the particular financial situation or goals of any person). As such, it should not be relied upon in making an investment decision. United Kingdom This document is prepared and provided by Edison for information purposes only and should not be construed as an offer or solicitation for investment in any securities mentioned or in the topic of this document. A marketing communication under FCA Rules, this document has not been prepared in accordance with the legal requirements designed to promote the independence of investment research and is not subject to any prohibition on dealing ahead of the dissemination of investment research. This Communication is being distributed in the United Kingdom and is directed only at (i) persons having professional experience in matters relating to investments, i.e. investment professionals within the meaning of Article 19(5) of the Financial Services and Markets Act 2000 (Financial Promotion) Order 2005, as amended (the "FPO") (ii) high net-worth companies, unincorporated associations or other bodies within the meaning of Article 49 of the FPO and (iii) persons to whom it is otherwise lawful to distribute it. The investment or investment activity to which this document relates is available only to such persons. It is not intended that this document be distributed or passed on, directly or indirectly, to any other class of persons and in any event and under no circumstances should persons of any other description rely on or act upon the contents of this document. This Communication is being supplied to you solely for your information and may not be reproduced by, further distributed to or published in whole or in part by, any other person. United States Edison relies upon the "publishers' exclusion" from the definition of investment adviser under Section 202(a) (11) of the Investment Advisers Act of 1940 and corresponding state securities laws. This report is a bona fide publication of general and regular circulation offering impersonal investment-related advice, not tailored to a specific investment portfolio or the needs of current and/or prospective subscribers. As such, Edison does not offer or provide personal advice and the research provided is for informational purposes only. No mention of a particular security in this report constitutes a recommendation to buy, sell or hold that or any security, or that any particular security, portfolio of securities, transaction or investment strategy is suitable for any specific person. |
|||
Frankfurt +49 (0)69 78 8076 960 Schumannstrasse 34b 60325 Frankfurt Germany |
London +44 (0)20 3077 5700 280 High Holborn London, WC1V 7EE United Kingdom |
New York +1 646 653 7026 1,185 Avenue of the Americas 3rd Floor, New York, NY 10036 United States of America |
Sydney +61 (0)2 8249 8342 Level 4, Office 1205 95 Pitt Street, Sydney NSW 2000, Australia |
Research: Energy & Resources
Canacol Energy is guiding to FY20 realised natural gas sales of 170–197mmscfd (cf 143mmscfd in FY19) as gas demand is picking up in Colombia while quarantine measures are lifted. The low case scenario assumes that spot sales (normally c 20% of the total) are not reactivated in 2020, and the high case scenario assumes they are reactivated in August 2020. We estimate a mid-case scenario of realised natural gas sales of 183mmscfd for the year, with sales in line with the last two weeks of May 2020 as reported by the company. Drilling operations have also resumed and the 2020 programme remains Canacol’s largest ever, despite a slimmed down programme from 12 to nine wells and lower capex for the year of US$108m. The company recently announced that it is maintaining its quarterly dividend of C$0.052/share. Our 2P + risked exploration NAV has decreased by 7% to C$6.55/share, reflecting the impact of lower gas sales demand in Colombia due to the COVID-19 pandemic.