Last close As at 05/08/2026
—
— 0.00 (0.00%)
Market capitalisation
—
Research: Investment Companies
The European Investment Trust
Written by
The European Investment Trust |
Concentrating on long-term value |
Investment trusts |
13 June 2016 |
Share price/discount performance
Three-year cumulative perf. graph
Gearing
Analysts
|
|||||||||||||||||||||||||||||||||||||||||||||||||||||||||||||||||||||||||||||||||||||
The European Investment Trust (EUT) focuses on continental European stocks expected to deliver superior returns based on five-year earnings forecasts. Performance has weakened over the last 12 months on market volatility and outperformance of growth stocks. However, the manager is sticking to a disciplined, valuation-driven process; expensive names have been reduced and the concentration in core ideas increased. Moreover, the trust moved from net cash to net gearing in February, towards the recent market lows, when the average year five P/E fell to a cyclical low of 7.5x. Despite a widening of the discount back to historical averages, the share price total return has outperformed the benchmark over the last five years.
12 months ending |
Total share price return (%) |
Total NAV return (%) |
Benchmark (%) |
MSCI World (%) |
FTSE All-Share (%) |
31/05/12 |
(22.5) |
(21.2) |
(24.3) |
(4.3) |
(8.0) |
31/05/13 |
37.5 |
37.5 |
42.0 |
30.5 |
30.1 |
31/05/14 |
32.1 |
21.2 |
12.5 |
8.0 |
8.9 |
31/05/15 |
9.4 |
3.8 |
4.1 |
16.8 |
7.5 |
31/05/16 |
(19.1) |
(11.8) |
(3.6) |
1.3 |
(6.3) |
Source: Thomson Datastream. Note: Total return figures in sterling.
Investment strategy: Disciplined, valuation driven
Dale Robertson of Edinburgh Partners (EP), the manager of EUT, applies EP’s disciplined investment process based on fundamental long-term earnings analysis. EP’s research indicates that stock returns are correlated to inflation-adjusted, five-year earnings performance but not well correlated for shorter periods. Stocks are generally bought when the year five real P/E (Y5 P/E) is below 8.5x and sold when above 14x. The trust typically invests in 35-50 individual names, with sector and geographic exposures largely driven by bottom-up stock selection. The investment process tends to overweight stocks with ‘value’ characteristics, but this style has been out of favour over the last few years.
Market outlook: Trading above average multiples
After the recent market rally from the lows in February, continental European equities are trading at a 20% premium to the 10-year average 12-month forward P/E ratio, which compares to a 16% premium for the Datastream World Index. Hence it appears difficult to make a strong case for outperformance of Europe as a whole near term, without significant corporate earnings upgrades and given uncertainty over the Brexit vote in the UK. This might favour a value discipline focused on individual stock opportunities.
Valuation: Back to an average discount
EUT currently trades at a 12.4% discount to NAV at 9 June 2016, which lies towards the middle of the range of 2-18% over the last five years. This represents a widening from a historically low discount of below 2.0% in mid-2015 and a return to a wider discount than the peer average. Although EUT is run for capital growth rather than income, the total dividend yield is above the peer average.
The European Investment Trust is a research client of Edison Investment Research Limited
Exhibit 1: Trust at a glance
Investment objective and fund background |
Recent developments |
||||||||||||||||||||||||||||||||||||||||||||||||||||||||||||||||||||||
The European Investment Trust (EUT) aims to achieve long-term capital growth through a diversified portfolio of continental European securities. The trust was launched in 1972 and management was transferred to Edinburgh Partners on 1 February 2010 following a tender process. The manager follows a disciplined, long-term value approach. The trust has an indefinite life and is not subject to a periodic continuation vote. |
■ November 2015: Full-year results to end September 2015. ■ FY15: NAV TR -5.5% vs benchmark -1.8%. Share price TR -5.8%. ■ 29 January 2016: Dividend for FY15 paid – total of 16.0p comprising ordinary dividend of 14.0p plus special dividend of 2.0p. |
||||||||||||||||||||||||||||||||||||||||||||||||||||||||||||||||||||||
Forthcoming |
Capital structure |
Fund details |
|||||||||||||||||||||||||||||||||||||||||||||||||||||||||||||||||||||
AGM |
January 2017 |
Ongoing charges |
0.63% |
Group |
Edinburgh Partners |
||||||||||||||||||||||||||||||||||||||||||||||||||||||||||||||||||
Interim results |
May 2016 |
Gearing |
1.1% |
Manager |
Dale Robertson |
||||||||||||||||||||||||||||||||||||||||||||||||||||||||||||||||||
Year end |
30 September 2016 |
Annual mgmt fee |
0.55% |
Address |
27-31 Melville Street Edinburgh EH3 7JF |
||||||||||||||||||||||||||||||||||||||||||||||||||||||||||||||||||
Dividend paid |
January |
Performance fee |
None |
||||||||||||||||||||||||||||||||||||||||||||||||||||||||||||||||||||
Launch date |
28 June 1972 |
Trust life |
Indefinite |
Phone |
+44 (0) 131 270 3800 |
||||||||||||||||||||||||||||||||||||||||||||||||||||||||||||||||||
Continuation vote |
N/A |
Loan facilities |
€30m |
Website |
|||||||||||||||||||||||||||||||||||||||||||||||||||||||||||||||||||
Dividend policy and history |
Share buyback policy and history |
||||||||||||||||||||||||||||||||||||||||||||||||||||||||||||||||||||||
The investment objective is to seek capital growth, hence the dividend is not a priority. Dividends are paid annually in January. |
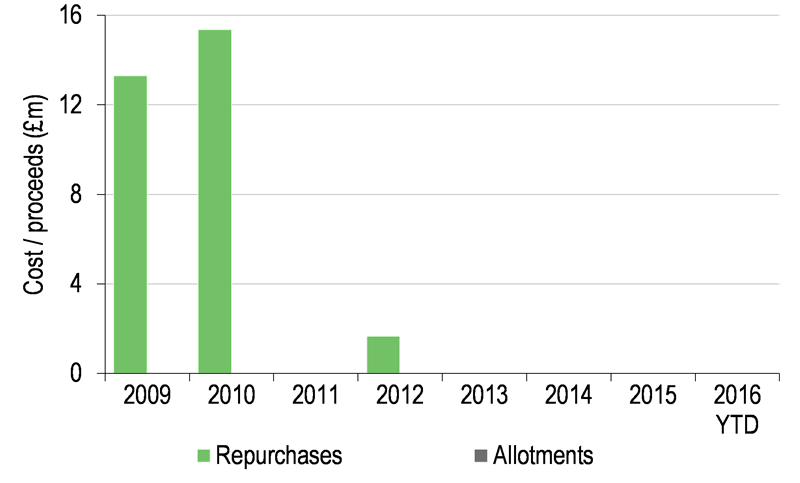
EUT is authorised both to repurchase up to 14.99% of its ordinary shares and to allot shares up to approximately 33% of the issued share capital. |
||||||||||||||||||||||||||||||||||||||||||||||||||||||||||||||||||||||
|
|
||||||||||||||||||||||||||||||||||||||||||||||||||||||||||||||||||||||
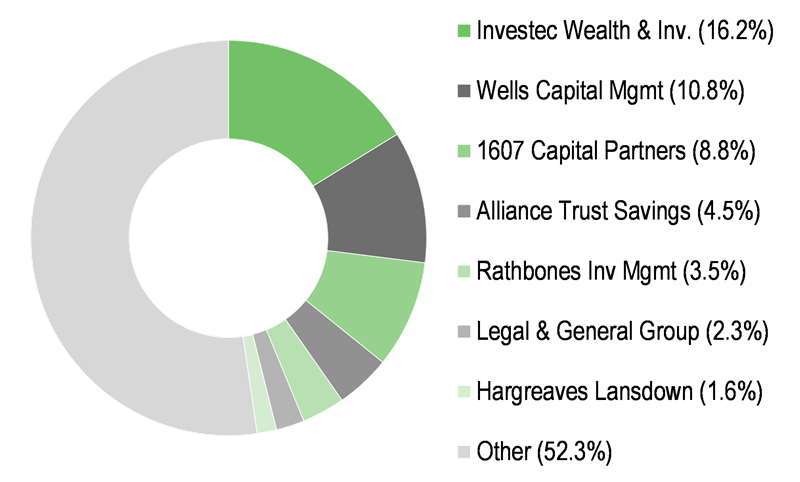
Shareholder base (as at 9th June 2016) |
Portfolio exposure by market cap (as at March 2016) |
||||||||||||||||||||||||||||||||||||||||||||||||||||||||||||||||||||||
|
|
||||||||||||||||||||||||||||||||||||||||||||||||||||||||||||||||||||||
Top 10 holdings (as at May 2016) |
|||||||||||||||||||||||||||||||||||||||||||||||||||||||||||||||||||||||
|
|||||||||||||||||||||||||||||||||||||||||||||||||||||||||||||||||||||||
Source: European Investment Trust, Edison Investment Research, Bloomberg, Morningstar, Thomson. Note: *N/A where not in May 2015 top 10.
Market outlook: Global markets appear fully valued
The European market has underperformed global equities over the last five years, but has roughly matched the UK market (Exhibit 2). Most of this underperformance versus the MSCI World index occurred since 2014 during turbulence leading to a third Greek bailout in late 2015, relative euro weakness and against a backdrop of improving US economic data. Currently, Europe is trading 20% above its 10-year average, 12-month forward P/E, close to the US premium of 21%, but below the UK premium of 29%. The World index is trading at a smaller 16% premium to the long-term average P/E, hence the case for strong outperformance of the overall European market is difficult to make without significant corporate earnings upgrades and with risks to the downside from the UK’s Brexit vote on 23 June. However, a strong valuation discipline focused on individual stock opportunities in the overall market could help drive outperformance.
|
Exhibit 2: Market performance and valuation: 10-year total return performance of Europe, UK and World indices |
|||||||||||||||||||||||||||||||
Market indices |
12-month forward P/E ratio (Datastream Indices) |
||||||||||||||||||||||||||||||
|
|
||||||||||||||||||||||||||||||
|
Source: Thomson Datastream, Edison Investment Research. Note: Data to 9 June 2016. |
|||||||||||||||||||||||||||||||
Fund profile: Concentrated long-term European value
The European Investment Trust (EUT) was launched in 1972 as Foreign & Colonial Eurotrust. Edinburgh Partners (EP) has been managing the fund since February 2010 under Dale Robertson, who joined EP in 2003. EP’s investment philosophy is that stock markets are efficient long term, but essentially random in the short term. EP founder Sandy Nairn developed EP’s investment process after working with Sir John Templeton. The focus is on bottom-up, valuation-driven stock-picking based on five-year earnings forecasts (see Investment process below). The benchmark is the FTSE All-World Europe ex-UK index although, as a focused portfolio of 35-50 stocks, its sector and country weightings tend to diverge quite widely from the index. EUT is permitted to gear up to 20% of net assets and currently carries 1.1% net gearing after drawing down €15m of a €30m credit facility on 11 February 2016. Currency exposure may be hedged, but this facility has not been used in practice.
The fund manager: Dale Robertson
The manager’s view: Sticking to a disciplined process
Dale Robertson’s view on the environment has not changed dramatically over the last six months. The fallout from the global financial crisis and eurozone sovereign debt crisis has manifested itself in a low-growth, low-inflation environment with central banks responding through unconventional monetary policies such as QE. Given this backdrop, bonds and bond-like (‘quality’) equities have enjoyed a substantial re-rating (Exhibit 3)
|
Exhibit 3: Value has outperformed long term, but significantly underperformed recently |
|
|
Source: Thomson Datastream, Edison Research. Note: 30 April 1975 to 9 June 2016. |
According to Robertson, the valuation of growth stocks has become detached from fundamentals and is unsustainable. Given the current stretched relationship between growth and value (Exhibit 3), any potential reversal could be rapid and violent, in his view.
In mid-2015, it was difficult to find stocks on Y5 P/Es below 11x and EUT was running a net cash position. Subsequent market volatility affected performance, but yielded attractive opportunities. By selling more expensive outperformers and reinvesting in discounted stocks, Robertson has moved the Y5 P/E of the fund from 11x in mid-2015 to around 8.5x by end-May 2016, with gearing employed in February when the portfolio Y5 P/E was briefly down to only 7.5x. Robertson has high conviction in the portfolio holdings. Catalysts for a turnaround in performance revolve around company-specific factors, as well as the overall macro environment, which will determine when value begins to outperform growth again. In Robertson’s view, this is likely to happen when inflation and bond yields stabilise, and he notes the gradual pick-up in core inflation figures in both the US and UK and recent recovery in oil and other commodity prices.
The largest active portfolio weight is now in oil and gas. EP’s analysis suggests that on a three- to five-year view the oil price will be significantly higher – in the $60-100 range – given the expected drop in supply and funding to the industry and continuing demand growth. As an example, Petroleum Geo-Services trades on a Y5 P/E below 5x assuming partially recovered margins. Banks and healthcare remain important subthemes and weightings could be increased in the future. In terms of risk to the outlook, Robertson sees subdued eurozone GDP growth of 1.5% as reasonable and a ‘new normal’ level baked into EP’s investment assumptions. Political risk is viewed as potentially more significant, with Brexit a risk to European political cohesion, but Robertson thinks it is difficult to play this one way or the other and this appears partly reflected in valuations.
Asset allocation
Investment process: Long-term earnings drive stocks
EP picks stocks using a rigorous, largely bottom-up investment process. This was further developed by EP founder Sandy Nairn after previously working with Sir John Templeton; his empirical analysis suggested stock total returns were highly correlated to five-year earnings performance, but not well correlated over shorter time horizons. In other words, the stock market is rational over the long run, but not necessarily in the short run. EP’s team of 12 experienced sector-specialist analysts projects five-year, inflation-adjusted earnings forecasts for potential investments resulting in a Y5 real P/E. EP’s research concludes that above average real returns can be earned when the Y5 P/E is below 11x. Although EP does not specifically aim to be a traditional ‘value’ manager, the process tends to pick shares with value characteristics such as low price/book, low price/sales, low price/cash flow, low P/E and high dividend yield, etc.
Dale Robertson, the manager of EUT, builds a relatively concentrated portfolio of 35-50 stocks using the EP research team’s ideas. He also takes into account risk in the portfolio by considering scenarios for the five-year forecasts and avoids very high tail-risk situations. Robertson generally looks to buy stocks on Y5 P/Es below 8.5x and to sell above 14x. This fundamental approach can require patience as the market can deviate from valuation norms for extended periods.
Current portfolio positioning
The portfolio currently contains 35 stocks, towards the lower end of the typical 35-50 range. In the last 12 months, 10 stocks were sold completely including Volkswagen, Fresenius Medical Care, United Internet, Gerresheimer, Heineken, KPN and Pirelli. These companies were sold due to strong performance and extended valuation, with the exception of Volkswagen and Pirelli. Volkswagen was sold three days after the emissions scandal news came out and Pirelli was bid for. The proceeds were invested in five new names: Stora Enso (a strategic transformation story in paper and packaging), Ubisoft (video games), E.ON (utilities, an unloved sector), DIA (Spanish discount retailer) and Commerzbank (German GDP play), plus existing holdings such as Total, Rocket Internet, PostNL and Royal Dutch Shell. As a result, the fund is now more concentrated with the top 10 positions representing 37.7% vs 32.6% in May 2015. In keeping with the investment process, recent buys have been made on Y5 P/Es of 6.1-9.1x, with sales made on Y5 P/Es of 12.5-14.5x. In terms of investment subthemes, the oil and gas sector is now the largest active position based on a three- to five-year $80 oil price expectation driven by supply and funding reduction. Healthcare remains a focus (EUT classifies Bayer in healthcare, making the fund slightly overweight on that basis) with improving drug R&D productivity, attractive sustainable returns and M&A upside. Telecoms consolidation is becoming played out now with a more conservative new EU competition commissioner, so the weighting has fallen 10 percentage points over the last 12-18 months. Banks remain a key subtheme with the sector in better shape than it has been for some time; most of the capital-raising is over and there is reasonable ‘new normal’ GDP growth of 1.5% in the EU. By country, Germany is favoured due to its strong domestic economy, and Italy based on Prime Minister Renzi’s reform programme.
Exhibit 4: Portfolio sector exposure vs benchmark (%)
Portfolio end May 2016 |
Portfolio end May 2015 |
Change |
Index weight |
Active weight vs index |
Trust weight/ index weight |
|
Banks |
14.9 |
13.7 |
1.2 |
12.2 |
2.7 |
1.2 |
Industrial goods & services |
13.9 |
16.2 |
-2.4 |
10.2 |
3.7 |
1.4 |
Oil & gas |
12.8 |
9.2 |
3.5 |
7.5 |
5.3 |
1.7 |
Healthcare |
10.5 |
14.5 |
-4.0 |
12.4 |
-1.9 |
0.8 |
Technology |
8.0 |
5.2 |
2.8 |
3.5 |
4.5 |
2.3 |
Financial services |
5.5 |
5.3 |
0.2 |
1.6 |
3.9 |
3.4 |
Insurance |
4.6 |
5.3 |
-0.8 |
6.0 |
-1.4 |
0.8 |
Telecoms |
4.5 |
10.3 |
-5.9 |
4.8 |
-0.3 |
0.9 |
Personal & household goods |
3.8 |
0.0 |
3.8 |
8.5 |
-4.8 |
0.4 |
Retail |
3.6 |
0.0 |
3.6 |
3.2 |
0.3 |
1.1 |
Other |
18.1 |
20.2 |
-2.0 |
30.3 |
-12.2 |
0.6 |
Source: The European Investment Trust, Edison Investment Research
Performance: Near-term drags down five-year record
Near-term performance has been weak as value-style funds have generally underperformed in a low-growth, low-inflation environment. Combined with central bank QE, this backdrop has led to a significant relative re-rating of growth companies and more growth-orientated peer funds have outperformed. This has been a strong trend recently: in the 12 months to 31 May 2016, the NAV and share price underperformed the index by 8.5% and 16.1% respectively. Banks, insurance, autos and industrials were the main negative contributors by sector and underperformance was exacerbated by the emissions scandal at Volkswagen, which had been a top ten holding (now sold). While it would be unfair to blame the manager for an event that could not have been predicted beforehand, Volkswagen was a top five negative contributor in the 12 months to 31 May 2016. This weak near-term performance has dragged down the solid longer-term performance record of EUT, but despite this the shares have still outperformed the benchmark by 2.9% since inception, against a NAV total return that has lagged the benchmark by 3.5 %.
|
Exhibit 5: Investment trust performance to 31 May 2016 |
|||||||||
Price, NAV and benchmark total return performance, one-year rebased |
Price, NAV and benchmark total return performance (%) |
||||||||
|
|
||||||||
|
Source: Thomson Datastream, Edison Investment Research. Note: Three-, five- and SI-year performance figures annualised. |
|||||||||
|
Exhibit 6: Share price and NAV total return performance, relative to index (%) |
|||||||||
|
One month |
Three months |
Six months |
One year |
Three years |
Five years |
Since inception |
||
Price relative to FTSE AW Europe ex UK |
(2.2) |
(2.9) |
(6.6) |
(16.1) |
3.5 |
2.6 |
2.9 |
||
NAV relative to FTSE AW Europe ex UK |
(1.0) |
(1.2) |
(1.4) |
(8.5) |
(1.8) |
(1.0) |
(3.5) |
||
Price relative to FTSE All-Share |
(2.9) |
(2.2) |
(5.5) |
(13.7) |
6.6 |
(5.1) |
(6.6) |
||
NAV relative to FTSE All-Share |
(1.7) |
(0.4) |
(0.3) |
(5.9) |
1.2 |
(8.4) |
(12.4) |
||
Price relative to MSCI World |
(3.5) |
(3.0) |
(8.8) |
(20.1) |
(8.5) |
(22.0) |
(22.5) |
||
NAV relative to MSCI World |
(2.3) |
(1.2) |
(3.8) |
(12.9) |
(13.2) |
(24.7) |
(27.3) |
||
|
Source: Thomson Datastream, Edison Investment Research. Note: Data to end-May 2016. Geometric calculation. |
|||||||||
|
Exhibit 7: NAV performance relative to FTSE Europe ex UK index over five years |
|||||||||
|
|||||||||
|
Source: Thomson Datastream, Edison Investment Research |
|||||||||
Discount: Back to average levels
The current discount to cum income NAV of 12.4% lies around the middle of the range over the last five years, after hitting a historically low level of below 2% in mid-2015. This widening partly reflects a general widening in the investment trust sector during a period of greater market volatility, but also a return to a wider discount than the peer group average. There is no formal discount control mechanism, but EUT would be more likely to buy back shares if the discount were to approach the wider end of the historical range.
|
Exhibit 8: Share price premium/discount to NAV (including income) over five years (%) |
|
|
Source: Thomson Datastream, Edison Investment Research. Note: Negative values indicate a discount, positive values a premium. |
Capital structure and fees
EUT is a conventional investment trust, with 42.07m ordinary shares in issue at 31 May 2016, and is dual-listed on the London Stock Exchange and New Zealand Stock Exchange. There is no fixed discount management policy, but EUT has the authority to buy back up to 14.99% or allot up to 33% of shares. No buybacks have been made since 2012 and EUT is unlikely to do so unless the discount moves towards the wider end of the historical range. The company announced a new €30m overdraft credit facility on 11 February 2016 and drew down half of that, or €15m on this date to take advantage of market weakness. As a result, gearing has risen from 1.3% net cash at FY15 to 1.1% net gearing at 31 May 2016. For the time being EUT will not refinance the credit facility into long-term rates given the outlook for interest rates to stay low into the foreseeable future. EP receives an annual management fee of 0.55% of EUT’s market capitalisation. There is no performance fee, and ongoing charges for FY15 were 0.63%, 30bp lower than the AIC peer group average.
Dividend policy and record
EUT’s investment objective is to generate long-term capital growth. However, the trust tends to declare a total dividend equal to the post-tax revenue account. The total dividend comprises an ordinary dividend plus a special dividend and is paid in January. For 2015 the ordinary dividend declared was 14p plus a 2p special dividend. The corresponding dividends for 2014 were 14p ordinary plus 1p special. Ordinary dividends have grown or been maintained each year since 2009 for a compound average growth rate of 5.8% and were covered 1.06x and 1.14x by net revenue in 2014 and 2015 respectively. Special dividends have varied between 1p and 4p over the last five years. EUT also maintained a revenue reserve of £10.9m at FY15, equal to 26.1p per share, but according to the manager is unlikely to be used to pay out dividends.
Peer group comparison
Exhibit 9 below compares EUT with its peer group, as defined by the Association of Investment Companies. NAV and share price total returns have lagged the group over one, three and five years, reflecting in part the challenging environment for value-style investors over this period. Absolute performance is clearly positive over three and five years, but EUT has slightly lagged the benchmark over five years. On a risk-adjusted basis, the Sharpe ratio is below the average over one and three years, but less so over the latter period. The overall weaker performance is reflected in an above average discount to NAV. EUT offers a competitive yield versus peers and the lowest ongoing charge. Gearing is below average, but the trust moved opportunistically from a net cash to a net geared position during the market sell-off in February 2016.
Exhibit 9: Selected peer group as at 9 June 2016
% unless stated |
Market cap £m |
NAV TR 1 Year |
NAV TR 3 Year |
NAV TR 5 Year |
NAV TR 10 Year |
Sharpe 1y (NAV) |
Sharpe 3y (NAV) |
Discount (ex-par) |
Ongoing charge |
Perf. fee |
Net gearing |
Dividend yield (%) |
European Investment Trust |
279.8 |
(10.3) |
13.5 |
22.8 |
39.4 |
(0.8) |
0.2 |
(11.2) |
0.6 |
No |
101 |
2.4 |
BlackRock Greater Europe |
259.1 |
5.7 |
23.7 |
42.6 |
119.6 |
(0.0) |
0.4 |
(4.6) |
0.9 |
No |
100 |
2.0 |
Fidelity European Values |
693.9 |
(0.7) |
21.0 |
42.3 |
100.4 |
(0.4) |
0.3 |
(8.1) |
1.0 |
No |
103 |
2.2 |
Henderson European Focus Trust |
201.6 |
(0.8) |
34.2 |
66.4 |
156.5 |
(0.4) |
0.6 |
(3.2) |
0.9 |
Yes |
109 |
2.5 |
Henderson EuroTrust |
184.4 |
4.5 |
32.3 |
58.4 |
145.1 |
(0.0) |
0.6 |
(2.9) |
0.9 |
Yes |
107 |
2.1 |
JPMorgan European Growth |
181.5 |
3.0 |
29.1 |
38.6 |
82.1 |
(0.1) |
0.5 |
(10.2) |
1.0 |
No |
108 |
2.6 |
JPMorgan European Income |
115.2 |
1.6 |
34.6 |
52.8 |
|
(0.3) |
0.6 |
(8.4) |
1.1 |
No |
110 |
3.9 |
Jupiter European Opportunities |
595.8 |
4.2 |
41.5 |
85.2 |
256.6 |
0.0 |
0.7 |
(1.8) |
1.1 |
Yes |
115 |
0.7 |
Weighted average |
313.9 |
0.8 |
28.4 |
53.7 |
141.0 |
(0.2) |
0.5 |
(6.0) |
0.94 |
107 |
2.0 |
|
EUT Rank in sector |
3 |
8 |
8 |
8 |
7 |
8 |
8 |
8 |
8 |
7 |
4 |
Source: Morningstar, Edison Investment Research. Note: TR=total return. Sharpe ratio is a measure of risk-adjusted return. The ratios shown are calculated by Morningstar for the past 12- and 36-month periods by dividing a fund’s annualised excess returns over the risk-free rate by its annualised standard deviation. Net gearing is total assets less cash and equivalents as a percentage of net assets.
The board
EUT has five independent non-executive directors with extensive experience in investment management and investment trusts: Douglas McDougall, chairman (appointed 1999), also chairman of The Independent Investment Trust and non-executive director of Herald Investment Trust, Pacific Horizon Investment Trust and The Monks Investment Trust; William Eason (appointed 2007), also director of charities at Quilter Cheviot and director of Henderson International Income Trust and Regional REIT; Michael Moule (appointed 2004), also chairman of Polar Capital Technology Trust and member of the investment committee of the British Heart Foundation and The Open University; Dr Michael Woodward (appointed 2013), also non-executive director of R&H Fund Services; and Michael MacPhee, who was appointed in January 2016 to assist with succession planning and was previously an investment partner at Baillie Gifford & Co.
|
Investment Companies