Last close As at 05/08/2026
—
— 0.00 (0.00%)
Market capitalisation
—
Research: Investment Companies
The European Investment Trust (EUT) is managed by Craig Armour at Edinburgh Partners. This company follows a strict value-based investment process, based on the philosophy that there is a stable relationship between expected share price total returns and a company’s current share price compared with its long-term earnings per share (see chart below). In recent years, global markets have been led by growth rather than value stocks, and EUT’s investment performance has consequently lagged that of its benchmark FTSE All-World Europe ex-UK index. The board has announced that it is undertaking a review of EUT’s management arrangements and will update shareholders in due course.
The European Investment Trust |
Review of management arrangements |
Investment trusts |
19 June 2019 |
Share price/discount performance
Three-year performance vs index
Gearing
Analysts
|
|||||||||||||||||||||||||||||||||||||||||||||||||||||||||||||||||||||||||||||||||||||||||||
The European Investment Trust (EUT) is managed by Craig Armour at Edinburgh Partners. This company follows a strict value-based investment process, based on the philosophy that there is a stable relationship between expected share price total returns and a company’s current share price compared with its long-term earnings per share (see chart below). In recent years, global markets have been led by growth rather than value stocks, and EUT’s investment performance has consequently lagged that of its benchmark FTSE All-World Europe ex-UK index. The board has announced that it is undertaking a review of EUT’s management arrangements and will update shareholders in due course.
|
Very clear negative correlation between year-five P/E multiples and expected share price annual total returns |
|
|
Source: The European Investment Trust, Edison Investment Research |
The market opportunity
European markets have not been immune to higher levels of volatility as investors worry about the escalating disputes between the US and its trading partners. There are also region-specific considerations, such as Brexit and political polarisation. As a result, European shares are looking attractively valued compared with their own history and the world market, which may provide an opportunity for long-term, patient investors.
Why consider investing in EUT?
■
The trust provides clear exposure to a value strategy, which has significantly underperformed a growth approach in recent years.
■
Progressive dividend policy, with an above-average 3.3% yield.
■
Very competitive cost structure.
Scope for a narrower discount
EUT’s current 12.2% share price discount to cum-income NAV is wider than the 10.2% to 11.8% range of discounts over the last one, three and five years. There is scope for a revaluation if the trust’s performance improves, or if there is increased investor demand for European equities. EUT has a progressive dividend policy; its total distribution has compounded at a rate of 11.4% pa over the last nine years, and the trust currently offers a 3.3% dividend yield.
Exhibit 1: Trust at a glance
Investment objective and fund background |
Recent developments |
||||||||||||||||||||||||||||||||||||||||||||||||||||||||||||||||||||||
The European Investment Trust (EUT) seeks attractive investment returns over the long term from a diversified portfolio of European securities. The trust was launched in 1972 and management was transferred to Edinburgh Partners on 1 February 2010 following a tender process. The manager follows a disciplined, long-term value investment approach. |
■ 23 May 2019: Six-month report ending 31 March 2019. NAV TR -7.7% versus benchmark TR -3.6%. Share price TR -10.2%. Announcement of 9.5p interim dividend (+5.6% year-on-year). The board is undertaking a review of EUT’s management arrangements. ■ 11 February 2019: Launch of EUT’s new website. ■ 29 November 2018: Annual report for 12 months ending 30 September 2018. NAV TR -2.1% versus benchmark TR +2.4%. Share price TR +1.2%. Announcement of 18.0p final dividend (+33.3% year-on-year). |
||||||||||||||||||||||||||||||||||||||||||||||||||||||||||||||||||||||
Forthcoming |
Capital structure |
Fund details |
|||||||||||||||||||||||||||||||||||||||||||||||||||||||||||||||||||||
AGM |
January 2020 |
Ongoing charges |
0.63% (H119) |
Group |
Edinburgh Partners |
||||||||||||||||||||||||||||||||||||||||||||||||||||||||||||||||||
Final results |
November 2019 |
Net cash |
0.9% |
Manager |
Craig Armour |
||||||||||||||||||||||||||||||||||||||||||||||||||||||||||||||||||
Year end |
30 September |
Annual mgmt fee |
Tiered (see page 7) |
Address |
27-31 Melville Street, |
||||||||||||||||||||||||||||||||||||||||||||||||||||||||||||||||||
Dividend paid |
July, January |
Performance fee |
None |
||||||||||||||||||||||||||||||||||||||||||||||||||||||||||||||||||||
Launch date |
1972 |
Trust life |
Indefinite |
Phone |
+44 (0) 131 270 3800 |
||||||||||||||||||||||||||||||||||||||||||||||||||||||||||||||||||
Continuation vote |
None |
Loan facilities |
€30m |
Website |
|||||||||||||||||||||||||||||||||||||||||||||||||||||||||||||||||||
Dividend policy and history (financial years) |
Share buyback policy and history (financial years) |
||||||||||||||||||||||||||||||||||||||||||||||||||||||||||||||||||||||
The investment objective is to achieve attractive investment returns, so dividend yield is not the primary aim. Historically, annual dividends were paid in January, but starting in July 2017 an interim dividend is also paid in July. |
EUT is authorised both to repurchase up to 14.99% of its ordinary shares at a discount and to issue up to 5% of its issued share capital at a premium to NAV. |
||||||||||||||||||||||||||||||||||||||||||||||||||||||||||||||||||||||
|
|
||||||||||||||||||||||||||||||||||||||||||||||||||||||||||||||||||||||
Shareholder base (as at 31 May 2019) |
Portfolio exposure by geography (as at 31 May 2019) |
||||||||||||||||||||||||||||||||||||||||||||||||||||||||||||||||||||||
|
|
||||||||||||||||||||||||||||||||||||||||||||||||||||||||||||||||||||||
Top 10 holdings (as at 31 May 2019) |
|||||||||||||||||||||||||||||||||||||||||||||||||||||||||||||||||||||||
|
|||||||||||||||||||||||||||||||||||||||||||||||||||||||||||||||||||||||
Source: The European Investment Trust, Edison Investment Research, Bloomberg, Morningstar. Note: *N/A where not in end-May 2018 top 10.
Market outlook: Valuations relatively attractive
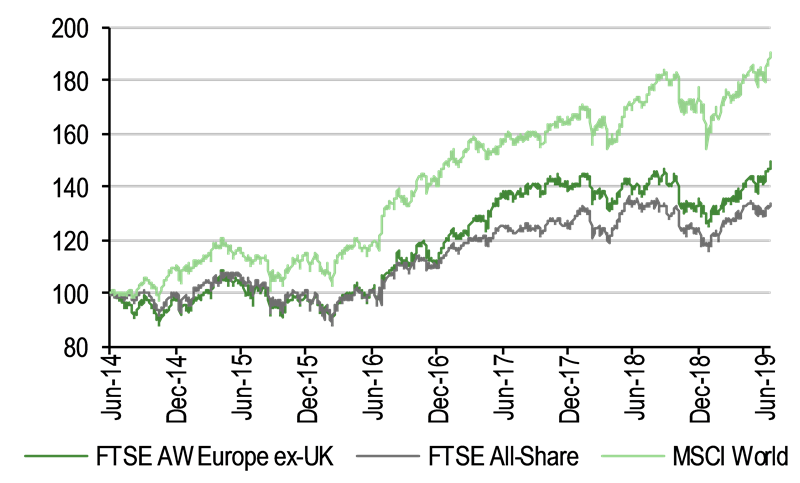
The performance of indices, in sterling terms, is shown in Exhibit 2 (LHS). Over the last five years, European shares have outpaced those in the UK, but have failed to keep up with the world market, where the dominant US has outperformed in recent years. Over the past 18 months, global stock markets have returned to more normal levels of volatility following a particularly benign 2017; investor concerns include the escalating dispute between the US and its trading partners and its potential negative effect on economic growth. Within Europe there are other considerations that have led to outflows by international investors, such as the lack of a Brexit resolution, an increased level of political polarisation, and Italian budget concerns. However, current depressed sentiment towards European equities may provide a longer-term opportunity. The Datastream Europe ex-UK index is currently trading on a forward P/E multiple of 13.0x, which is a 4.3% discount to the 13.6x five-year average. In relative terms, Europe is trading at an 11.7% P/E discount to the world market; this is considerably wider than the 7.9% average discount over the last five years.
|
Exhibit 2: Market performance and valuation |
|
Performance of indices, last five years (in £ terms) |
Valuation of European equities (using Datastream Europe ex-UK index) |
|
|
|
Source: Refinitiv, Edison Investment Research. Note: Valuation data as at 18 June 2019. |
|
Fund profile: Relatively concentrated exposure
EUT was launched in 1972 and since 1 February 2010 has been managed by Edinburgh Partners (EP), which follows a value-driven process developed by the company’s founder, Sandy Nairn. It is based on the understanding that stock markets are efficient over the long term (with share prices being driven by company fundamentals), but behave more randomly over shorter periods. Over the course of EP’s tenure, EUT’s investment performance has been somewhat disappointing; from the beginning of February 2010 until the end of March 2019, the trust’s 84.7% NAV total return has lagged the benchmark FTSE All-World Europe ex-UK index’s 101.5% total return. As a result, the board has announced that it is undertaking a review of EUT’s management arrangements.
EP manager Craig Armour aims to achieve attractive investment returns over the long term from a diversified portfolio of European securities. EUT’s portfolio typically contains 30–50 securities across the market cap spectrum. Investment parameters dictate a maximum 10% of the portfolio in a single stock, and a limit of 10% in countries not included in the FTSE All-World Europe indices. Investment in unquoted companies requires prior board approval. In normal market conditions, gearing of up to 20% of NAV is permitted; at end-May 2019, EUT had a 0.9% net cash position. The manager may hedge the trust’s currency exposure, but in practice does not do so.
February 2019 saw the launch of EUT’s new website, www.eitplc.com, which has improved features and additional functionality. The company has also revamped its monthly factsheets (historical publications are now available on the website).
The fund manager: Craig Armour
The manager’s view: Low growth, not a recession
Armour says that the way to describe the European economic backdrop is ‘subdued growth’. He senses that recent data points have been better than anticipated compared with very low expectations – at the end of 2018, he suggests the outlook was ‘horrendous’, but as Q119 progressed, things did not look quite as bad. However, confidence indicators are fluctuating, depending on newsflow regarding the US trade disputes.
The manager comments that investor sentiment towards Europe remains poor, with parallels being drawn with Japan in terms of ‘no growth forever’, an ageing population and a lack of inflation. However, Armour says that although Germany, like Japan, is an industrial leader, there is immigration into Europe, demographic trends differ by region, and Europe has low inflation, not deflation. Also, he notes the difference in debt profiles; Europe’s debt to GDP is considerably lower than Japan’s, which provides some degree of increased flexibility. However, persistently low interest rates in Europe do mean that the ECB, similar to other central banks, lacks policy tools to stimulate the economy.
If there is a recession in Europe, the manager says he believes investors will continue to pay up for the more defensive sectors, such as consumer staples, telecoms and utilities. However, if the economy just slows or is bumpy, he suggests that cyclical stocks offer the best value. Armour says EUT’s portfolio is balanced between defensive and cyclical sectors. He reduced the trust’s cyclical exposure in 2018, but ‘not by enough’, as recession fears in Q418 led to particular weakness in EUT’s holdings in banks and industrials. The European (and global) market has been volatile in 2019, as investor sentiment towards the growth outlook waxes and wanes, and the manager notes that while he was pleasantly surprised by the resiliency of Q119 earnings results, there have been what he considers to be outsized share price moves for companies failing to meet expectations. In such an environment, Armour says that it is important to ‘keep your head’ and maintain a longer-term perspective, suggesting that while there are always issues for investors to worry about, and economic growth in Europe is muted, he does not think the region is heading for a recession unless there is a policy misstep.
Asset allocation
Investment process: Value-based approach
The manager has a bottom-up approach to stock selection, seeking to identify companies that are trading at a discount to their intrinsic value. He focuses on long-term analysis of risk and reward potential, and is not distracted by short-term gyrations in the stock market. This unconstrained, contrarian approach means that EUT’s portfolio construction can vary markedly from the benchmark FTSE All-World Europe ex-UK index.
EP’s investment philosophy is that the stock market is rational over the long term, wherein a company’s share price is driven by its fundamentals, but over shorter periods, there is a more random relationship between a firm’s earnings growth and movements in its stock price. Armour is able to draw on the expertise of EP’s well-resourced team of 14 portfolio managers and analysts, and two applied research personnel. The investment professionals each have 30–50 stocks under coverage and conduct in-depth fundamental analysis. The resulting standard research template includes a company’s five-year, inflation-adjusted earnings forecast, a Y5 P/E multiple, and an environmental, social and governance (ESG) rating. EP’s analysis shows that above-average real returns can be delivered when companies are purchased at a Y5 P/E below 11x; over the last 20 years the average Y5 P/E of EUT’s portfolio has ranged between 7x and 11x (currently 9x). The fund typically has 35–45 positions and portfolio turnover is around 20–25% pa, implying an average holding period of four to five years. In H119, active share was 81% (this is a measure of how a fund differs from its benchmark, with 0% representing full index replication and 100% no commonality).
Current portfolio positioning
The trust’s sector exposures shown in Exhibit 3 highlight that compared with 12 months ago there is higher exposure to technology (+6.4pp), with a lower weighting in financials (-6.2pp).
Exhibit 3: Portfolio sector exposure vs benchmark (% unless stated)
Portfolio end- |
Portfolio end- |
Change |
Index |
Active weight |
Trust weight/ |
|
Healthcare |
19.5 |
16.8 |
2.7 |
14.9 |
4.6 |
1.3 |
Industrials |
15.6 |
19.7 |
(4.1) |
15.4 |
0.2 |
1.0 |
Financials |
15.0 |
21.2 |
(6.2) |
20.4 |
(5.4) |
0.7 |
Oil & gas |
10.5 |
12.7 |
(2.2) |
5.1 |
5.5 |
2.1 |
Consumer services |
9.9 |
11.2 |
(1.3) |
4.3 |
5.6 |
2.3 |
Technology |
9.3 |
2.9 |
6.4 |
6.4 |
2.9 |
1.4 |
Consumer goods |
8.2 |
7.6 |
0.6 |
20.4 |
(12.2) |
0.4 |
Telecommunications |
6.2 |
5.2 |
1.0 |
3.4 |
2.8 |
1.8 |
Utilities |
2.5 |
2.4 |
0.1 |
4.7 |
(2.2) |
0.5 |
Basic materials |
2.2 |
0.0 |
2.2 |
5.1 |
(2.9) |
0.4 |
Cash/(gearing) |
0.9 |
0.4 |
0.5 |
N/A |
N/A |
N/A |
100.0 |
100.0 |
100.0 |
Source: The European Investment Trust, Edison Investment Research. Note: Numbers subject to rounding.
Armour highlights three relatively recent additions to EUT’s portfolio. He is finding more opportunities in the mid-cap space, as higher risk aversion has seen investors gravitate towards larger companies.
■
Gerresheimer – a Germany-listed manufacturer of glass and plastic packaging for the healthcare sector (products include inhalers, insulin pens and syringes). End-demand is growing, while high-quality standards and regulatory expertise provide barriers to entry. The manager says the company hired a new CEO in early 2018 who has reinvigorated the business in both developed and emerging markets.
■
Stora Enso – an integrated paper and packaging producer based in Finland. Operations have shifted from the declining paper market into packaging, where there is increased demand led by e-commerce. Stora Enso is also reducing exposure to the volatile pulp market by buying out its forestry joint venture partner to secure its supply of raw material. Armour says that the company has a strong balance sheet and a well-supported dividend (5.4% yield).
■
Valeo – a French automotive supply company providing products for vehicles with all three types of engines (petrol, diesel or electric). Its focus is on electrification products and reducing emissions, and it has a joint venture with Siemens, all of which offer long-term growth potential. While end-demand in the auto sector is currently depressed, the manager says that Valeo’s stock was sufficiently cheap for him to consider a position; in addition, the company has a strong balance sheet and a healthy c 5% dividend yield.
Performance: Affected by growth stock leadership
Exhibit 4: Five-year discrete performance data
12 months ending |
Share price |
NAV |
Benchmark |
FTSE All-Share |
MSCI World |
31/05/15 |
9.4 |
3.7 |
4.1 |
7.5 |
16.8 |
31/05/16 |
(19.1) |
(11.7) |
(3.6) |
(6.3) |
1.3 |
31/05/17 |
41.8 |
39.8 |
35.8 |
24.5 |
32.0 |
31/05/18 |
1.2 |
0.7 |
1.3 |
6.5 |
8.8 |
31/05/19 |
(11.2) |
(9.9) |
2.4 |
(3.2) |
5.9 |
Source: Refinitiv. Note: All % on a total return basis in pounds sterling.
In H119 (ending 31 March), EUT’s NAV and share price total returns of -7.7% and -10.2% respectively trailed the benchmark’s -3.6% total return. In terms of industry attribution, healthcare added +0.7pp, consumer goods +0.5pp and technology +0.4pp, while the main detractors were all cyclical sectors: industrials (-4.0pp), financials (-3.5pp) and oil & gas (-1.8pp). On a stock level, the largest positive contributors were major pharma company Roche (+0.6pp), Ireland-based global nutrition group Glanbia (+0.5pp) and food retailer Ahold Delhaize (+0.4pp). The largest detractors were auto part supplier Leoni (-1.2pp), oil service firm Petroleum Geo-Services, and delivery company PostNL (both -1.0pp).
|
Exhibit 5: Investment trust performance to 31 May 2019 |
|
Price, NAV and benchmark total return performance, one-year rebased |
Price, NAV and benchmark total return performance (%) |
|
|
|
Source: Refinitiv, Edison Investment Research. Note: SI is since move to Edinburgh Partners (1 February 2010). Three-year, five-year and SI performance figures annualised. |
|
EUT has suffered a poor period of relative performance; it has lagged its benchmark, the FTSE All-Share and the MSCI World over the periods shown in Exhibit 6. Armour explains that, once again in 2019, value stocks have been unable to keep pace with growth stocks; of the c 10% underperformance in the first five months of this year, around 5pp occurred in May alone. The manager says that the escalation in the disputes between the US and its trading partners, along with falling bond yields, points to an economic slowdown. This has weighed particularly heavily on the performance of EUT’s cyclical holdings, such as banks and industrials.
|
Exhibit 6: Share price and NAV total return performance, relative to indices (%) |
||||||||
|
One month |
Three months |
Six months |
One year |
Three years |
Five years |
SI |
|
Price relative to FTSE AW Europe ex-UK |
(5.4) |
(8.6) |
(8.6) |
(13.3) |
(9.6) |
(20.3) |
(8.0) |
|
NAV relative to FTSE AW Europe ex-UK |
(5.0) |
(6.6) |
(7.3) |
(12.0) |
(9.9) |
(17.9) |
(11.9) |
|
Price relative to FTSE All-Share |
(3.8) |
(6.0) |
(7.8) |
(8.3) |
(0.9) |
(12.9) |
(8.1) |
|
NAV relative to FTSE All-Share |
(3.5) |
(3.9) |
(6.6) |
(6.9) |
(1.3) |
(10.2) |
(12.1) |
|
Price relative to MSCI World |
(4.4) |
(8.0) |
(6.2) |
(16.2) |
(16.3) |
(37.4) |
(36.0) |
|
NAV relative to MSCI World |
(4.0) |
(6.0) |
(4.9) |
(14.9) |
(16.6) |
(35.5) |
(38.7) |
|
|
Source: Refinitiv, Edison Investment Research. Note: Data to end-May 2019. Geometric calculation. |
||||||||
|
Exhibit 7: NAV total return performance relative to benchmark over three years |
||||||||
|
||||||||
|
Source: Refinitiv, Edison Investment Research |
||||||||
Capital structure and fees
EUT is a conventional investment trust with one class of share; there are currently 40.2m ordinary shares in issue. Renewed annually, the trust is authorised both to repurchase up to 14.99% of its ordinary shares and to issue up to 5% of its issued share capital at a premium to NAV, to manage a discount or premium. EUT has a €30m overdraft facility with The Northern Trust Company, but at end-May 2019, the trust had a net cash position of 0.9%. The manager employs gearing tactically, depending on valuations, and suggests that when EUT’s portfolio Y5 P/E multiple is 8x, the use of gearing is appropriate, but not so when the average multiple is 10x.
Historically, EP received a flat annual management fee of 0.55% of EUT’s market capitalisation, but starting on 1 June 2018, a tiered structure was introduced, at 0.55% up to £500m market cap and 0.50% above this level (there is no performance fee). The board believes that a fee based on market capitalisation rather than a percentage of NAV more closely aligns the interests of EP with those of EUT’s shareholders. Starting in FY18, two-thirds of fees and financing costs related to borrowing are charged to the capital account (the split between the capital and revenue accounts reflects the board’s expected breakdown of future capital and income returns). In H119, ongoing charges were 0.63%; while this was a modest 2bp higher year-on-year, EUT’s fees remain very competitive versus its peers in the AIC Europe sector (Exhibit 9).
Dividend policy and record
Since 2017, EUT has paid dividends twice (in July and January) rather than once a year. The total distribution has either increased or been maintained for the last nine years, compounding at an annual rate of 11.4%. In FY18, the total dividend was 27.0p per share, a 25.6% increase versus the 21.5p regular dividend paid in FY17 (along with a 1.5p special dividend), helped by a change in the allocation of fees. The annual distribution was more than covered by revenue.
In H119, EUT generated net revenue per share of 7.9p; this was 6.0% lower year-on-year due to the disposal of some of the trust’s higher-yielding positions. Investors should not extrapolate the H119 revenue result, as many European companies pay their dividends in April and May, while EUT’s expenses are incurred more evenly throughout the financial year. The board has announced a first interim dividend of 9.5p per share (+5.6% year-on-year). At the end of H119, the trust had revenue reserves of £7.7m, which is c 0.7x the FY18 dividend payment. Based on its current share price, EUT offers a 3.3% dividend yield.
Peer group comparison
EUT is one of eight members of the AIC Europe sector. The trust has experienced a period of tough performance, meaning its NAV total returns are the lowest over the periods shown. It has a very competitive ongoing charge, which is 30bp below the mean, and no performance fee is payable. EUT is one of two funds in the group that are ungeared, and it has a competitive yield, ranking second (70bp above the average).
Exhibit 9: AIC Europe sector peer group as at 18 June 2019*
% unless stated |
Market |
NAV TR |
NAV TR |
NAV TR |
NAV TR |
Discount |
Ongoing charge |
Perf. |
Net |
Dividend |
European Investment Trust |
328.0 |
(8.5) |
34.8 |
19.6 |
139.5 |
(12.2) |
0.6 |
No |
100 |
3.3 |
BlackRock Greater Europe |
320.1 |
7.5 |
61.5 |
69.9 |
278.7 |
(4.7) |
1.1 |
No |
103 |
1.5 |
Fidelity European Values |
1,016.3 |
8.3 |
61.5 |
71.1 |
223.5 |
(8.3) |
0.9 |
No |
105 |
2.5 |
Henderson European Focus |
262.8 |
1.2 |
46.2 |
54.2 |
250.2 |
(9.8) |
0.8 |
No |
100 |
2.5 |
Henderson EuroTrust |
239.4 |
3.9 |
51.8 |
63.5 |
241.5 |
(10.2) |
0.8 |
No |
103 |
2.7 |
JPMorgan European Growth Pool |
210.9 |
(2.7) |
41.2 |
45.8 |
188.8 |
(11.0) |
1.0 |
No |
105 |
3.0 |
JPMorgan European Income Pool |
158.4 |
2.5 |
47.5 |
54.9 |
229.1 |
(9.1) |
1.1 |
No |
106 |
4.1 |
Jupiter European Opportunities |
985.9 |
7.0 |
70.0 |
98.7 |
496.5 |
(0.1) |
0.9 |
Yes |
106 |
0.7 |
Average (8 funds) |
440.2 |
2.4 |
51.8 |
59.7 |
256.0 |
(8.2) |
0.9 |
103 |
2.6 |
|
EUT rank in sector |
3 |
8 |
8 |
8 |
8 |
8 |
8 |
7= |
2 |
Source: Morningstar, Edison Investment Research. Note: *Performance data to 17 June 2019 based on ex-par NAV. TR = total return. Net gearing is total assets less cash and equivalents as a percentage of net assets (100 = ungeared).
The board
Following the retirement of William Eason at the January 2019 AGM, there are five directors on EUT’s board, all of whom are non-executive. The chairman is Michael MacPhee, who joined the board in 2016 and assumed his current role in 2017. Michael Moule was appointed in 2004, while Dr Michael Woodward joined the board in 2013. The two newest directors are Sue Inglis and Andrew Watkins, who were both appointed on 1 January 2019. Inglis is chairman of the Bankers Investment Trust and is on the boards of Baillie Gifford US Growth Trust, BMO Managed Portfolio Trust, NextEnergy Solar Fund and Seneca Global Income & Growth Trust. Watkins is chairman of Ashoka India Equity Investment Trust and is on the boards of BMO UK High Income Trust and Chelverton UK Dividend Trust.
|
|
Investment Companies
Research: TMT
Pantaflix’s content production business continues to do well, although FY18 earnings were impacted by timing issues, with revenues slipping into FY19 and costs already incurred. The content pipeline is strong, including a first series for Netflix. Longer-term growth should come from expanding the Pantaflix platform from transactional video-on-demand (TVoD) to subscription and advertising-supported models (SVoD and AVoD). It should also open up white-label and commercial B2B2C opportunities.