Last close As at 05/08/2026
—
— 0.00 (0.00%)
Market capitalisation
—
Research: Investment Companies
The European Investment Trust (EUT) adopts a strict valuation-based investment approach to construct a relatively concentrated portfolio of stocks that can be held for the long term. Manager Craig Armour says that monetary conditions are slowly normalising following the extreme policies adopted as a result of the global financial crisis. He believes that this process will lead to an increase in stock market volatility, which will in turn lead to a greater investor focus on company valuations. Armour has been selectively adding attractively priced new positions to EUT’s portfolio across a range of industries. However, on balance he has been taking some risk off the table by reducing the fund’s cyclical exposure.
The European Investment Trust |
Managing risk in a transition period |
Investment trusts |
21 June 2018 |
Share price/discount performance
Three-year performance vs index
Gearing
Analysts
|
|||||||||||||||||||||||||||||||||||||||||||||||||||||||||||||||||||||||||||||||||||||||||||||||||||||||||||||
The European Investment Trust (EUT) adopts a strict valuation-based investment approach to construct a relatively concentrated portfolio of stocks that can be held for the long term. Manager Craig Armour says that monetary conditions are slowly normalising following the extreme policies adopted as a result of the global financial crisis. He believes that this process will lead to an increase in stock market volatility, which will in turn lead to a greater investor focus on company valuations. Armour has been selectively adding attractively priced new positions to EUT’s portfolio across a range of industries. However, on balance he has been taking some risk off the table by reducing the fund’s cyclical exposure.
12 months ending |
Share price |
NAV |
Benchmark |
FTSE All-Share |
MSCI World |
|
31/05/14 |
32.1 |
20.6 |
12.5 |
8.9 |
8.0 |
|
31/05/15 |
9.4 |
3.7 |
4.1 |
7.5 |
16.8 |
|
31/05/16 |
(19.1) |
(11.7) |
(3.6) |
(6.3) |
1.3 |
|
31/05/17 |
41.8 |
39.8 |
35.8 |
24.5 |
32.0 |
|
31/05/18 |
1.2 |
0.7 |
1.3 |
6.5 |
8.8 |
Source: Thomson Datastream. Note: All % on a total return basis in pounds sterling.
Investment strategy: Valuation-based stock selection
EUT is managed by Edinburgh Partners (EP), whose analysis shows that stock prices are correlated over the long term with a company’s inflation-adjusted, five-year earnings performance, but that share price moves over shorter time periods are more random. The manager and his team undertake in-depth research, seeking companies with attractive fundamentals, which are trading on a five-year (Y5) P/E of less than 11x. EUT’s typical 35-45 stock portfolio is diversified by geography and sector, and is constructed without reference to the FTSE All-World Europe ex-UK index benchmark. Gearing of up to 20% is permitted, but at end-May 2018 the trust had a net cash balance of 0.4%.
Market outlook: Higher valuations warrant selectivity
Global equity valuations, including those of European companies, are looking somewhat extended. On a forward earnings multiple basis, European stocks are trading at a c 15% premium to their 10-year average. Given this backdrop and ongoing macroeconomic concerns, including a potential trade war in response to US protectionism, investors may be well served by considering a fund with a rigorous valuation-based approach to stock selection.
Valuation: Discount in line with historical averages
EUT’s current 10.1% share price discount to cum-income NAV is broadly similar to the averages over the last one, three and five years of 10.4%, 10.7% and 10.2% respectively. The trust has a progressive dividend policy; annual distributions have grown or been maintained each year since 2009, compounding at an average rate of 6.7% pa. Including indicated and special dividends, EUT has a yield of 2.6%.
Exhibit 1: Trust at a glance
Investment objective and fund background |
Recent developments |
||||||||||||||||||||||||||||||||||||||||||||||||||||||||||||||||||||||
The European Investment Trust (EUT) seeks attractive investment returns over the long term from a diversified portfolio of European securities. The trust was launched in 1972 and management was transferred to Edinburgh Partners on 1 February 2010 following a tender process. The manager follows a disciplined, long-term value investment approach. The trust has an indefinite life and is not subject to a periodic continuation vote. |
■ 23 May 2018: Interim report for six months ending 31 March 2018. NAV TR ■ 1 May 2018: Edinburgh Partners became a wholly owned subsidiary of Franklin Templeton Investments. ■ 30 November 2017: Annual report for 12 months ending 30 September 2017. NAV TR +29.9% versus benchmark TR +22.6%. Share price TR +32.2%. Announcement of 13.5p final dividend. |
||||||||||||||||||||||||||||||||||||||||||||||||||||||||||||||||||||||
Forthcoming |
Capital structure |
Fund details |
|||||||||||||||||||||||||||||||||||||||||||||||||||||||||||||||||||||
AGM |
January 2019 |
Ongoing charges |
0.61% (at H118) |
Group |
Edinburgh Partners |
||||||||||||||||||||||||||||||||||||||||||||||||||||||||||||||||||
Final results |
November 2018 |
Net cash |
0.4% |
Manager |
Craig Armour |
||||||||||||||||||||||||||||||||||||||||||||||||||||||||||||||||||
Year end |
30 September |
Annual mgmt fee |
Tiered (see page 7) |
Address |
27-31 Melville Street, |
||||||||||||||||||||||||||||||||||||||||||||||||||||||||||||||||||
Dividend paid |
July, January |
Performance fee |
None |
||||||||||||||||||||||||||||||||||||||||||||||||||||||||||||||||||||
Launch date |
1972 |
Trust life |
Indefinite |
Phone |
+44 (0) 131 270 3800 |
||||||||||||||||||||||||||||||||||||||||||||||||||||||||||||||||||
Continuation vote |
None |
Loan facilities |
€30m |
Website |
|||||||||||||||||||||||||||||||||||||||||||||||||||||||||||||||||||
Dividend policy and history (financial years) |
Share buyback policy and history (financial years) |
||||||||||||||||||||||||||||||||||||||||||||||||||||||||||||||||||||||
The investment objective is to achieve attractive investment returns, so dividend yield is not the primary aim. Historically, annual dividends were paid in January, but starting in July 2017 an interim dividend is also paid. |
EUT is authorised both to repurchase up to 14.99% of its ordinary shares and to issue up to 5% of its issued share capital at a premium to NAV. |
||||||||||||||||||||||||||||||||||||||||||||||||||||||||||||||||||||||
|
|
||||||||||||||||||||||||||||||||||||||||||||||||||||||||||||||||||||||
Shareholder base (as at 31 May 2018) |
Portfolio exposure by geography (as at 31 May 2018) |
||||||||||||||||||||||||||||||||||||||||||||||||||||||||||||||||||||||
|
|
||||||||||||||||||||||||||||||||||||||||||||||||||||||||||||||||||||||
Top 10 holdings (as at 31 May 2018) |
|||||||||||||||||||||||||||||||||||||||||||||||||||||||||||||||||||||||
|
|||||||||||||||||||||||||||||||||||||||||||||||||||||||||||||||||||||||
Source: The European Investment Trust, Edison Investment Research, Bloomberg, Morningstar. Note: *N/A where not in end-May 2017 top 10.
Market outlook: Focus on company valuations
Following a period of above-average equity returns in recent years (Exhibit 2, LHS), driven by robust corporate earnings growth and re-rating, company valuations are now less attractive. This includes European equities which, although on an absolute forward earnings multiple are cheaper than both global and US equities, are looking extended versus their 10-year average (Exhibit 2, RHS). Stock market volatility has returned to more normal levels in 2018, following a particularly benign environment in 2017, as investors have had to consider the risk of higher interest rates due to an uptick in inflation, along with other developments such as the risk of a trade war due to US protectionism and recent political upheaval in Europe. In this environment of elevated valuations and macroeconomic risks, investors may be rewarded by a more selective approach to equity investing, with a greater focus on company valuations.
|
Exhibit 2: Market performance and valuation |
|||||||||||||||||||||||||||||||
Performance of indices, last five years (in £ terms) |
Forward P/E multiples of Datastream indices |
||||||||||||||||||||||||||||||
|
|
||||||||||||||||||||||||||||||
|
Source: Thomson Datastream, Edison Investment Research. Note: Data to 20 June 2018. |
|||||||||||||||||||||||||||||||
Fund profile: Value-based investment approach
EUT was launched in 1972 and has been managed by Edinburgh Partners (EP) since February 2010. EP was launched in 2003 and has more than £7bn of assets under management, of which £1.3bn is in European mandates. On 1 May 2018, EP was acquired by Franklin Templeton Investments; the investment teams will remain independent and there will be no change to EUT’s disciplined, valuation-based investment process, which is based on five-year earnings forecasts. Sandy Nairn, founder of EP, will remain as its investment partner and CEO, but is now also chairman of the Templeton Global Equity Group. He previously worked at the firm between 1990 and 2000 with Sir John Templeton, with whom he shared a similar philosophy and investment approach. Since August 2016, EUT has been managed by Craig Armour, who joined EP in 2009. The trust is listed on the Main Market of the London Stock Exchange. Effective from 2 November 2017, EUT is no longer listed on the New Zealand Stock Exchange, as the board considered that the costs of the secondary listing outweighed the benefits. At the January 2018 AGM, the board proposed a change in the trust’s investment objective from “achieve long-term capital growth through a diversified portfolio of Continental European securities” to “achieve attractive investment returns over the long term from a diversified portfolio of European securities”. This resolution was duly approved by EUT’s shareholders. The trust’s portfolio is made up of 30-50 securities, with a maximum 10% (at the time of investment) in a single stock. Up to 10% of the portfolio may be invested in countries outside of the benchmark FTSE All-World Europe ex-UK index. EUT traditionally has not hedged its currency exposure. Gearing of up to 20% is permitted in normal market conditions, although at end-May the trust had a net cash position of 0.4%.
The fund manager: Craig Armour
The manager’s view: On the path to monetary normalisation
Armour says that the European economy remains reasonably robust, although President Trump’s threats to global trade via the imposition of tariffs have had a negative effect on sentiment. The manager believes the eurozone is on the path towards normalisation of monetary policy, albeit behind the progress being made in the US. He notes continuing evidence of higher inflation in Europe, such as in the labour market. An example is in Germany, where the most powerful labour union IG Metall has agreed a 4.3% wage increase over 27 months and more flexible working hours.
While European politics have once again been in the news recently, the manager is keen to stress that he “invests in companies, not countries”. However, he is mindful of the risks of investing in companies in southern Europe that have a high domestic exposure – only c 12% of EUT’s portfolio is invested in Italy and Spain. The trust holds two Italian stocks: Eni, which is an international business and Mediobanca, which is well capitalised with minimal exposure to sovereign debt and has an attractive wealth management business. The manager says that while investors tend to focus on negative political issues such as immigration and the rise in popularity of more extreme political movements, there have also been positive developments. He says that Greece, Portugal and Ireland have “all taken their medicine”, and their economies are the better for it, and he notes the potential for meaningful reforms in France. He believes that President Macron has a mandate for change and should be able to bring about a more flexible labour market, including pension reform. Armour says that these moves should be very good news for the French economy, which would be on a par with the German reforms of 2004-06.
In Europe, as elsewhere, the manager sees the impact of technological developments as a pervasive theme. He says that companies across the board have to deal with the effects of digital disruption, so it is very important to try to differentiate between those companies that are responding to digital threats by using technology more effectively and those who fail to act. He cites Ryanair as an example of a company that is embracing change, such as trying to harness data from its 130 million annual customers, which could be used to generate future revenue streams.
Asset allocation
Investment process: Disciplined, bottom-up approach
EP employs a disciplined, valuation-based, bottom-up approach to stock selection. The key assumption is that the stock market is rational over the long term but, over shorter periods, there is a more random relationship between a company’s earnings growth and movements in its stock price. Armour is able to draw on EP’s well-resourced team of 13 portfolio managers and analysts, and one applied research personnel. They each have 30-50 stocks under coverage and conduct in-depth fundamental research, which includes a company’s five-year, inflation-adjusted earnings forecast, and hence a Y5 P/E multiple. Each company under review is also given an environmental, social and governance (ESG) rating.
EP’s analysis shows that above-average real returns can be delivered when companies are purchased at a Y5 P/E below 11x. Over the last 20 years the average Y5 P/E of EUT’s portfolio has ranged between 7x and 11x (currently close to the top end of the range). Armour explains that due to EP’s long-term, valuation-based approach, there may be periods when the trust lags its benchmark, hence EUT’s investors should also have a long-term investment horizon. The trust’s portfolio is relatively concentrated, generally made up of 35-45 positions. In H118, portfolio turnover was 21%, broadly similar to 22% in FY17, and active share was 80%, again, similar to 79% in FY17. (Active share is a measure of how a portfolio differs from an index, with 0% representing full index replication and 100% no commonality.)
Current portfolio positioning
At end-May 2018, EUT’s top 10 positions made up 31.5% of the portfolio, which was a modest decrease in concentration compared to 34.2% a year earlier; six positions were common to both periods. The trust’s positioning compared with the benchmark is shown in Exhibit 3. EUT has no exposure to five industry subsectors, which together make up a meaningful 17.7% of the benchmark. It is also heavily overweight oil & gas (+7.9pp), industrial goods & services (+7.1pp) and banks (+6.6pp), while underweight two relatively defensive sectors: personal & household goods (-5.0pp) and food & beverages (-4.7pp). However, it should be noted that in aggregate, over the last 12 months, the manager has been taking risk off the table and reducing cyclical exposure.
Exhibit 3: Portfolio subsector exposure vs benchmark (% unless stated)
Portfolio end- |
Portfolio end- |
Change |
Index |
Active weight |
Trust weight/ |
|
Industrial goods & services |
19.7 |
15.9 |
3.8 |
12.6 |
7.1 |
1.6 |
Banks |
18.8 |
19.2 |
(0.4) |
12.2 |
6.6 |
1.5 |
Healthcare |
16.8 |
12.8 |
4.0 |
13.2 |
3.6 |
1.3 |
Oil & gas |
12.7 |
11.0 |
1.7 |
4.8 |
7.9 |
2.6 |
Telecoms |
5.2 |
7.1 |
(1.9) |
3.3 |
1.9 |
1.6 |
Media |
4.3 |
2.0 |
2.3 |
1.7 |
2.6 |
2.5 |
Retail |
4.1 |
5.0 |
(0.9) |
2.6 |
1.5 |
1.6 |
Technology |
2.9 |
5.0 |
(2.1) |
5.8 |
(2.9) |
0.5 |
Travel & leisure |
2.8 |
3.2 |
(0.4) |
0.5 |
2.3 |
5.3 |
Food & beverages |
2.7 |
0.0 |
2.7 |
7.4 |
(4.7) |
0.4 |
Personal & household goods |
2.6 |
2.6 |
0.0 |
7.6 |
(5.0) |
0.3 |
Utilities |
2.4 |
2.4 |
0.0 |
4.1 |
(1.7) |
0.6 |
Financial services |
2.4 |
2.3 |
0.1 |
1.6 |
0.8 |
1.5 |
Automobiles & parts |
2.3 |
3.7 |
(1.4) |
4.8 |
(2.5) |
0.5 |
Basic resources |
0.0 |
1.9 |
(1.9) |
1.5 |
(1.5) |
0.0 |
Chemicals |
0.0 |
3.6 |
(3.6) |
5.3 |
(5.3) |
0.0 |
Construction & materials |
0.0 |
0.0 |
0.0 |
3.4 |
(3.4) |
0.0 |
Insurance |
0.0 |
0.0 |
0.0 |
5.8 |
(5.8) |
0.0 |
Real estate |
0.0 |
0.0 |
0.0 |
1.7 |
(1.7) |
0.0 |
Cash & others |
0.4 |
2.3 |
(1.9) |
0.0 |
0.4 |
N/A |
100.0 |
100.0 |
100.0 |
Source: The European Investment Trust, Edison Investment Research
Armour notes higher stock market volatility so far in 2018 compared to the very benign environment in 2017. He says that this is generating more opportunities to trim and add to EUT’s positions. However, the manager says that attractively valued new ideas are hard to find. Over the last 20 years the Y5 P/E on the portfolio has ranged between 7x and 11x. It is currently near the top end, at c 10x. New positions in recent months include Polish telecom company Cyfrowy Polsat (purchased at a Y5 P/E of 9.4x), Irish global nutrition group Glanbia (Y5 P/E of 9.4x), Danish facilities management company ISS (Y5 P/E of 10.4x) and French telecom company Orange (Y5 P/E of 10.6x).
Performance: NAV modestly behind benchmark in H118
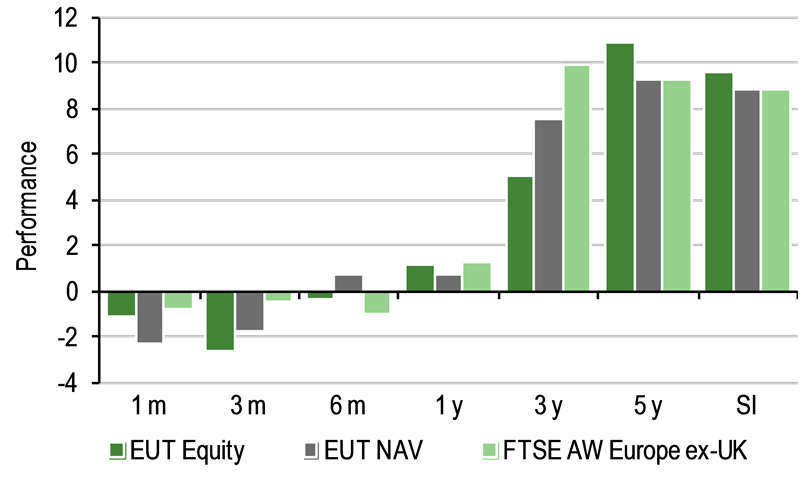
In H118, EUT’s NAV and share price total returns of -4.2% and -1.8% compared with the -4.0% benchmark total return. In terms of sectors the best contributor was oil & gas (+0.9pp), where all holdings delivered positive returns. The largest detractor was financials (-1.9pp), led by the banks, which benefit from rising interest rates and so were negatively affected when the trend of rising bond yields stalled in early 2018. At the stock level, the best contributors to performance were Danish telecom company TDC (+0.7pp), Norwegian seismic firm Petroleum Geo-Services (+0.6pp) and Dutch digital security company Gemalto (+0.5pp). The largest detractors were German pharma and life science company Bayer, Spanish food retailer DIA and French pharma company Sanofi (each contributed -0.7pp to performance).
|
Exhibit 4: Investment trust performance to 31 May 2018 |
|||||||||
Price, NAV and benchmark total return performance, one-year rebased |
Price, NAV and benchmark total return performance (%) |
||||||||
|
|
||||||||
|
Source: Thomson Datastream, Edison Investment Research. Note: SI is since move to Edinburgh Partners (1 February 2010). Three-year, five-year and SI performance figures annualised. |
|||||||||
|
Exhibit 5: Share price and NAV total return performance, relative to indices (%) |
|||||||||
|
One month |
Three months |
Six months |
One year |
Three years |
Five years |
SI |
||
Price relative to FTSE AW Europe ex-UK |
(0.3) |
(2.1) |
0.7 |
(0.1) |
(12.5) |
7.9 |
6.2 |
||
NAV relative to FTSE AW Europe ex-UK |
(1.5) |
(1.3) |
1.7 |
(0.6) |
(6.3) |
0.1 |
0.1 |
||
Price relative to FTSE All-Share |
(3.8) |
(9.3) |
(6.6) |
(5.0) |
(6.6) |
15.3 |
0.2 |
||
NAV relative to FTSE All-Share |
(5.0) |
(8.5) |
(5.7) |
(5.5) |
(0.0) |
6.9 |
(5.5) |
||
Price relative to MSCI World |
(5.1) |
(5.7) |
(4.1) |
(7.1) |
(20.3) |
(8.7) |
(23.6) |
||
NAV relative to MSCI World |
(6.3) |
(4.9) |
(3.1) |
(7.5) |
(14.6) |
(15.3) |
(28.0) |
||
|
Source: Thomson Datastream, Edison Investment Research. Note: Data to end-May 2018. Geometric calculation. |
|||||||||
|
Exhibit 6: NAV total return performance relative to benchmark over three years |
|||||||||
|
|||||||||
|
Source: Thomson Datastream, Edison Investment Research |
|||||||||
Discount: Range-bound over the last year
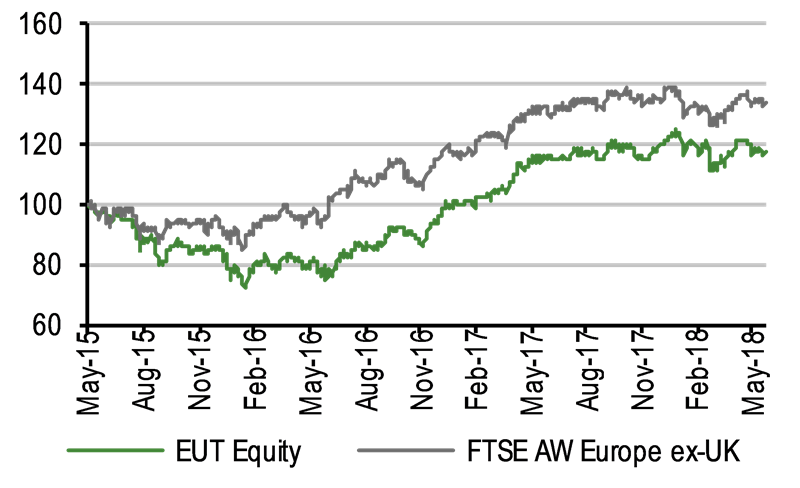
EUT’s share price discount to cum-income NAV started to narrow noticeably from c 18% in late 2016 and has been in a relatively tight range of an 8% to 12% discount over the past year (Exhibit 7). The trust’s current 10.1% discount is broadly similar to the averages over the last one, three and five years (range of 10.2% to 10.7%). Renewed annually, EUT is authorised to repurchase up to 14.99% of its shares in issue in order to help manage the discount. So far in FY18, c 230k shares have been repurchased at a cost of c £2.1m.
|
Exhibit 7: Share price discount to NAV (including income) over three years (%) |
|
|
Source: Thomson Datastream, Edison Investment Research |
Capital structure and fees
EUT is a conventional investment trust with one class of share in issue; there are currently 41.8m ordinary shares outstanding. Renewed annually, the trust is authorised both to repurchase up to 14.99% of its ordinary shares and to issue up to 5% of its issued share capital at a premium to NAV, in order to manage a discount or premium. EUT has a €30m overdraft facility with Northern Trust, but at end-May 2018 the trust was ungeared and running a net cash position of 0.4%.
There has been a revision to EUT’s fee structure. Historically, EP received an annual management fee of 0.55% of EUT’s market capitalisation. Starting on 1 June 2018, the annual management fee will be 0.55% up to a £500m market cap and 0.50% above this level; there continues to be no performance fee entitlement. The board believes that paying a percentage of market capitalisation rather than a percentage of NAV more closely aligns the interests of EP with those of shareholders. In H118, ongoing charges were 0.61%, which was a modest 2bp higher than 0.59% in FY17. The trust has a very competitive fee structure, with the lowest ongoing charge in the AIC Europe sector (35bp below average). Starting in FY18, two-thirds of fees and financing costs related to borrowing will be charged to the capital account. The 2/3:1/3 split between capital and revenue accounts reflects the board’s expected breakdown of future capital and income returns. All else being equal, the change in allocation of management fees and financing costs related to borrowing should increase the revenue available for dividend payments.
Dividend policy and record
EUT’s ordinary dividends have grown or been maintained since 2009, with a compound annual growth rate of 6.7%. The trust also pays special dividends, which are dependent on the level of income (Exhibit 1). In FY17, the 21.5p ordinary dividend was 34.4% higher than the 16.0p ordinary dividend paid in FY16. Taking special dividends into account, the FY17 total distribution of 23.0p was 4.5% higher than 22.0p in FY16. It was 1.1x covered by income, which was boosted by the receipt of historic overseas withholding tax reclaims and the strength of the euro relative to sterling. At end-FY17, EUT had revenue reserves of £9.9m (23.5p per share, which is 0.5p higher than the last annual total distribution). In H118, revenue per share was 8.4p; this was lower than 8.9p in H117, which included 3.2p of historic overseas withholding tax reclaims. Because many European companies pay their dividends between April and September, the H118 revenue per share should not be extrapolated when considering the potential total income in FY18.
Starting in 2017, the trust now pays an interim dividend in July, as well as a final dividend in January. A 9.0p interim dividend has been announced for H118, which is 12.5% higher than 8.0p in H117. Based on the current share price, EUT’s dividend yield (including indicated and special dividends) is 2.6%.
Peer group comparison
EUT is one of eight trusts in the Association of Investment Companies Europe sector. Its NAV total returns are below average over the periods shown. However, it should be noted that since the global financial crisis in 2007-08, growth rather than value stocks have led the European (and global) stock markets, and the peers generally have a growth rather than value bias. EUT has a modestly wider than average discount in a sector where none of the trusts trades at a premium. It has the lowest ongoing charge (35bp below the average) and no performance fee is payable. EUT’s 2.6% dividend yield is the second highest in the group, c 0.4pp above average.
Exhibit 8: AIC Europe sector peer group as at 18 June 2018*
% unless stated |
Market |
NAV TR |
NAV TR |
NAV TR |
Discount |
Ongoing charge |
Perf. |
Net |
Dividend |
European Investment |
382.7 |
2.3 |
28.7 |
59.7 |
(8.7) |
0.6 |
No |
100 |
2.6** |
BlackRock Greater Europe |
309.1 |
13.2 |
52.7 |
80.8 |
(1.3) |
1.1 |
No |
104 |
1.5 |
Fidelity European Values |
916.7 |
8.6 |
44.9 |
75.3 |
(11.1) |
0.9 |
No |
110 |
2.0 |
Henderson European Focus |
268.2 |
2.0 |
40.2 |
88.0 |
(6.0) |
0.9 |
Yes |
102 |
2.4 |
Henderson EuroTrust |
237.8 |
4.7 |
49.7 |
87.8 |
(6.5) |
0.9 |
Yes |
102 |
2.3 |
JPMorgan European Growth Pool |
220.4 |
3.8 |
44.5 |
79.4 |
(11.1) |
1.1 |
No |
106 |
2.3 |
JPMorgan European Income Pool |
159.7 |
2.0 |
44.1 |
88.2 |
(9.0) |
1.1 |
No |
107 |
4.0 |
Jupiter European Opportunities |
878.9 |
14.6 |
59.4 |
115.4 |
(2.4) |
1.0 |
Yes |
106 |
0.8 |
Average (8 funds) |
421.7 |
6.4 |
45.5 |
84.3 |
(7.0) |
0.9 |
105 |
2.2 |
|
EUT rank in sector |
3 |
6 |
8 |
8 |
5 |
8 |
8 |
2 |
Source: Morningstar, Edison Investment Research. Note: *Performance data to 15 June 2018. **Includes indicated and special dividends. TR = total return. Net gearing is total assets less cash and equivalents as a percentage of net assets (100 = ungeared).
The board
There are four directors on EUT’s board; all are non-executive and independent of the manager. The chairman Michael MacPhee was appointed in 2016 and assumed his current role in 2017. The other three directors and their year of appointment are: Michael Moule (senior independent director, 2004), William Eason (2007) and Dr Michael Woodward (2013). All the directors have backgrounds in investment management and investment trusts.
|
|
Investment Companies
Research: Investment Companies
Heliad Equity Partners (Heliad) achieved a NAV total return of 47.3% in 2017, driven by the strong performance of its listed holdings, including its largest investment, FinTech Group. Diversification continued in 2017, with some of Heliad’s listed holdings reduced to fund new investments in Sleepz, Elumeo and Urbanara. In 2018, Heliad has invested in Cyan and merged Cubitabo into Sleepz. The portfolio now comprises seven listed investments and eight private equity investments, all operating within the technology and digital brands market segments. While NAV declined in the first quarter of 2018, Heliad’s listed investments have recovered strongly so far in the second quarter, and the manager expects strong growth in the value of portfolio companies to drive NAV higher over the full year.