Last close As at 05/08/2026
—
— 0.00 (0.00%)
Market capitalisation
—
Research: Investment Companies
The European Investment Trust
Written by
The European Investment Trust |
Business as usual under new manager |
Investment trusts |
26 October 2016 |
Share price/discount performance
Three-year performance vs index
Gearing
Analysts
|
|||||||||||||||||||||||||||||||||||||||||||||||||||||||||||||||||||||||||||||||||||||
The European Investment Trust (EUT) aims to provide long-term growth in capital from a diversified portfolio of European ex-UK equities. There has recently been a change in lead fund manager; however, Craig Armour follows the tried and tested Edinburgh Partners investment process, which aims to select stocks based on a five-year P/E multiple (Y5 P/E). Evidence suggests the best performing stocks have a Y5 P/E of less than 11x; EUT’s portfolio currently has an average Y5 P/E of c 9x. Although the primary focus is on capital growth rather than income, ordinary dividends have been maintained or increased since 2009; the current dividend yield (including a special dividend) of 2.1% is above the peer group average.
12 months ending |
Share price |
NAV |
Benchmark |
FTSE All-Share |
MSCI World |
30/09/12 |
13.6 |
12.1 |
12.5 |
17.2 |
18.0 |
30/09/13 |
38.6 |
28.9 |
27.1 |
18.9 |
20.6 |
30/09/14 |
12.1 |
6.4 |
5.3 |
6.1 |
12.7 |
30/09/15 |
(8.3) |
(5.5) |
(1.8) |
(2.3) |
2.1 |
30/09/16 |
9.8 |
14.9 |
21.8 |
16.8 |
30.6 |
Source: Thomson Datastream. Note: All % on a total return basis in GBP.
Investment strategy: Seeking long-term value
Manager Craig Armour applies Edinburgh Partners’ disciplined investment process, selecting stocks using detailed fundamental analysis to determine five-year earnings estimates. The process is based on analysis that indicates stock prices are correlated with inflation-adjusted five-year earnings performance, although over shorter time periods stock price moves are more random. The resulting portfolio typically comprises 35-50 holdings and over the last 20 years the average Y5 P/E of the portfolio has ranged between 7x and 11x. EUT measures its performance against the FTSE All World Europe ex-UK index; its sector and geographic exposure may vary considerably versus the benchmark.
Market outlook: Europe is relatively cheaper
In its latest World Economic Outlook, the International Monetary Fund (IMF) has recently raised growth estimates for continental Europe. 2016 estimates are now broadly in line with those for the UK and US. However, looking at forward earnings multiples, European equities are less stretched than those in both the UK and the US. For investors wanting exposure to the area, a fund with a long-term, disciplined investment process may be of interest.
Valuation: Wider than historical averages
EUT’s current share price discount to cum-income NAV of 15.9% is wider than the averages of the last one, three, five and 10 years. There is scope for the discount to narrow if EUT’s performance versus the benchmark improves, or if there is greater investor demand for European equities. Although EUT’s primary aim is capital growth rather than income, ordinary dividends have compounded at an average annual rate of 5.4% since 2009. In addition, special dividends are paid regularly; the current dividend yield of 2.1% is above the 1.8% peer group average.
Exhibit 1: Trust at a glance
Investment objective and fund background |
Recent developments |
||||||||||||||||||||||||||||||||||||||||||||||||||||||||||||||||||||||
The European Investment Trust (EUT) seeks long-term capital growth through investment in a diversified portfolio of continental European securities. The trust was launched in 1972 and management was transferred to Edinburgh Partners on 1 February 2010 following a tender process. The manager follows a disciplined, long-term value management approach. The trust has an indefinite life and is not subject to a periodic continuation vote. |
■ 28 August 2016: Appointment of Craig Armour as portfolio manager, succeeding Dale Robertson. ■ 27 May 2016: Six-months report to 31 March 2016. NAV TR 2.2% versus benchmark TR 6.9%. Share price TR -1.0%. ■ 11 February 2016: Entered into €30m overdraft credit facility with The Northern Trust Company. |
||||||||||||||||||||||||||||||||||||||||||||||||||||||||||||||||||||||
Forthcoming |
Capital structure |
Fund details |
|||||||||||||||||||||||||||||||||||||||||||||||||||||||||||||||||||||
AGM |
January 2017 |
Ongoing charges |
0.63% |
Group |
Edinburgh Partners |
||||||||||||||||||||||||||||||||||||||||||||||||||||||||||||||||||
Annual results |
November 2016 |
Net gearing |
3.0% |
Manager |
Craig Armour |
||||||||||||||||||||||||||||||||||||||||||||||||||||||||||||||||||
Year end |
30 September |
Annual mgmt fee |
0.55% of market cap |
Address |
27-31 Melville Street, |
||||||||||||||||||||||||||||||||||||||||||||||||||||||||||||||||||
Dividend paid |
January |
Performance fee |
None |
||||||||||||||||||||||||||||||||||||||||||||||||||||||||||||||||||||
Launch date |
1972 |
Trust life |
Indefinite |
Phone |
+44 (0) 131 270 3800 |
||||||||||||||||||||||||||||||||||||||||||||||||||||||||||||||||||
Continuation vote |
None |
Loan facilities |
€30m |
Website |
|||||||||||||||||||||||||||||||||||||||||||||||||||||||||||||||||||
Dividend policy and history |
Share buyback policy and history |
||||||||||||||||||||||||||||||||||||||||||||||||||||||||||||||||||||||
The investment objective is to seek long-term capital growth so dividend yield is not the primary aim. Dividends are paid annually in January. |
EUT is authorised both to repurchase up to 14.99% of its ordinary shares and to allot shares up to 5% of the issued share capital. |
||||||||||||||||||||||||||||||||||||||||||||||||||||||||||||||||||||||
|
|
||||||||||||||||||||||||||||||||||||||||||||||||||||||||||||||||||||||
Shareholder base (as at 7 October 2016) |
Portfolio exposure by geography (as at 30 September 2016) |
||||||||||||||||||||||||||||||||||||||||||||||||||||||||||||||||||||||
|
|
||||||||||||||||||||||||||||||||||||||||||||||||||||||||||||||||||||||
Top 10 holdings (as at 30 September 2016) |
|||||||||||||||||||||||||||||||||||||||||||||||||||||||||||||||||||||||
|
|||||||||||||||||||||||||||||||||||||||||||||||||||||||||||||||||||||||
Source: The European Investment Trust, Edison Investment Research, Bloomberg, Morningstar. Note: *N/A where not in September 2015 top 10.
Market outlook: European multiple relatively attractive
While the continental European economy has been weak following the global financial crisis, it is now recovering. In its latest World Economic Outlook, the International Monetary fund revised up its growth forecasts for 2016 and 2017 by 0.1pp in each year to 1.7% and 1.5% respectively. The estimate for 2016 of 1.7% is higher than for the US, which was revised down by 0.6pp to 1.6%, although lower than for the UK, which was revised up by 0.1% to 1.8%. Considering valuation in Exhibit 2 (right-hand side), while growth estimates are broadly comparable for continental Europe, the UK and the US in 2016, the valuation of Europe ex-UK equities is modestly more attractive than for UK and US equities. The forward P/E multiple of 13.6x, while 17% above the 10-year average, is not looking as stretched as UK and US equities, which are trading 26% and 19% respectively above their 10-year averages. For investors wishing to have exposure to European equities, a fund with a disciplined, long-term valuation focus may be appealing.
|
Exhibit 2: Market performance and valuation |
|||||||||||||||||||||||||||||||
Performance of indices, last 10 years |
Forward P/E multiples of Datastream indices |
||||||||||||||||||||||||||||||
|
|
||||||||||||||||||||||||||||||
|
Source: Thomson Datastream, Edison Investment Research. Note: Data to 19 October 2016. |
|||||||||||||||||||||||||||||||
Fund profile: Adheres to Edinburgh Partners’ process
EUT was launched in 1972 as Foreign & Colonial Eurotrust. Since February 2010, it has been managed by Edinburgh Partners (EP), aiming to generate long-term capital growth from a diversified portfolio of European ex-UK equities. Since August 2016, the trust has been managed by Craig Armour, who had worked with his predecessor Dale Robertson for five years. There has been no change in the overall approach; EUT continues to follow the EP investment philosophy. Developed by EP’s founder Sandy Nairn, who previously worked with Sir John Templeton, EP’s strategy seeks to identify undervalued stocks based on five-year earnings projections. The belief is that the stock market is too short-term focused, which leads to random stock price movements; companies should be valued on their ability to generate future profits over the course of a business cycle, rather than valued on their past performance. EUT typically holds 35-50 stocks and measures its performance against the FTSE All-World Europe ex-UK index. Gearing of up to 20% of net assets is permitted and currency may be hedged, although this facility has not been utilised.
The fund manager: Craig Armour
The manager’s view: A step closer to a ‘normal’ environment
Manager Craig Armour comments that in the years since the financial crisis, global monetary policy has been very accommodative to avoid a repeat of the deflationary period in the 1930s. There have been unintended consequences such as ultra-low bond yields, low bank earnings, higher pension deficits and some misallocation of capital. He suggests this environment is starting to come to an end and the fear about deflation is genuinely starting to recede. Evidence of inflation includes commodity prices, which are higher year-on-year, and signs of increasing wage costs, particularly in the US; some of which are politically driven, such as the minimum wage legislation.
Armour says that the current business cycle is elongated following the global financial crisis, and he is happy to be invested in depressed areas of the stock market such as banks, where he sees the prospect of higher dividend yields. He notes that bank balance sheets have been repaired and capital ratios rebuilt. Once interest rates normalise, banks should be able to make reasonable net interest margins; the manager suggests that they can once more achieve 8-10% returns on equity.
Another sector that the manager favours is oil & gas, although he admits that the trust was somewhat early increasing exposure to the sector. EP’s analysis showed that despite the impact of energy efficiency, the global demand outlook remained robust. However, the growth in North American shale production and higher OPEC output meant that the industry became oversupplied. The resulting weak commodity prices have led to lower industry capex and a greater focus by energy companies on operational costs in a bid to maintain their dividends. There is evidence that oil & gas supply and demand is now more balanced, and prices have risen meaningfully from their low points in early 2016. EUT has a holding in seismic company Petroleum Geo-Services, which has said business is starting to recover as oil companies are signing contracts with a view to increasing capex in coming years.
Armour is bullish on the healthcare sector. EP took a cautious view on pharma companies in 2012/13 based on the 2016/17 patent cliff. Since then there has been an increase in quality of research and development at pharma and biotech companies. Share price weakness in 2016 has partly been politically driven following egregious price increases by Turing and Valeant Pharmaceuticals, although companies that are developing products that prolong or save lives will continue to have pricing power. The manager favours pharma over biotech stocks as they are less risky, fit the valuation focus of EUT and pay regular dividends. There is also potential upside from M&A activity.
|
Exhibit 3: Value has outperformed long term, but significantly underperformed recently |
|
|
Source: Thomson Datastream, Edison Research. Note: 6 October 1976 to 6 October 2016. |
As shown in Exhibit 3, despite outperforming over the long term, in recent years value stocks have significantly underperformed growth stocks. This has affected the relative performance of EUT versus its benchmark. The manager suggests that extremes in style do not continue indefinitely and that the current environment offers an opportunity for patient investors who are mindful of valuation. An area of the market where he suggests caution is consumer staples; investors are paying high valuations for perceived ‘safety’ stocks, which offer yields above those available from bonds. P/E multiples in this sector have reached levels reminiscent of the peaks seen in 2009 and 2012.
Asset allocation
Investment process: Disciplined and valuation based
EUT applies EP’s disciplined, valuation-based investment process. Developed by EP’s founder Sandy Nairn, who previously worked with Sir John Templeton, the process works on the assumption that future earnings growth is the best predictor of share price returns. The stock market is seen as rational over five-year periods but over shorter time periods the correlations between earnings growth and stock prices have proved to be random. The manager and his team, which comprises 12 analysts and portfolio managers (who have individual sector responsibilities) and three applied research specialists, conduct detailed bottom-up analysis on companies to derive five-year inflation-adjusted earnings forecasts for potential investments, resulting in a Y5 P/E. Having come from a private equity background, the manager is particularly focused on the analysis of a company’s potential cash flow. EP’s analysis has shown that above-average real returns can be generated when companies are purchased at a Y5 P/E below 11x. Over the last 20 years, the average Y5 P/E of EUT’s portfolio has ranged between 7x and 11x; it is currently at a mid-range level of c 9x. The manager is very disciplined in sticking to the EP process, which has been tried and tested; however, this may lead to periods of underperformance versus the benchmark and investors should be prepared to have a long-term investment horizon.
Current portfolio positioning
At end-September 2016, the top 10 positions represented 36.5% of the portfolio versus 33.9% at end-September 2015; seven holdings were common to both periods.
Exhibit 4: Portfolio sector exposure vs benchmark (% unless stated)
Portfolio end-September 2016 |
Portfolio end- September 2015 |
Change (pp) |
Index weight |
Active weight vs index (pp) |
Trust weight/ index weight (x) |
|
Industrials |
22.3 |
13.0 |
9.4 |
13.2 |
9.2 |
1.7 |
Financials |
21.0 |
24.0 |
-3.0 |
20.2 |
0.7 |
1.0 |
Oil & gas |
12.0 |
11.9 |
0.2 |
7.9 |
4.2 |
1.5 |
Healthcare |
10.0 |
10.1 |
-0.1 |
12.4 |
-2.4 |
0.8 |
Consumer services |
8.3 |
7.6 |
0.7 |
7.2 |
1.0 |
1.1 |
Consumer goods |
7.3 |
6.7 |
0.6 |
19.6 |
-12.3 |
0.4 |
Telecoms |
6.8 |
9.6 |
-2.8 |
4.3 |
2.5 |
1.6 |
Basic materials |
6.5 |
6.3 |
0.2 |
7.8 |
-1.3 |
0.8 |
Technology |
3.1 |
8.3 |
-5.2 |
3.4 |
-0.3 |
0.9 |
Utilities |
2.7 |
2.5 |
0.2 |
4.0 |
-1.3 |
0.7 |
100.0 |
100.0 |
100.0 |
Source: The European Investment Trust, Edison Investment Research
Looking at sector exposure in Exhibit 4, over the last 12 months the largest increase is in industrials; this is also the largest active bet, representing 22.3% of the portfolio versus 13.0% of the benchmark. The largest decreases in exposure are in technology and financials.
A relatively new position is video game developer Ubisoft Entertainment. It was purchased in January 2016 and has since been a significant contributor to performance. The manager considers that the company has a number of high-quality franchises and its successful game releases can be repeated. Ubisoft’s margins are below those of its competitors, but should improve as it builds scale and increases revenues from high-margin, in-game purchases. There is also an element of bid speculation as Vivendi has amassed a greater than 20% shareholding in Ubisoft.
Two recent changes in the portfolio have been the purchase of Telefonica and the sale of Hexagon. Spanish telecom company Telefonica has businesses spread across Spain, Latin America (particularly Brazil) and Germany. The manager suggests that business in Spain is improving; Telefonica is the incumbent operator with the best cable assets. The Latin American businesses are also improving and German operations are stable. Although Telefonica is heavily indebted the manager has modelled a dividend cut into his five-year forecasts and still sees value in the company; it was purchased on a Y5 P/E of 9.0x. Swedish geospatial measurement company Hexagon was sold on valuation grounds, having reached a Y5 P/E of 13.5x. Following the purchase of Intergraph Software, which added to service revenues, investors view Hexagon more as a higher-valued technology rather than as an industrial stock.
Performance: Affected by growth stocks outperforming
Over the last 12 months to end-September 2016 on a sector basis, the largest positive contribution to performance was industrial goods & services (+5.0pp) and technology (+2.7pp), while the largest detractors were financial services (-1.7pp) and insurance (-1.1pp). On an individual stock basis the top contributors were PostNL (+1.9pp), IPSOS and Ubisoft Entertainment (both +1.8pp), while the largest detractors were GAM Holding (-1.1pp) and Petroleum Geo-Services (-0.9pp).
|
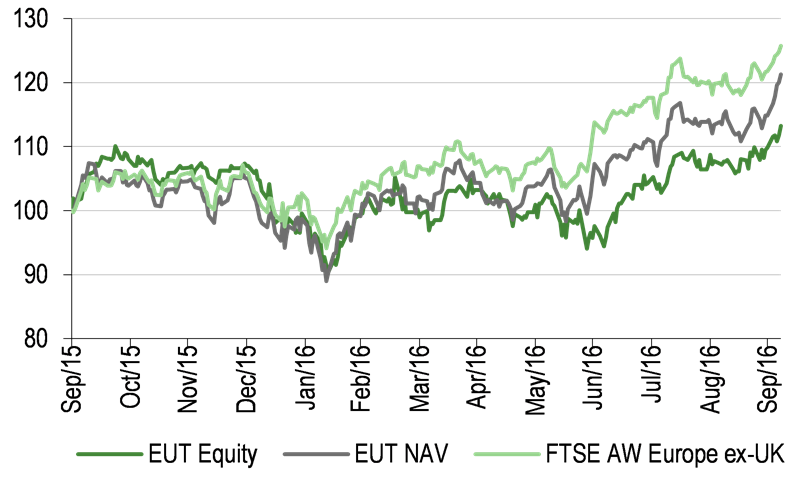
Exhibit 5: Investment trust performance to 30 September 2016 |
|
Price, NAV and benchmark total return performance, one-year rebased |
Price, NAV and benchmark total return performance (%) |
|
|
|
Source: Thomson Datastream, Edison Investment Research. Note: SI is since inception (1 February 2010). Three, five and SI performance figures annualised. |
|
Exhibit 5 shows that in absolute terms, EUT’s NAV and share price total returns have been strong; over five years its average annual returns are 10.8% and 12.2% respectively. In relative terms, EUT’s NAV has lagged the benchmark over most of the periods shown in Exhibit 6; in recent years the outperformance of growth versus value stocks has been a significant contributing factor. Over three months, EUT’s NAV total return is modestly above the benchmark’s and since the end of September, one of EUT’s holdings, Dutch financial services company Delta Lloyd has received a bid approach. Dutch insurer NN Group has offered an all cash price of €5.30 per share; this is a 29% premium to Delta Lloyd’s pre-bid share price and has had a positive impact on EUT’s relative performance.
|
Exhibit 6: Share price and NAV total return performance, relative to indices (%) |
|||||||
|
One month |
Three months |
Six months |
One year |
Three years |
Five years |
SI |
Price relative to FTSE AW Europe ex-UK |
(0.7) |
5.2 |
(2.6) |
(9.8) |
(10.4) |
(1.3) |
(2.4) |
NAV relative to FTSE AW Europe ex-UK |
(0.5) |
0.3 |
(1.4) |
(5.7) |
(8.3) |
(7.3) |
(4.7) |
Price relative to FTSE All-Share |
(0.6) |
6.5 |
(1.7) |
(6.0) |
(6.8) |
5.1 |
(9.0) |
NAV relative to FTSE All-Share |
(0.4) |
1.5 |
(0.5) |
(1.7) |
(4.6) |
(1.2) |
(11.2) |
Price relative to MSCI World |
(0.4) |
6.2 |
(5.6) |
(15.9) |
(24.9) |
(17.0) |
(28.5) |
NAV relative to MSCI World |
(0.2) |
1.3 |
(4.5) |
(12.1) |
(23.2) |
(22.0) |
(30.2) |
|
Source: Thomson Datastream, Edison Investment Research. Note: Data to end-September 2016. Geometric calculation. |
|||||||
Discount: Wider than three-year average
EUT’s current share price discount to cum-income NAV of 15.9% is wider than the 10.7% average of the last 12 months (range of 3.2% to 18.1%). It is also wider than the averages of the last three, five and 10 years (8.9%, 11.4% and 12.8% respectively). There is scope for the discount to narrow if relative performance improves or if there is greater investor appetite for European equities.
|
Exhibit 7: Share price discount to NAV (including income) over three years (%) |
|
|
Source: Thomson Datastream, Edison Investment Research |
Capital structure and fees
EUT is a conventional investment trust with one class of share; there are currently 42.0m ordinary shares outstanding. It has authority to buy back up to 14.99% or allot up to 5% of shares to manage a discount or premium. Having been relatively inactive since 2012, from August 2016 EUT has been repurchasing shares at a modest rate. A new €30m overdraft facility was announced on 11 February 2016; at end-September 2016, net gearing was 3.0%.
EP receives an annual management fee of 0.55% of EUT’s market cap; there is no performance fee. Ongoing charges in FY15 were 0.63%, a modest increase versus 0.61% in FY14 but lower than the 0.92% peer group average.
Dividend policy and record
EUT aims to generate long-term capital growth rather than income. However, ordinary dividends have grown or been maintained since 2009, compounding at an average annual rate of 5.4%; these are supplemented by special dividends, which are dependent on the level of portfolio income.
Dividends are paid annually in January. For FY15 total dividends of 16p (14p ordinary plus 2p special) were 6.7% higher than FY14 total dividends (14p ordinary plus 1p special). In FY15 the ordinary dividend was 1.14x covered versus 1.06x in the prior year. At the last financial year end there was a revenue reserve of £11.0m, equivalent to 26.1p per share. Based on the current share price EUT’s dividend yield is 2.1%.
Peer group comparison
EUT is one of the larger of the eight investment trusts in the AIC Europe sector. Its NAV total returns have lagged the peers’ over the periods shown in Exhibit 8. Risk adjusted returns measured by the Sharpe ratio are below average over one and three years. The weaker investment performance is reflected in the discount, where EUT has one of the widest in the sector. Its dividend yield is above the peer group average and its ongoing charge is the lowest in the group, c 30bp below average.
Exhibit 8: AIC Europe peer group as at 25 October 2016
% unless stated |
Market cap £m |
NAV TR 1 Year |
NAV TR 3 Year |
NAV TR 5 Year |
NAV TR 10 Year |
Sharpe 1y (NAV) |
Sharpe 3y (NAV) |
Discount (ex-par) |
Ongoing charge |
Perf. fee |
Net gearing |
Dividend yield (%) |
European Investment Trust |
319.5 |
16.9 |
14.7 |
65.8 |
45.2 |
(0.4) |
(0.3) |
(14.1) |
0.63 |
No |
103 |
2.1 |
BlackRock Greater Europe |
292.5 |
21.5 |
30.1 |
94.6 |
124.7 |
(0.1) |
0.0 |
(3.6) |
0.89 |
No |
101 |
1.7 |
Fidelity European Values |
769.4 |
20.1 |
31.5 |
95.2 |
102.9 |
(0.1) |
0.1 |
(11.4) |
0.94 |
No |
103 |
1.8 |
Henderson European Focus Trust |
225.6 |
20.5 |
43.3 |
121.4 |
160.5 |
(0.1) |
0.3 |
(8.2) |
0.89 |
Yes |
106 |
2.3 |
Henderson EuroTrust |
198.1 |
22.8 |
38.9 |
110.4 |
160.4 |
(0.1) |
0.2 |
(9.8) |
0.86 |
Yes |
103 |
2.0 |
JPMorgan European Growth Pool |
199.2 |
18.4 |
30.2 |
94.9 |
84.0 |
(0.2) |
0.1 |
(11.9) |
1.07 |
No |
101 |
2.2 |
JPMorgan European Income Pool |
124.9 |
22.4 |
36.2 |
102.3 |
118.8 |
(0.1) |
0.1 |
(14.4) |
1.09 |
No |
102 |
3.5 |
Jupiter European Opportunities |
637.1 |
10.0 |
43.0 |
131.5 |
244.7 |
(0.4) |
0.4 |
(5.6) |
0.98 |
Yes |
115 |
1.0 |
Weighted average |
17.7 |
33.7 |
103.6 |
139.4 |
(0.2) |
0.1 |
(9.3) |
0.91 |
106 |
1.8 |
||
EUT rank in sector |
3 |
7 |
8 |
8 |
8 |
8 |
8 |
7 |
8 |
3 |
4 |
Source: Morningstar, Edison Investment Research. Note: TR=total return. Sharpe ratio is a measure of risk-adjusted return. The ratios shown are calculated by Morningstar for the past 12- and 36-month periods by dividing a fund’s annualised excess returns over the risk-free rate by its annualised standard deviation. Net gearing is total assets less cash and equivalents as a percentage of net assets.
The board
There are five members on the board at EUT; all are non-executive and independent of the manager. Chairman Douglas McDougall was appointed a director in 1999 and took up his current position that year. Michael Moule is the senior independent director; he was appointed in 2004. William Eason was appointed in 2007 and Dr Michael Woodward in 2013. The newest member of the board is Michael MacPhee; he was appointed in January 2016. The directors have extensive experience in investment management and investment trusts.
|
|
Investment Companies
Research: Metals & Mining
Alkane Resources