Last close As at 05/08/2026
—
— 0.00 (0.00%)
Market capitalisation
—
Research: Investment Companies
HarbourVest Global Private Equity (HVPE) posted an NAV decrease of 0.7% between July 2019 (last interim results) and May 2020, largely due to the COVID-19 induced market downturn in March (ytd NAV performance since end-2019 was a 4.8% decline). Although increased capital calls left HVPE with a historically low coverage ratio, we perceive HVPE’s liquidity (supported by its US$600m credit facility) as sufficient to cover near-term commitments. HVPE withstood the 2008 global financial crisis (GFC) well compared to the broad public market and enters the current turmoil with high exposure to resilient sectors such as tech and software and healthcare.
|
Secured liquidity |
Investment trusts |
19 June 2020 |
Share price/discount performance
Three-year performance vs index
Gearing
Analysts
|
|||||||||||||||||||||||||||||||||||||||||||||||||||||||||||||||||||||||||||||||||||||
HarbourVest Global Private Equity (HVPE) posted an NAV decrease of 0.7% between July 2019 (last interim results) and May 2020, largely due to the COVID-19 induced market downturn in March (ytd NAV performance since end-2019 was a 4.8% decline). Although increased capital calls left HVPE with a historically low coverage ratio, we perceive HVPE’s liquidity (supported by its US$600m credit facility) as sufficient to cover near-term commitments. HVPE withstood the 2008 global financial crisis (GFC) well compared to the broad public market and enters the current turmoil with high exposure to resilient sectors such as tech and software and healthcare.
|
HVPE outperforms market through economic cycles |
|
|
Source: Refinitiv, HVPE, Edison Investment Research |
The market opportunity
In the current environment of significant economic uncertainty, HVPE offers a combination of consistently strong historical returns through the economic cycle as well as exposure to a wide range of PE-sponsored companies. HVPE’s exposure to real assets (with a focus on infrastructure) may provide additional diversification while delivering stable income and capital preservation (assuming assets perform in line with expectations).
Why consider investing in HVPE?
■
Investment manager’s extensive experience (>35 years).
■
Strongly diversified across vintage, region, strategy, sector, stage and manager, with low underlying portfolio exposure to the UK.
■
High exposure to the primary strategy (48% of NAV), giving access to best-in-class private equity (PE) managers.
■
Long-term risk-adjusted returns ahead of the peer group.
Widened discount in line with the market
HVPE’s discount of 25.4% to the company-estimated end-May NAV compares to its five-year average of 20.7%. The wider discount is a common feature among PE investment companies given the macro uncertainty. That said, HVPE’s NAV is largely based on end-March valuations and therefore mostly captures the drop in market multiples.
Exhibit 1: Company at a glance
Investment objective and fund background |
Recent developments |
|||||||||||||||||||||||||||||||||||||||||||||||||||||||||||||||||
HarbourVest Global Private Equity is a Guernsey-incorporated, LSE-listed, closed-ended investment company. Its investment objective is to generate superior shareholder returns, relative to global listed equities, through long-term capital appreciation by investing primarily in a diversified portfolio of private markets investments. Performance is benchmarked against the FTSE All-World index. |
■ 19 June 2020: estimated NAV per share in May at US$25.62 (down 6.0% during the month). ■ 29 April 2020: annual results publication date postponed to 24 June 2020. ■ 23 October 2019: release of H119 results. ■ 1 August 2019: Edmond Warner joined the board as a non-executive director. ■ 29 May 2019: Carolina Espinal joined the board as a non-executive director. |
|||||||||||||||||||||||||||||||||||||||||||||||||||||||||||||||||
Forthcoming |
Capital structure |
Fund details |
||||||||||||||||||||||||||||||||||||||||||||||||||||||||||||||||
AGM |
July 2020 |
Ongoing charges |
1.46% (LTM H120 ex perf fees) |
Group |
HarbourVest Partners LLC |
|||||||||||||||||||||||||||||||||||||||||||||||||||||||||||||
Annual results |
24 June 2020 |
Net cash |
0.7% (end-May 2020) |
Manager |
HarbourVest Advisers LP |
|||||||||||||||||||||||||||||||||||||||||||||||||||||||||||||
Year end |
31 January |
Annual mgmt fee |
0.85% at funds level (LTM H120) |
Address |
BNP Paribas House, St Julian’s Avenue, St Peter Port, Guernsey, GY1 1WA |
|||||||||||||||||||||||||||||||||||||||||||||||||||||||||||||
Dividend paid |
N/A |
Performance fee |
Secondary invts and direct co-invts only |
|||||||||||||||||||||||||||||||||||||||||||||||||||||||||||||||
Launch date |
6 December 2007 |
Company life |
Indefinite |
Phone |
+44 (0)1481 750 800 |
|||||||||||||||||||||||||||||||||||||||||||||||||||||||||||||
Continuation vote |
N/A |
Loan facilities |
US$600m |
Website |
||||||||||||||||||||||||||||||||||||||||||||||||||||||||||||||
Dividend policy and history (financial years) |
Age of the investment pipeline (31 July 2019) |
|||||||||||||||||||||||||||||||||||||||||||||||||||||||||||||||||
HVPE has authority to purchase up to 14.99% of its issued share capital. FY14 and FY15 costs reflect A share redemptions to distribute profits on the realisation of Absolute and Conversus co-investments. |
This analysis shows the age profile of HVPE’s investment pipeline excluding unallocated commitments. When commitments are made to underlying third-party funds or HarbourVest secondary or direct funds, they are classified as allocated. |
|||||||||||||||||||||||||||||||||||||||||||||||||||||||||||||||||
|
|
|||||||||||||||||||||||||||||||||||||||||||||||||||||||||||||||||
Shareholder base (at 7 May 2020) |
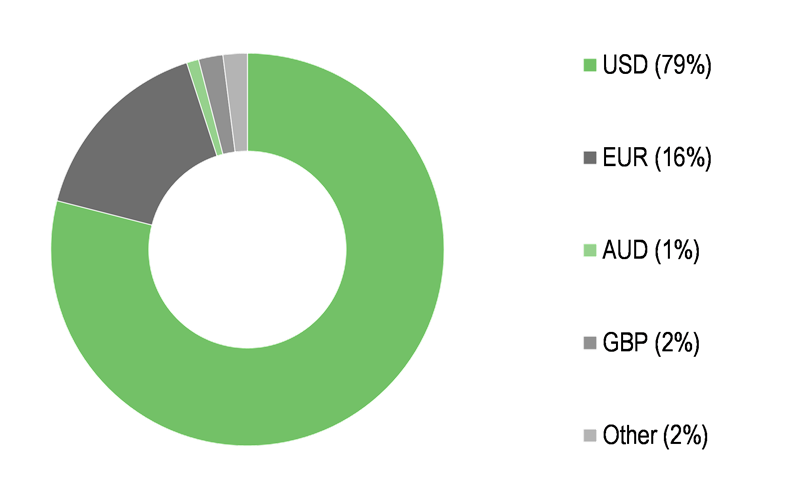
Currency exposure – underlying partnership funds (at 30 May 2020) |
|||||||||||||||||||||||||||||||||||||||||||||||||||||||||||||||||
|
|
|||||||||||||||||||||||||||||||||||||||||||||||||||||||||||||||||
Top 10 third-party managers within HVPE’s underlying portfolio |
(31 July 2019) |
|||||||||||||||||||||||||||||||||||||||||||||||||||||||||||||||||
|
||||||||||||||||||||||||||||||||||||||||||||||||||||||||||||||||||
Source: HarbourVest Global Private Equity, Edison Investment Research
Sufficient resources despite low coverage ratios
Compared to the GFC, which HVPE withstood relatively well (see above), the current portfolio is larger and more diversified as it consistently grew over the last 12 years from an NAV of US$0.8bn in September 2008 to US$2.0bn at end-May 2020. In our view HVPE’s liquidity position is at a safe level, despite the fact that coverage ratios are lower than at the brink of the previous crisis.
HVPE’s coverage ratio tends to be below direct PE peers due to longer investment cycles
HVPE’s total investment pipeline at end-May 2020 was US$1.7bn (slightly up since July 2019). This compares to US$214.7m of liquid resources held at the HVPE level, which is further supported by the US$400m remaining undrawn credit line. The above translates into a commitment coverage ratio of 36%. Due to its fund-of-funds structure, HVPE’s investment cycle is longer than that of many quoted PE peers and thus requires a relatively high level of unfunded commitments to remain fully invested. Its coverage ratio may therefore appear relatively low while not necessarily being associated with greater risk. Still, we note the current coverage ratio is below its historical levels of 49% on average over the last three years, or 67% in September 2008.
The above commitments include capital committed to HarbourVest funds that have not yet allocated capital to GPs. After excluding these, the allocated commitments amounted to US$1.4bn versus US$1.2bn at end-July 2019. The corresponding allocated coverage ratio is 44% (vs three-year average at 67% and 109% in September 2008). The comparatively lower coverage ratios versus historical levels are partially explained by the increasing diversification of HVPE’s portfolio and the need for a hefty investment pipeline to be fully invested. To provide better clarity for investors, HVPE also discloses the rolling coverage ratio, which only takes into account commitments expected to be drawn over the next three years. The ratio stood at 63% at end-May 2020 and has fallen 13pp since March 2020 due to higher drawdowns, as described below. Over 2019 the rolling coverage ratio oscillated around 76%.
Liquidity supported by US$600m open credit line of which US$400m is still undrawn
HVPE has a US$600m credit line provided by Mitsubishi UFG and Credit Suisse, which was extended from US$500m in December 2018. In May HVPE drew an initial tranche of US$200m to strengthen its short-term liquidity, as management expects a further mismatch between drawdowns and distributions in the coming months. It is worth noting that HarbourVest funds use leverage to delay and aggregate capital calls from limited partners, including HVPE. This embedded leverage attributable to HVPE was US$354.6m at end-May 2020 (17.3% of the NAV), up 10% since end-H120 in July 2019 when it was US$323.1m (16.2% of the NAV).
The company highlights that with the remaining US$400m undrawn credit facility, it is well placed to continue investing as planned. Although the pace of drawdowns and the time the M&A market will be required to return to normal activity is difficult to forecast, we present some additional approaches to assessing HVPE’s liquidity. Assuming the commitments that are expected to be drawn over three years are drawn equally in each year, HVPE’s resources cover investments over the next 12 months almost twofold without any realisations. If we assume the first-year drawdown is equal to the current embedded leverage at HarbourVest funds, it would imply that HVPE’s resources cover 179% of the assumed drawdown. The calculations do not include ongoing charges, but we note that expenses amounted to c US$11m per year (c 0.8% of NAV) on average over the last five years, while cash distributions averaged US$330m per year during the period. That said, the initial drawdown of US$200m will increase the ongoing costs by c US$3m according to our calculations, as the interest costs will replace the non-utilisation fee on the drawn amount. The credit facility limits HVPE’s indebtedness to 35% of assets, which according to our estimates allows for full drawdown even assuming an NAV deterioration in line with the most severe period of the GFC (down 27%).
Realisations continue even during market turmoil
Interestingly, during the GFC, while HVPE was a net investor in the fiscal years ended January 2009 and 2010, realisations did not fully stop. The net investment (drawdowns compared to distributions) amounted to 5.2% and 2.7% of the NAV at the beginning of respective periods. This compares to net realisations of 5.6% pa on average over the last five years and the size of HVPE’s credit facility to NAV at c 29%. HVPE does not pay dividends and it has not returned any capital to shareholders since FY15. Consequently, we believe that despite coverage ratios that may seem low at first glance, HVPE’s liquidity position is indeed secure.
Over the period since July 2019, HVPE has been a net investor with US$326m called by HarbourVest funds (adjusted for the US$42m commitments returned from the real assets vehicle), while realisations amounted to US$220m. This was largely driven by activity in the most recent months, as distributions to HVPE have come to a standstill during the coronavirus crisis, while PE funds have increasingly called for capital. We understand this may be due, in part, to underlying GPs calling for capital to support their existing portfolio companies and take advantage of the opportunities to deploy capital at lower valuations. In the year to date, this resulted in net outflows at the HVPE level of US$147m (or 6.8% of end-December 2019 NAV). While there were no distributions to HVPE during April and May 2020, the realisations within underlying portfolios did not fully stop. In April and May, 30 M&A and five IPO transactions were performed (resulting in proceeds from GPs to HarbourVest funds), of which the largest was the disposal of Zobele (agreed in February 2020) with US$2.7m distribution attributable to HVPE. Nevertheless, the 17 liquidity events of May 2020 compare to 29 per month on average throughout 2019. Until the pause in commitments announced on 21 May 2020, the company committed capital to new HarbourVest funds at a steady pace, with US$300m committed over the last 10 months (vs US$460m in the 10 months ending May 2019), including US$50m committed to a global secondary fund in March 2020.
The recent investment activity was largely in line with HVPE’s long-term strategy and targeted portfolio exposures, with 72% deployed into buyout funds (with its exposure at end-May 2020 still slightly below the 60% target) and about three-quarters in US-based funds (vs 58% actual and 65% targeted). Due to its multi-layer structure HVPE does not have the ability to quickly implement large changes to its portfolio structure and increase exposure to arising megatrends. In contrast, this also protects the trust against excessive exposure to ‘hot’ and overrated investment themes. That said, the portfolio remains broadly similar since its inception in 2007 in terms of sector and geographic exposure.
Current portfolio structure
HVPE’s portfolio is well diversified among GPs, vintages, sectors and underlying companies. HVPE is invested in over 50 HarbourVest funds that have access to over 8,500 GPs globally. At end-July 2019 the top 10 largest GPs within HVPE’s portfolio managed 22.9% of its capital. While it may happen that amid current market turmoil some GPs will need to sell investments to meet their liquidity requirements, the broad diversification of HVPE’s portfolio works as a limiting factor in our view. We note that ultimately HVPE had exposure to 9,160 underlying companies at end-July 2019, compared to 5,705 in January 2009.
Exhibit 5: Actual and target exposures (% of NAV at end-April 2020)
Investment stage |
Geography |
Phase |
||||||||
Actual |
Target |
Actual |
Target |
Actual |
Target |
|||||
Buyout |
55 |
60 |
US |
58 |
65 |
Investment |
48 |
25 |
||
Venture and growth equity |
34 |
30 |
Europe |
22 |
18 |
Growth |
41 |
50 |
||
Mezzanine and real assets |
11 |
10 |
Asia Pacific |
16 |
12 |
Mature |
11 |
25 |
||
Rest of world |
4 |
5 |
||||||||
Total |
100 |
100 |
100 |
100 |
100 |
100 |
Source: HarbourVest Global Private Equity
In terms of split by industry, we note that HVPE’s exposure to sectors that are likely to be the most and the least resilient in the current market environment is comparable with the broader market (as illustrated by MSCI World). It has a combined exposure of 46% to sectors that are more resilient to the current economic downturn, including tech and software, medical and biotech, and media and telecoms (vs 44% for IT, healthcare and communication services in case of MSCI World), while its exposure to industrial and transport and consumer is 26% (vs 30% for MSCI World covering consumer discretionary and staples, as well as industrials). We also note that its exposure to tech, software, media and biotech/healthcare sector is slightly below the levels on the start of the GFC in 2008 (57% at September 2008).
|
Exhibit 6: HVPE sector exposure (May 2020) |
Exhibit 7: MSCI World sector exposure (May 2020) |
|
|
|
Source: HarbourVest Global Private Equity |
Source: MSCI World May 2020 factsheet |
|
Exhibit 6: HVPE sector exposure (May 2020) |
|
|
Source: HarbourVest Global Private Equity |
|
Exhibit 7: MSCI World sector exposure (May 2020) |
|
|
Source: MSCI World May 2020 factsheet |
The infrastructure assets exposure constitutes an additional differentiating factor from HVPE’s UK listed PE fund-of-fund peers, which either have no explicitly stated direct exposure to real assets or it is limited to a low single-digit share of their portfolios (although we acknowledge their actual exposure on a look-through basis may be higher). They also may constitute a good inflation hedge in the case of inflation-linked or correlated revenues. HVPE’s investment manager highlighted in the past that it has identified good opportunities in this space associated with a capital maturity cliff, which forces some owners of good-quality assets to sell or restructure them. We note that HVPE’s mezzanine/real assets made up 15% of the portfolio at end-July 2019 (11% at end-May 2020) and included a single GP exposure to Corsair Capital, representing 6.7% of its portfolio, in which HVPE invested in March 2019. This included three assets:
■
DP World Australia (3.4% of the portfolio at end-July 2019) – an Australian container port operator that is part of global-scale DP World (which holds a c 60% stake in the company).
■
Itínere Infraestructuras (2.9%) – a toll road operator in Northern Spain, with six concessions under operation covering 524.8km and representing 15.6% of Spain’s total toll road network.
■
Vantage Airport Group (0.7%) – an investor, manager and developer of airports with a current portfolio of 10 assets globally, most of them in Canada.
PE funds at wide discounts
In our peer comparison table (Exhibit 8) we include six other members of the AIC Private Equity sector that also have portfolios mostly managed by third-party GPs. NAV total returns are in sterling terms and HVPE’s performance is ahead of the peer group averages over one, three, five and 10 years. HVPE trades at a discount in line with the peer average and its ongoing charge is comparable with the average within the group. The peer companies in the PE sector are subject to a lag in NAV performance just like HVPE (as described earlier) to various extents, as well as reporting periodicity of their respective NAVs. At the same time, as discussed above, HVPE’s May NAV already reflects most of the Q1 impact. Most of the peer companies incorporated the impact of market downturn from March on the majority of their portfolios as well, despite the fact that only HVPE and Standard Life Private Equity reported the NAV as at end-May. The exception is BMO Private Equity, where only 19% of portfolio reflects the decline (with average decrease of 7% in March). While the portfolio valuation of Pantheon International mostly reflects end-2019 data, the manager recently made provisions for expected losses at 7.8% of NAV, which is reflected in its performance. The remaining companies incorporated end-March valuations in the majority (77–98%) of underlying valuations. We believe the market possibly expects a degree of further deterioration in NAVs. This is clearly reflected in the high discounts to NAV, as the average of the peer group is now 29% compared to 17% when we published our previous report in September 2019. HVPE does not pay dividends, compared to the trailing yield of 3% by peers on average, but we note the dividend pay-out capacity is under pressure across the sector amid liquidity shortages throughout portfolio companies.
Exhibit 8: Private equity funds of funds peer group in pound sterling as at 17 June 2020*
% unless stated |
Market |
NAV TR |
NAV TR |
NAV TR |
NAV TR |
Discount |
Ongoing charge** |
Perf. |
Net |
Dividend |
HarbourVest Global Private Equity |
1,237.9 |
6.3 |
39.7 |
93.6 |
250.8 |
(25.4) |
1.5 |
Yes*** |
100 |
0.0 |
BMO Private Equity Trust |
247.7 |
10.6 |
28.9 |
80.3 |
165.4 |
(16.7) |
1.2 |
Yes |
133 |
4.4 |
ICG Enterprise Trust |
529.0 |
5.0 |
34.1 |
76.7 |
177.9 |
(30.2) |
1.4 |
Yes |
100 |
2.9 |
JPEL Private Equity |
110.6 |
(4.6) |
12.8 |
55.3 |
45.6 |
(33.9) |
1.2 |
Yes |
133 |
0.0 |
NB Private Equity Partners |
454.2 |
(2.2) |
22.3 |
70.3 |
170.4 |
(33.6) |
2.2 |
Yes |
104 |
5.0 |
Pantheon International |
1,070.0 |
(1.5) |
24.7 |
74.2 |
193.2 |
(27.3) |
1.2 |
Yes |
100 |
0.0 |
Standard Life Private Equity |
449.7 |
3.1 |
26.6 |
79.6 |
181.5 |
(31.6) |
1.1 |
No |
100 |
4.4 |
Peer group average |
476.9 |
1.7 |
24.9 |
72.7 |
155.7 |
(28.9) |
1.4 |
112 |
2.8 |
|
Rank |
1 |
2 |
1 |
1 |
1 |
2 |
2 |
4 |
5 |
Source: Morningstar, Edison Investment Research. Note: *Performance to end May 2020. TR = total return in sterling terms. Net gearing is total assets less cash and equivalents as a percentage of net assets (100 = ungeared). **Ongoing charge on the fund level, this excludes operating costs on underlying funds level (0.26% in HVPE). ***No performance fee is charged at HVPE level, but it is charged at the HarbourVest secondary and direct funds.
|
|
Research: TMT
With four acquisitions in FY19, CentralNic is a leading buy and build player in the domain name space, focused on consolidating a fragmented market. It offers a broad range of internet services, including reseller services, where it is the number two provider globally, as well as internet services to corporates and SMEs. Supported by underlying organic growth (6% company estimate), CentralNic has grown at a revenue CAGR of 69% from 2014–19 and has attractive cash flow dynamics with near 100% cash conversion and 92% repeat revenues. Q120 was in line with expectations and management has yet to see a material impact from COVID-19. The company is valued on an FY20 EV/EBITDA of 9.1x and a P/E of 15.7x, a 55% discount to its peer group, with our DCF indicating further share price upside. M&A should bring CentralNic’s multiples down further.