Last close As at 05/08/2026
—
— 0.00 (0.00%)
Market capitalisation
—
Research: Investment Companies
HarbourVest Global Private Equity (HVPE) has recorded a 12-month rise in NAV (based on a preliminary figure at end-July 2019) of 8.7%, which is a solid beat versus the public benchmark. Over the last six months, HVPE remained a net investor deploying US$202m into HarbourVest funds (compared to US$139m distributions), mostly on the back of the real assets deal in February. We note that despite HVPE’s limited UK portfolio exposure and long-term NAV outperformance vs UK equities, its short-term price returns are largely driven by the UK market sentiment.
HarbourVest Global Private Equity |
Opportunity amid UK market weakness |
Investment companies |
19 September 2019 |
Share price/discount performance
Three-year performance vs index
Gearing
Analyst
|
|||||||||||||||||||||||||||||||||||||||||||||||||||||||||||||||||||||||||||||||||||
HarbourVest Global Private Equity (HVPE) has recorded a 12-month rise in NAV (based on a preliminary figure at end-July 2019) of 8.7%, which is a solid beat versus the public benchmark. Over the last six months, HVPE remained a net investor deploying US$202m into HarbourVest funds (compared to US$139m distributions), mostly on the back of the real assets deal in February. We note that despite HVPE’s limited UK portfolio exposure and long-term NAV outperformance vs UK equities, its short-term price returns are largely driven by the UK market sentiment.
|
HVPE outperforming the FTSE 250, benefiting from its global exposure |
|
|
Source: Refinitiv, HarbourVest Global Private Equity, Edison Investment Research. Note: All figures based on total returns in sterling terms. |
The market opportunity
In the current late-cycle economic environment, HVPE offers a combination of consistently strong returns and diversification. HVPE’s increasing allocation to real assets (with a focus on infrastructure) may provide additional diversification while delivering a combination of stable income, capital gains and capital preservation. In the context of the current Brexit turmoil, we note that HVPE’s portfolio exposure to the UK is very limited (c 2% of NAV) and the company targets an increase in its exposure to the US market from the 55% to 65%.
Why consider investing in HVPE?
■
Investment manager’s extensive experience (>35 years).
■
Strongly diversified across vintage, region, strategy, sector, stage and manager.
■
High exposure to the primary strategy (44% of NAV), giving access to best in-class private equity (PE) managers.
■
Long-term risk-adjusted returns ahead of peer group.
■
Low underlying portfolio exposure to the UK.
Valuation: Discount affected by UK equity markets
HVPE’s share price discount of 16.1% to end-July NAV estimated by the company compares to its five-year average of 20.0%. We note the discount widens during periods of relative weakness of the FTSE compared to global markets, despite the limited exposure of the portfolio to UK-based companies. In the long run, however, the share price naturally follows NAV developments.
Exhibit 1: Company at a glance
Investment objective and fund background |
Recent developments |
|||||||||||||||||||||||||||||||||||||||||||||||||||||||||||||||||
HarbourVest Global Private Equity is a Guernsey-incorporated, LSE-listed, closed-ended investment company. Its investment objective is to generate superior shareholder returns, relative to global listed equities, through long-term capital appreciation by investing primarily in a diversified portfolio of private markets investments. Performance is benchmarked against the FTSE All-World index. |
■ 1 August 2019: Edmond Warner joined the board as a non-executive director. He is planned to succeed Sir Michael Bunbury as a chairman in July 2020. ■ 29 May 2019: Carolina Espinal joined the board as a non-executive director. ■ 29 May 2019: release of FY19 results. ■ 4 January 2019: credit facility enlarged to US$600m from US$500m. ■ 14 December 2018: introduction of US dollar quote on LSE under the ticker HVPD. |
|||||||||||||||||||||||||||||||||||||||||||||||||||||||||||||||||
Forthcoming |
Capital structure |
Fund details |
||||||||||||||||||||||||||||||||||||||||||||||||||||||||||||||||
AGM |
July 2020 |
Ongoing charges |
1.71% (FY19 ex perf fees) |
Group |
HarbourVest Partners LLC |
|||||||||||||||||||||||||||||||||||||||||||||||||||||||||||||
Interim results |
October 2019 |
Net cash |
4.4% (end-July 2019) |
Manager |
HarbourVest Advisers LP |
|||||||||||||||||||||||||||||||||||||||||||||||||||||||||||||
Year end |
31 January |
Annual mgmt fee |
0.83% at funds level (FY19) |
Address |
BNP Paribas House, St Julian’s Avenue, St Peter Port, Guernsey, GY1 1WA |
|||||||||||||||||||||||||||||||||||||||||||||||||||||||||||||
Dividend paid |
N/A |
Performance fee |
Secondary invts & direct co-invts only |
|||||||||||||||||||||||||||||||||||||||||||||||||||||||||||||||
Launch date |
6 December 2007 |
Company life |
Indefinite |
Phone |
+44 (0)1481 750 800 |
|||||||||||||||||||||||||||||||||||||||||||||||||||||||||||||
Continuation vote |
N/A |
Loan facilities |
US$600m (undrawn) |
Website |
||||||||||||||||||||||||||||||||||||||||||||||||||||||||||||||
Dividend policy and history (financial years) |
Age of the investment pipeline (31 January 2019) |
|||||||||||||||||||||||||||||||||||||||||||||||||||||||||||||||||
HVPE has authority to purchase up to 14.99% of its issued share capital. FY14 and FY15 costs reflect A share redemptions to distribute profits on the realisation of Absolute and Conversus co-investments. |
This analysis shows the age profile of HVPE’s investment pipeline (totalling US$1,563m including unallocated commitments). When commitments are made to underlying third-party funds or HarbourVest secondary or direct funds, they are classified as allocated. |
|||||||||||||||||||||||||||||||||||||||||||||||||||||||||||||||||
|
|
|||||||||||||||||||||||||||||||||||||||||||||||||||||||||||||||||
Shareholder base (as at 8 August 2019) |
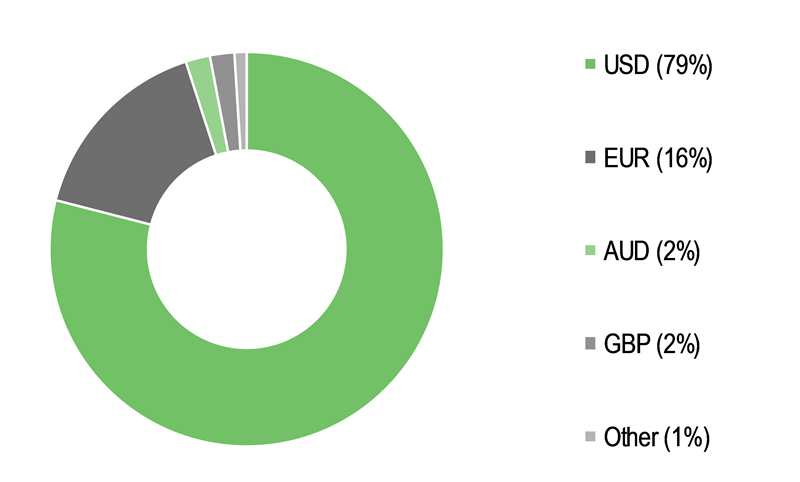
Currency exposure - underlying partnership funds (31 July 2019) |
|||||||||||||||||||||||||||||||||||||||||||||||||||||||||||||||||
|
|
|||||||||||||||||||||||||||||||||||||||||||||||||||||||||||||||||
Top 10 third-party managers within HVPE’s underlying portfolio |
(31 January 2019) |
|||||||||||||||||||||||||||||||||||||||||||||||||||||||||||||||||
|
||||||||||||||||||||||||||||||||||||||||||||||||||||||||||||||||||
Source: HarbourVest Global Private Equity, Edison Investment Research, Bloomberg.
Correlation to UK market despite a global portfolio
Even though HVPE has little exposure to the UK market, which represents c 2% of its NAV (for example, its US exposure stood at 55% at end-July 2019; see Exhibit 10), the company’s short-term share price performance (illustrated by its monthly returns) has exhibited relatively high correlation to the UK stock market returns expressed in sterling in recent years. Over the period ending August 2019 since December 2015 (HVPE’s inclusion in the FTSE 250 index), its Pearson’s correlation coefficient vs the FTSE 250 index stood at 0.48 compared with just 0.34 for the FTSE All-World index. Interestingly, this is broadly comparable with its major peers with higher portfolio exposure to the UK market, such as ICG Enterprise, BMO and, to a lesser extent, Standard Life Private Equity.
We believe this is largely the result of HVPE’s shares being included in the FTSE 250 index. This is confirmed by the fact that in the preceding four years (ie 2012–15), HVPE’s correlation coefficient with the FTSE 250 was close to 0 (0.01). Correlation with the FTSE All-World was unaffected, as shown by 0.35 correlation in the period.
|
Exhibit 2: Three-year rolling monthly returns correlation to FTSE 250: HVPE vs peers |
|
|
Source: Refinitiv, Edison Investment Research. Note: Peers include ICG Enterprise, BMO Private Equity, Standard Life Private Equity and Pantheon International. |
However, both HVPE’s share price and NAV performance over the last four years were more aligned with the global equity markets represented by the FTSE All-World index and clearly ahead of the FTSE 250 index in US dollar terms (see Exhibit 3). On the front page of this report, we show the respective performance in sterling terms. Still, HVPE’s discount to NAV seems to mirror the changes in the relative strength (or weakness) of UK equities vs global markets, as shown in Exhibit 4. We consider this a market inefficiency that may prove to be an interesting pattern in the context of the upcoming Brexit deadline at the end of October 2019.
|
Exhibit 3: Performance post FTSE 250 inclusion |
Exhibit 4: HVPE’s discount to NAV vs monthly relative performance of FTSE 250 to FTSE All-World |
|
|
|
Source: Refinitiv, HarbourVest Global Private Equity, Edison Investment Research. Note: All figures based on total returns in US dollars. |
Source: Refinitiv, HarbourVest Global Private Equity, Edison Investment Research |
|
Exhibit 3: Performance post FTSE 250 inclusion |
|
|
Source: Refinitiv, HarbourVest Global Private Equity, Edison Investment Research. Note: All figures based on total returns in US dollars. |
|
Exhibit 4: HVPE’s discount to NAV vs monthly relative performance of FTSE 250 to FTSE All-World |
|
|
Source: Refinitiv, HarbourVest Global Private Equity, Edison Investment Research |
Recent developments: Outperforming on an LTM basis
Since the beginning of this fiscal year (February 2019), HVPE’s NAV per share has risen 3.4% to US$24.92 at end-July 2019, somewhat behind its benchmark (FTSE All-World 6.6%). However, we note this is because the public market rebounded strongly at the beginning of the year following the Q418 sell-off, which had a limited impact on HVPE’s performance. Consequently, HVPE has grown its NAV in a more gradual and stable way since last year, with the last 12-month (LTM) NAV performance until end-July 2019 at 8.7% significantly ahead of the 0.7% return posted by the benchmark. Performance is based on HVPE’s estimated monthly NAV that is then overridden by actuals on semi-annual financial reports, once all data are collected. As a result, a significant part of the end-July estimate is based on fund valuations as at end-March 2019. These revisions have been positive over the last four years, with the January 2019 number revised up 3.4% vs the preliminary estimate.
HVPE focuses on performance measured in its functional currency, the US dollar. For UK investors, which HVPE estimates account for around 70% of the shareholder base, a strong sterling depreciation against the dollar has increased the NAV performance in sterling terms to 11.5% since January 2019 (see page 1 for the discrete 12-month performance in sterling terms).
Fees and operating expenses net of interest income contributed negative US$0.16 per share, in line with the corresponding period last year. This is a function of lower interest received, as HVPE has been deploying cash recently (net cash position down to 4.4% at end-July 2019 from 11.0% a year earlier), offset by lower fees to HarbourVest funds. We note that performance fees and operating expenses at the HarbourVest funds level are already included in gains on the valuation of these funds and are disclosed separately on a semi-annual basis. Overall, HVPE’s expense ratio has declined year-on-year from 2.90% to 2.37% in the most recent year ended January 2019 – this is down from nearly 5% since 2009. This is mostly attributable to the lower management fees at the HarbourVest fund level.
HVPE has no gearing at the moment and therefore does not bear any associated interest expense. However, it has an undrawn credit facility of US$600m, which is subject to a non-utilisation fee that is included in HVPE’s operating expenses and amounted to US$5.8m (or 0.4% of the NAV at end-January 2019). The facility was recently enlarged from US$500m, but due to more attractive terms, its cost remained broadly unchanged. The credit facility is not expected to be drawn under normal circumstances and is considered a working capital facility to bridge any potential gap between the timing of new investments (based on HVPE’s commitments) and realisations. On the other hand, some HarbourVest funds in which HVPE invests use leverage, which on a look-through basis amounted to US$273m at end-January 2019 (FY18: US$239m).
|
Exhibit 5: Movement in NAV per share (US$) in six months to 31 July 2019 |
|
|
Source: HarbourVest Global Private Equity monthly factsheets, Edison Investment Research. Note: *Revision from monthly estimate to final reported value. |
Commitments, cash investments and realisations
HVPE invests through a three-tier structure, with its investment commitments made to specific HarbourVest funds. During the first three to four years (investment phase), HarbourVest funds make commitments to a number of partnerships that in turn invest in operating companies. In years five to nine (growth phase), most HarbourVest funds are fully invested and actively driving growth. At end-July 2019, 53% of the portfolio is allocated to investment phase, with 33% and 14% allocated to growth and mature phases, respectively (see Exhibit 6). However, we note that the phase categorisation is attributable to the PE partnerships and not the companies in which they are invested. In fact, a meaningful part of distributions in the past came from funds categorised as investment and growth phases.
Between February and July 2019, HVPE deployed US$202m into HarbourVest funds while receiving US$139m in distributions, thus remaining a net investor in the period. This is largely attributable to the real assets deal struck in February as described in our previous note, which represented half of the invested amount during the period. Two notable distributions were recorded in the first half of HVPE’s fiscal year. In June, HVPE received US$43.1m in distributions, driven partly by an undisclosed amount received from the fund 2013 Direct distributing proceeds from the sale of Intelex Technologies, in which it invested alongside JMI Equity. The company was acquired by a strategic investor (Industrial Scientific) for c US$570m according to PRNewswire. Intelex was HVPE’s 25th largest underlying holding at end-January 2019 and contributed US$0.14 to HVPE’s NAVPS over the holding period since August 2015. In March 2019, distributions reached US$42.5m, of which US$9.2m came from Mezzanine Income Fund distributing proceeds from the sale of Five Star Foods. The fund co-invested in the company alongside PNC Riverarch Capital, and after a 2.5-year holding period, sold it to Freeman Spogli – a PE company focused on consumer and distribution companies. The company was one of the largest disclosed underlying holdings within HVPE’s direct co-investment strategy, making up 0.8% of the investment portfolio at end-January 2019.
|
Exhibit 6: Portfolio split by phase |
Exhibit 7: Monthly capital called for and distributed from HarbourVest funds (US$m) |
|
|
|
Source: HarbourVest Global Private Equity, Edison Investment Research |
|
Exhibit 6: Portfolio split by phase |
|
|
Source: HarbourVest Global Private Equity, Edison Investment Research |
|
Exhibit 7: Monthly capital called for and distributed from HarbourVest funds (US$m) |
|
|
Source: HarbourVest Global Private Equity, Edison Investment Research |
Over the six months ending July 2019, HVPE made US$315m of new commitments to HarbourVest funds, driving its investment pipeline up by 7.1% to US$1.7bn (and representing a commitment ratio at 179% of NAV at end-July 2019). This, coupled with steady deployment of cash, translated into a 7pp reduction in the coverage ratio to 41% (a commonly used measure of balance-sheet risk). HVPE underlines that its fund-of-funds structure makes its investment cycle longer than many quoted PE peers and thus requires a relatively high level of unfunded commitments to remain fully invested; its coverage ratio may therefore appear relatively low while not necessarily being associated with greater risk. HVPE calculates an alternative ratio, which includes expected capital calls over the next three years instead of the whole investment pipeline, and expected distributions from funds over next 12 months. This so-called ‘Rolling Coverage Ratio’ amounted to 78% at end-July 2019 (down 5pp since January) and compares to 85% and 105% at end FY18 and FY17, respectively.
Since January 2019, HVPE made commitments to six HarbourVest funds (see Exhibit 9). The funds represent various exposures and strategies. The largest commitment was made to HarbourVest Partners Fund XI Buyout – a US-focused buyout fund-of-funds. HVPE committed US$120m, or 38% of total H120 commitments to the fund. In line with its current market view, HVPE proceeds with increasing its exposure to real assets, committing US$50m to Real Assets IV in June.
|
Exhibit 8: Coverage ratios vs five-year average |
Exhibit 9: H120 commitments to HarbourVest funds |
|
|
|
Source: HarbourVest Global Private Equity, Edison Investment Research |
|
Exhibit 8: Coverage ratios vs five-year average |
|
|
Source: HarbourVest Global Private Equity, Edison Investment Research |
|
Exhibit 9: H120 commitments to HarbourVest funds |
|
|
Source: HarbourVest Global Private Equity, Edison Investment Research |
Portfolio positioning
In the following two exhibits, we summarise HVPE’s disclosure on portfolio positioning based on four criteria: investment stage, geography, strategy and industry. Exhibit 1 on page 2 shows the split of underlying funds by currency of denomination (79% US dollar) and an analysis of the investment pipeline by vintage (57.5% one to three years at end-January 2019). In Exhibit 10, we present the last-reported portfolio position (at end-July 2019) and the company’s five-year rolling strategic asset allocation targets (last revised in February 2018). This shows the predominance of buyout, US and primary investments, which in turn broadly mirrors the overall profile of the global PE industry.
Exhibit 10: Actual and target exposures (% of NAV at end-July 2019)
Investment stage |
Geography |
Strategy |
||||||||
Actual |
Target |
Actual |
Target |
Actual |
Target |
|||||
Buyout |
54 |
60 |
US |
55 |
65 |
Primary |
44 |
55 |
||
Venture and growth equity |
31 |
30 |
Europe |
21 |
18 |
Secondary |
34 |
25 |
||
Mezzanine and real assets |
15 |
10 |
Asia Pacific |
17 |
12 |
Direct |
22 |
20 |
||
Rest of world |
7 |
5 |
||||||||
Total |
100 |
100 |
100 |
100 |
100 |
100 |
Source: HarbourVest Global Private Equity
The current allocations have not changed materially since our last update note (based on end-April 2019 data), with a slight increase in exposure to mezzanine and real assets from 14% to 15% at the expense of buyout strategy. HVPE is actively seeking to increase its exposure to the primary strategy from the current 44% to 55%, as it provides HVPE access to managers with strong track records whose funds are less likely to be available on the secondary market.
Discount: Just below average levels
At 16.1% below HVPE’s estimate of net asset value, HVPE shares are trading at a discount that is wide in absolute terms but below the five-year average of c 20%. The discount widened towards the end of 2018, following equity markets and patterns explained earlier in the note, and returned to average values, as the share price reacted to consecutive monthly NAV positive developments. The reported NAV could be somewhat understated compared to possible value on realisations as HVPE has recorded an uplift on realisations vs NAV in excess of 30% over the last seven years (FY19: 41%). The management sees the discount as rather wide and has the authority to purchase shares from the market. Nonetheless, it does not intend to use this option, as it believes at this stage that the short-term benefits for shareholders from narrowing the discount in this way will not make up for lost opportunities due to reduced capital at HVPE’s disposal in the long run.
|
Exhibit 11: HVPE’s share price discount to NAV vs peers in US$ terms over three years (%) |
|
|
Source: Thomson Datastream, Edison Investment Research. Note: Peers include ICG Enterprise, Pantheon, JPEL, BMO Private Equity and Standard Life Private Equity. |
Peer-group comparison
In our peer comparison (Exhibit 12) we include six other members of the AIC Private Equity sector that also have a fund-of-funds structure. NAV total returns are in sterling terms and HVPE’s performance is ahead of the peer group averages over one, three, five and 10 years, leading the sector over all periods. HVPE trades at a discount slightly below the peer average and its ongoing charge is in line with the average within the group.
Exhibit 12: Private equity funds of funds peer group*
% unless stated |
Market |
NAV TR |
NAV TR |
NAV TR |
NAV TR |
Discount |
Ongoing charge** |
Perf. |
Net |
Dividend |
HarbourVest Global Private Equity |
1,373.6 |
17.3 |
56.3 |
133.4 |
333.8 |
(16.1) |
1.45 |
No*** |
100 |
0.0 |
BMO Private Equity Trust |
269.1 |
12.1 |
38.7 |
79.3 |
164.4 |
(5.3) |
1.30 |
Yes |
115 |
4.0 |
ICG Enterprise Trust |
602.9 |
5.8 |
44.7 |
73.8 |
210.9 |
(17.3) |
1.56 |
Yes |
100 |
2.5 |
JPEL Private Equity |
211.8 |
0.9 |
29.4 |
107.6 |
84.1 |
(21.5) |
1.32 |
Yes |
119 |
0.0 |
NB Private Equity Partners |
535.2 |
12.8 |
48.7 |
121.0 |
288.3 |
(23.9) |
2.06 |
Yes |
n.d. |
4.0 |
Pantheon International |
1,233.2 |
7.0 |
40.7 |
90.8 |
255.9 |
(17.2) |
1.22 |
Yes |
100 |
0.4 |
Standard Life Private Equity |
550.4 |
7.6 |
42.5 |
93.0 |
242.3 |
(18.1) |
1.10 |
No |
100 |
3.6 |
Peer group average |
567.1 |
7.7 |
40.8 |
94.2 |
207.7 |
(17.2) |
1.43 |
107 |
2.4 |
|
Rank |
1 |
1 |
1 |
1 |
1 |
2 |
3 |
3= |
6= |
Source: Morningstar, Edison Investment Research. Note: *Performance to end July 2019. TR = total return in sterling terms. Net gearing is total assets less cash and equivalents as a percentage of net assets (100 = ungeared). **Ongoing charge on the fund level, this excludes operating costs on underlying funds level (0.26% in HVPE). *** no performance fee is charged at HVPE level, but it is charged at the HarbourVest secondary and direct funds.
We have also examined HVPE’s risk-adjusted NAV returns vs selected peers, covering a period of around 11 years (ie, including the culmination of the financial crisis) and present our results in Exhibit 13. HVPE has outperformed its peers based on the Sharpe ratio in sterling terms in the analysed period. This is a function of higher returns generated at a broadly similar level of NAV volatility compared with other listed private equity investment companies. We acknowledge that the trust’s long investment cycle calls for a longer-term focused approach to examining its performance. HVPE has also outperformed the peer group with respect to the Sortino ratio, with the sole exception of the two-year period.
Exhibit 13: Private equity funds of funds peer group* risk-return ratios
1 year |
2 year |
3 year |
4 year |
5 year |
6 year |
7 year |
8 year |
9 year |
10 year |
Since April 2008 |
||
Sharpe ratio |
HVPE |
2.00 |
1.36 |
1.28 |
1.37 |
1.44 |
1.26 |
1.29 |
1.22 |
1.31 |
1.29 |
0.92 |
Peers average |
1.03 |
1.25 |
0.78 |
0.89 |
0.89 |
0.80 |
0.78 |
0.67 |
0.72 |
0.70 |
0.31 |
|
vs peers |
0.97 |
0.11 |
0.50 |
0.48 |
0.55 |
0.46 |
0.51 |
0.55 |
0.59 |
0.59 |
0.61 |
|
Sortino ratio |
HVPE |
5.08 |
2.39 |
2.67 |
3.59 |
3.80 |
3.26 |
3.29 |
3.20 |
3.23 |
2.84 |
1.46 |
Peers average |
3.95 |
3.90 |
1.55 |
1.74 |
1.73 |
1.65 |
1.56 |
1.17 |
1.30 |
1.29 |
0.33 |
|
vs peers |
1.13 |
-1.51 |
1.12 |
1.86 |
2.07 |
1.61 |
1.73 |
2.02 |
1.93 |
1.55 |
1.13 |
Source: Morningstar, Edison Investment Research. Note: *Peer group includes BMO Private Equity Trust, ICG Enterprise Trust, JPEL Private Equity, Pantheon International and Standard Life Private Equity. All calculations in sterling terms.
The board
HVPE has eight board directors, six of whom are independent. Chairman Sir Michael Bunbury has served on the board since October 2007 (shortly before HVPE’s launch in December 2007) and has decided to step down no later than the AGM in July 2020. This is in line with the AIC code, which suggests chairmen should not serve for a period materially in excess of nine years. On 1 August 2019, HVPE appointed Edmond Warner as a new director, with the intention to be appointed as chairman upon Sir Bunbury’s retirement. Edmond Warner has a broad financial services experience, including at IFX, Old Mutual, NatWest and Dresdner Kleinwort Benson. During the AGM held in July 2019, two members of the board – Brooks Zug and Keith Corbin – did not offer themselves for re-election. Brooks Zug is a founder of HarbourVest who served HVPE since 2007 and was replaced by Carolina Espinal – managing director at HarbourVest. Keith Corbin was on HVPE’s board for more than 11 years. The remaining independent board members are Francesca Barnes (since 2017), Alan Hodson (2013), Andrew Moore (2007) and Steven Wilderspin (2018). Peter Wilson joined HarbourVest in 1996 and was appointed as a member of HVPE’s board in May 2013.
|
|
Research: TMT
Keywords saw strong revenue growth in H119 (17.5% like-for-like, l-f-l) and although investment and some one-off factors compressed margins, the company looks well placed to sustain double-digit EPS growth in the future. We upgrade our FY19 revenue estimates by 5.2% and FY20 by 4.3% and although H1 investment, together with a revision to the adjusted tax calculation, compresses FY19 earnings by 15.8%. FY20 EPS reduces by 2.5% as margins normalise on a higher sales figure. The FY20 P/E of 22.2x is in line with peers, before factoring in the potential for organic upside and further accretive acquisitions.