Last close As at 05/08/2026
—
— 0.00 (0.00%)
Market capitalisation
—
Research: Metals & Mining
Kopy Goldfields produced 53koz of gold equivalent in FY20 following the reverse takeover by Amur Zoloto and plans to grow organically to 100koz within five years. This does not include the substantial potential of the 1.8Moz Krasny project, where Kopy retains 49% ownership. Kopy Goldfields is investigating a possible listing on the Nasdaq Nordic main market, which could enhance its appeal to a broader range of investors.
Written by
Kopy Goldfields |
Organic growth to more than 100koz in Russia |
Initiation of coverage |
Metals & mining |
25 January 2021 |
Share price performance
Business description
Next event
Analyst
Kopy Goldfields is a research client of Edison Investment Research Limited |
|||||||||||||||||||||||||||||||||||||||||||||
Kopy Goldfields produced 53koz of gold equivalent in FY20 following the reverse takeover by Amur Zoloto and plans to grow organically to 100koz within five years. This does not include the substantial potential of the 1.8Moz Krasny project, where Kopy retains 49% ownership. Kopy Goldfields is investigating a possible listing on the Nasdaq Nordic main market, which could enhance its appeal to a broader range of investors.
Year end |
Revenue (US$m) |
PBT* |
EBITDA |
EPS* |
EV/EBITDA |
P/E |
12/19 |
70.1 |
11.7 |
25.5 |
N/A |
N/A |
N/A |
12/20e |
98.1 |
26.9 |
38.3 |
2.4 |
7.5 |
11.5 |
12/21e |
116.1 |
34.1 |
46.6 |
3.0 |
6.1 |
9.1 |
12/22e |
150.3 |
53.0 |
71.2 |
4.6 |
4.0 |
5.9 |
Note: *PBT and EPS are normalised, excluding amortisation of acquired intangibles, exceptional items and share-based payments.
Organic growth to 98koz in FY23 and >100koz in FY25
Following the acquisition of Amur Zoloto by Kopy Goldfields (reverse takeover) in September 2020, Kopy is now a gold producer with FY20 production of 53koz gold equivalent. It has set out a plan to grow production to around 98koz in FY23 and just over 100koz by FY25 by spending US$130m in capex over that period. The growth profile should be fully funded by cash from operations and available debt and is supported by 1.2Moz in gold reserves. With 1.8Moz of gold resources, the Krasny project (49% owned by Kopy) offers longer-term growth and value upside.
Pro-forma FY19 EBITDA US$25.0m (H120: US$16.1m)
The combined group generated pro-forma FY19 EBITDA of US$25.0m and pro-forma net profit of US$8.8m. In H120 Amur Zoloto produced 23.3koz of gold at all in sustaining costs (AISC) of US$1,049/oz. That gave revenue of US$44.2m, pro-forma group EBITDA of US$16.1m and pro-forma net profit of US$8.2m.
Valuation: Cash flows underpin value proposition
Our discounted free cash flow to equity (DCFE) valuation of Kopy, at our long-term real gold price forecast of US$1,524/oz and 10% discount rate, is US$295m or US$0.33/share (SEK2.76/share). However, in the current market environment many listed gold companies are pricing in longer-term real gold prices closer to spot (currently US$1,855/oz). Running a sensitivity at a flat real gold price of US$1,700/oz (ie a nominal price of US$1,700/oz rising by inflation) would give us a DCFE valuation of SEK2.98/share and at US$1,900/oz that rises to SEK3.73/share, significantly above the current share price. Looking at EV/EBITDA multiples for comparable Russian gold companies and applying the peer group’s FY22e EV/EBITDA multiple of 5.2x to FY22e Kopy EBITDA of US$71.2m would suggest a valuation of US$368m (equivalent to SEK$2.98/share after deducting net debt). Kopy Goldfields is looking to enhance its appeal to investors through a review of its dividend policy, environmental, social and corporate governance (ESG) reporting and a potential listing on the Nasdaq Nordic main market.
Investment summary
Company description: 52koz of gold growing to 100koz
In September 2020, the acquisition of Amur Zoloto by Kopy Goldfields (reverse takeover) was completed. Amur Zoloto is a Russian gold company with two producing hard rock and several placer mines. In 2019 Amur Zoloto produced 52koz of gold at AISC of US$1,030/oz. In H120 Amur Zoloto produced 23.3koz of gold at an AISC of US$1,049/oz and in H2 it produced a further 28.5koz taking full-year 2020 gold production to 51.8koz and gold equivalent production to 53.1koz. We forecast FY20 AISC of US$1,047/oz. Kopy has set out a plan to increase production to around 98koz of gold by FY23 and over 100koz by FY25 by spending US$130m to expand underground production and the processing plant at Yubileyniy, develop the Malyutka heap leach project and undertake exploration.
Kopy also retains its 49% interest in the 1.8Moz Krasny deposit, where a July 2019 concept study suggested potential production of up to 110koz pa in a 3Mtpa development scenario. Potential production from Krasny would be in addition to the 100koz organic growth plan. Kopy also holds substantial exploration ground at Maly Patom.
Financials: Pro-forma H120 EBITDA of US$16.1m
One of the key strengths of the business combination with Amur Zoloto is that it has transformed Kopy into a producing and strongly EBITDA positive listed gold company. In 2019 Amur Zoloto produced 52koz of gold, generating US$70m in revenue. Pro-forma, this would have given the combined group FY19 EBITDA of US$25.0m and pro-forma net profit of US$8.8m. In H120 Amur Zoloto produced 23.3koz of gold at an AISC of US$1,049/oz. That gave revenue of US$44.2m, pro-forma group EBITDA of US$16.1m and pro-forma net profit of US$8.2m.
In FY20 we forecast pro-forma EBITDA of US$38.3m and PBT of US$26.9m. Beyond FY20 we forecast production growth to 98koz by FY23, which sees our forecast Kopy group EBITDA rise to US$82.0m in FY23 and PBT to US$62.4m. Our forecasts do not take into account any potential production from Krasny.
Valuation: DCFE of SEK2.76/share with upside potential
In the three months before the announcement of the Amur Zoloto transaction, Kopy Goldfields’ volume weighted average price (VWAP) was SEK0.95/share and 782.2m Kopy Goldfields shares were issued to Amur Zoloto (implying a total consideration of SEK743m (US$77.8m) for the Amur Zoloto assets within the transaction based on VWAP). Since then, Kopy Goldfields’ share price has more than doubled to SEK2.26/share.
Our DCFE valuation of Kopy at our long-term real gold price of US$1,524/oz and 10% discount rate is US$295m or US$0.33/share (SEK2.76/share). However, in the current market environment many listed gold companies are pricing in longer-term real gold prices closer to spot (currently US$1,850/oz). Running a sensitivity at a flat real gold price of US$1,700/oz – equivalent to a nominal price of US$1,700/oz rising by inflation – with an unchanged discount rate would give us a DCFE valuation of SEK2.98/share and at US$1,900/oz that rises to SEK3.73/share.
We have also considered the valuation of Kopy against Russian gold peers – our FY22e EV/EBITDA ratio for Kopy of 4.3x compares to the peer group average of 5.2x. Applying that 5.2x ratio to our forecast FY22 Kopy EBITDA forecast of US$71.2m suggests a valuation for Kopy of US$368m, which equates to SEK2.98/share after adjusting for net debt of US$48m.
Sensitivities: Gold price and low free float
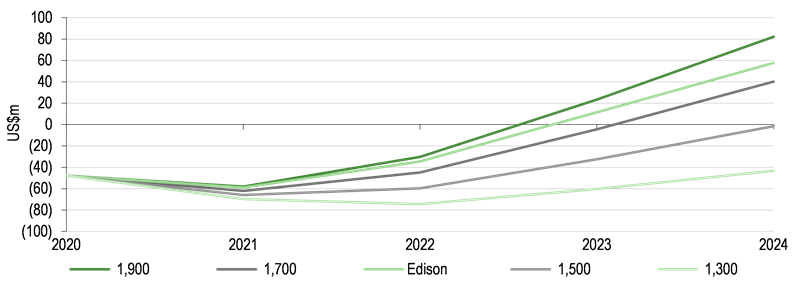
Our analysis suggests Kopy will need to draw down an additional US$15m in debt in FY20 and FY21, taking net debt to US$55.7m in FY21 – a very manageable 1.2x EBITDA. Running a sensitivity analysis on the gold price, we believe net debt levels would remain manageable at less than US$75m even at a gold price of US$1,300/oz (versus the current gold price of US$1,855/oz) and, as such, we would not expect Kopy to require any further equity funding to deliver the planned organic growth. It would also have the flexibility to alter the pace of capex if needed.
In addition to the more generic risks of operating in Russia, investors should consider that after the reverse takeover, the two former owners of Amur Zoloto now hold 88% of Kopy. Kopy is considering listing on the Nasdaq Nordic main market. If that were pursued it would require meeting a number of additional listing criteria including increased ESG reporting. That would enhance Kopy Goldfields’ appeal to more institutional investors.
Company overview
The acquisition of Amur Zoloto (a Russian gold company with three producing mines) by Kopy Goldfields (a gold exploration company focused on Russia and the CIS) in a reverse takeover completed on 9 September 2020, transforming Kopy into an EBITDA-positive gold producer (pro-forma H120 EBITDA of US$16.1m) with significant growth optionality. The acquired Amur Zoloto assets comprise two producing hard-rock mines (Yubileyniy and Perevalnoye), a number of smaller placer deposits and a heap leach project (Malyutka). In FY20 the mines produced 53koz of gold equivalent. In addition, Kopy retains its 49% share in the 1.8Moz Krasny project, also in Russia, and 100% of the Maly Potom exploration project.
|
Exhibit 1: Location of Kopy Goldfields’ mineral assets |
|
|
Source: Kopy Goldfields |
Amur Zoloto: Producing mines and growth options
The former Amur Zoloto mineral assets are in the Khabarovsk region in the central part of the Russian Far East, about 1,150km north of the city of Khabarovsk, comprising a number of developing and operating gold mines, as well as exploration assets including:
■
The Perevalnoye open pit mine and concentration plant, which produced 30koz of gold in 2020.
■
The Yubileyniy complex, which comprises the Krasivoe underground mine and processing plant with capacity of 130ktpa (2020 production of 15koz) with plans to increase this to 250ktpa by the end of FY21, then to 400ktpa.
■
A number of small placer operations (2020 production of 7koz).
■
The Malyutka development project, which will comprise an open pit mine and heap leach facility.
In the half year to June 2020, the mines produced 23.3koz of gold at an AISC of US$1,049/oz. In H2 the mines produced 28.5koz of gold, taking full-year gold production to 51.8koz and gold equivalent production to 53.1koz. Kopy plans to grow gold production from these assets to >100koz by 2025 (Kopy press release, 19 October 2020).
Amur Zoloto reserves and resources
In October 2020, Kopy Goldfields released a competent persons report (CPR) on the Amur Zoloto Mineral Assets prepared by SRK Consulting, which reports mineral resources and reserves in compliance with the JORC code (2012).
Exhibit 2 below summarises Amur Zoloto’s hard rock mineral resources, which total 1.78Moz of gold (1.47Moz measured and indicated and 0.3Moz of inferred gold resources). By-product silver is also present totalling 3.3Moz measured, indicated and inferred (45koz gold equivalent at current spot prices). In addition, the placer assets add 80koz of measured and indicated and 80koz of inferred gold resources.
Exhibit 2: Amur Zoloto hard rock gold resources (JORC, 2012)
Tonnes, Mt |
Grade Au, g/t |
Content Au, koz |
|
Perevalnoye - measured and indicated |
3.00 |
2.9 |
282 |
Yubileyniy - measured and indicated |
3.7 |
6.5 |
777 |
Yubileyniy - inferred |
1.7 |
5.6 |
308 |
Malyutka - measured and indicated |
9.2 |
1.4 |
411 |
Total measured and indicated |
15.9 |
2.9 |
1470 |
Total inferred |
1.7 |
5.64 |
308 |
Source: SRK Consulting CPR, September 2020. Measured and indicated resources are inclusive of reserves.
Exhibit 3 below summarises Amur Zoloto’s hard rock mineral reserves, which total 1.16Moz. The placer assets add a further 25koz of reserves.
Based on mineral reserves, the life of mine at Perevalnoye runs to 2025/2026 and Kopy is undertaking exploration to extend the life of mine. Yubileyniy is a long-life asset, which even at an increased production rate could produce until beyond 2029 based on current reserves.
Exhibit 3: Amur Zoloto hard rock gold reserves (JORC, 2012)
Tonnes, Mt |
Grade Au, g/t |
Content Au, koz |
|
Perevalnoye - probable |
1.4 |
3.3 |
162 |
Yubileyniy - probable |
3.1 |
6.3 |
640 |
Malyutka- probable |
9.3 |
1.2 |
360 |
Total hard rock probable reserves |
13.8 |
2.6 |
1,162 |
Source: SRK Consulting CPR, September 2020
Yubileyniy: Mining and processing
Krasivoe is a high-grade, underground gold mine that feeds the nearby Yubileyniy processing facility. The mine started production in 2004, initially using open-pit methods, then switched to underground mining in 2010. The mine was closed in 2012 after a fire in the processing plant but re-opened in 2015. The Krasivoe mine is accessed by audits and the mining method is sub-level open stoping.
The Krasivoe deposit comprises sub-vertical arc-shape mineralised zones that extend along strike for some 300m and below surface to a depth of some 450m. The gold occurs in association with pyrite in metasomatised quartz and sericite-quartz zones, within granodiorite porphyries. The surface of the orebody lies at 1200m above sea level (ASL) and has been explored to a depth of 450m below surface. The orebody above 800m ASL comprises two ore shoots intersected by faults. The average thickness of each shoot is just under 8m, ranging from 20m in the centre, thinning to 1m at the flanks. Geological exploration work carried out in 2019 and 2020 showed that below 800m ASL, two ore bodies are combined into one with a thickness of up to 40m. Material below 750m ASL has been categorised as inferred. The deposit remains open at depth.
|
Exhibit 4: Krasivoe deposit block model and exploration stages |
|
|
Source: SRK Consulting CPR, September 2020 |
The plant has a design crushing capacity of 130 ktpa and a gravity and flotation section. The plant produces gravity and flotation concentrates that are processed further by leaching. Yubileyniy sells its production in the form of gold doré bars. A second gravity and flotation line is planned to be commissioned to increase capacity to 250ktpa, followed by a further extension to 400ktpa.
Based on current reserves, the life of mine would run to 2029. However, Kopy’s management team is confident that inferred resources below 750m ASL will continue to support production at Yubileyniy well beyond that date and, given that all indications are of a continuity of the orebody at similar grades below that level, we tend to agree. In our financial modelling we have assumed a further two years of production at Yubileyniy, which assumes a 40% conversion from inferred resources to reserves.
Perevalnoye mining and processing
Mining from the Perevalnoye open pit began in 2015 and the processing plant was commissioned in 2017. The plant produces gravity and flotation concentrates that are trucked to the Yubileyniy facility for leaching.
The facility produces concentrate that is leached at Yubileyniy. Ore is mined from the Brekchiyevaya and Priyatnoe pits and from 2021 to 2023 will also be mined from an underground mine below the open pit at Brekchiyevaya.
A heap leach plant to process lower-grade ‘halo’ ore is planned to be operating from 2021 producing 6koz per year for four years.
Based on current reserves, production at Perevalnoye would cease in 2024, but exploration on near-mine targets is being undertaken seeking to extend the life of mine.
The Malyutka project
Gold recovery at Malyutka is proposed to be via heap leaching, with 9.3Mt of ore reserves mined over a six-year life at an average grade of 1.2g/t and recovery of 65%. The company’s capital markets update presentation (October 2020) shows first production in 2023.
Over the life of mine Malyutka is expected to produce a total of 230koz of gold at cash operating costs of around US$700/oz.
Production, cost and capex forecasts
We have based our forecasts for future production, costs and capex on the September 2020 SRK Consulting CPR for Amur Zoloto, which is aligned to the production growth and capex plans presented by Kopy. However, we have made two key changes in our production forecasts relative to the production profile envisaged in the CPR:
■
We have assumed a further two full years of production at Yubileyniy at the end of the reserve life, taking the life of mine to 2031 to reflect the strong likelihood that inferred resources below 750m ASL will be added to the mining inventory (our forecast of an additional two years’ life implies a 40% resource to reserve conversion rate – likely a conservative assumption).
■
Given the 55koz of total placer resources not included in reserves, we have assumed the placer operations continue to produce at 8–9koz per year until 2025 (versus 2022 in the CPR).
The chart below reflects our production forecasts for the existing Kopy Goldfields mines and the Malyutka project (but excluding potential future production from Krasny). We forecast production growing from 52koz of gold in FY20 to 98koz in FY23 after the start of production at Malyutka. Thereafter, our forecasts see production decrease slightly in 2024 as Perevalnoye nears the end of its life, but then increase to 104koz in FY25 as full ramp up of Malyutka and the expansion of Yubileyniy replace lost production at Perevalnoye. Kopy is seeking to extend the life of mine at Perevalnoye, but this would depend on exploration success.
Our forecasts see cash costs per ounce remain around current levels, between US$800/oz and US$900/oz until FY24 (H120 US$806/oz) but then decline to just below US$700/oz by FY26 as Yubileyniy ramps up to 400ktpa and the higher-cost placer mines cease production. Our forecast site AISCs (excluding corporate overheads) decline from US$1,047/oz in FY20 to US$779/oz by FY26.
Between FY20 and FY25, the growth programme will require capital expenditure of US$130m (per Kopy press release, 27 October 2020 based on the SRK CPR of September 2020). Of this, US$93m will be spent in FY20–FY22 with peak capital expenditure of US$44.7m in FY21.
|
Exhibit 5: Forecast production (koz) and costs (US$/oz) |
Exhibit 6: Forecast capex |
|
|
|
Source: Edison Investment Research |
|
Exhibit 5: Forecast production (koz) and costs (US$/oz) |
|
|
Source: Edison Investment Research |
|
Exhibit 6: Forecast capex |
|
|
Source: Edison Investment Research |
Maly Patom
The Maly Patom project covers a total area of 1,940 km2 to the north of Bodaibo. Kopy's licences for bedrock gold prospecting, exploration and production in the Maly Patom project are valid to 2037, with extension options. The area boasts a long history of alluvial gold mining, with most of the river valleys hosting alluvial gold and placer miners have reported pristine gold grains in the area, which indicates the existence of bedrock sources of alluvial gold nearby. However, no serious and consistent bedrock gold exploration has been conducted in the area to date.
The geology and age of the rock in the area is similar to that of Sukhoy Log, with stratigraphy, lithology and structural setting favourable for primary gold mineralisations. There have been numerous reports from the area of secondary gold halo, zone and points of gold mineralisation, as well as many grab samples with gold.
|
Exhibit 10: Location of Maly Patom project |
I |
|
Source: Company Description, May 2020 |
The 2019 exploration activities at Maly Patom, which focused on three of 20+ previously identified gold anomalies, saw several gold anomalous areas identified and sulphide mineralisations discovered, albeit not at commercial gold grades. Following the 2019 drill programme, Kopy CEO Mikhail Damrin commented: ‘With the results we received, we are even more confident about the exploration potential of the area. New information will let us better target and plan further explorations at Maly Patom’ (Kopy Goldfields press release, 3 February 2020).
Edison gold price outlook
In our last note on the gold price (see The gold rush, published on 11 June 2020), we argued that the recent sharp increases in the total US monetary base might be expected to support a (nominal) gold price of US$1,892/oz and potentially as high as US$3,000/oz. While there is a historically strong and statistically significant correlation of 0.909 between the gold price and the total US monetary base from 1967 to 2018, there is very little visibility as to how, or to what extent, the total US monetary base may be expected to evolve. In the four months (to November 2020), the US monetary base was expanding at an average rate of approximately US$98bn per month, which would equate to an expected increase in the gold price (using the historical correlation) of approximately US$391/oz per year. Anecdotally, the total US monetary base may probably be expected to continue to increase until the COVID-19 crisis has been managed, then flatten off for a discrete period until a period of tapering is attempted by the Federal Reserve (in a similar fashion to the aftermath of the global financial crisis). However, neither the extent of any increases nor the extent of any subsequent tapering nor the timing of either is easy to judge. As a result, our strategy (see our June 2020 note on Endeavour Mining, Maiden fully consolidated valuation) is to maintain a flat, nominal gold price of US$1,892/oz from FY22 through to FY26, with flat real prices thereafter at US$1,524/oz in real terms – we model all gold companies in real terms. For FY21 we use the current spot price of US$1,855/oz. The resultant real and nominal forecasts are set out in Exhibit 12 below. Our Kopy Goldfields forecasts and DCFE valuation are based on the real gold prices presented here.
Exhibit 12: Edison gold price forecast (real and nominal US$/oz)
2021 |
2022 |
2023 |
2024 |
2025 |
2026 |
2027 |
2028 |
2029 |
|
Gold price (real US$/oz) |
1,855 |
1,819 |
1,749 |
1,681 |
1,617 |
1,554 |
1,524 |
1,524 |
1,524 |
Gold price (nominal US$/oz) |
1,855 |
1,892 |
1,892 |
1,892 |
1,892 |
1,892 |
1,968 |
2,046 |
2,128 |
Source: Edison Investment Research
Sensitivities
Political risk
All of Kopy’s assets are in Russia, exposing Kopy to the risks associated with the jurisdiction, including potential political risk, labour disputes, risks relating to permits or property rights, and changes to monetary or taxation policies. Russia has a long-established mining sector and is a significant producer of gold, nickel, diamonds and iron ore.
Operational risks
Kopy operates two hard rock mines and a number of placer mines in Russia. Risks associated with the operations of these mines include: COVID-19-related disruptions; severe weather effects (the extreme continental climate prevailing at most Kopy Goldfields assets is characterised by high yearly temperatures ranging from -60oC to +40ºC; the average annual temperature is -6.4ºC and temperatures are above 0oC for only about 60–70 days per year); transport (there are no summer roads to the districts and supplies are generally transported by truck along ice roads during the winter and air freighted during the summer); safety (including relating to underground mining); environmental (including relating to heap leaching and cyanidation); and labour.
Gold price risk
The company generates nearly 100% of its revenues from the sale of gold (with a very small amount of silver by product). Other than the approximately 24koz of deliveries required to repay the US$31m Amur Zoloto contract liability (for which the price was fixed in September 2018), the company’s production is unhedged and it is thus exposed to gold price risk.
However, gold price risk is mitigated by the company’s strong operating cash margins, with AISCs below US$1,050/oz compared to the current gold price of US$1,900/oz.
While our analysis suggests some risk to the company’s ability to fund the planned capex programme if the gold price falls below US$1,300/oz, we note Kopy would also have the flexibility to delay capex if necessary and, as such, we see minimal risk that the company would need to consider equity funding to deliver the planned expansion.
Currency risk
Kopy Goldfields’ revenue is determined by the US dollar gold price but costs are predominantly Russian rouble-denominated as 100% of the current operations are in Russia. This exposes Kopy to the risk that a strengthening Russian rouble could cause costs to increase in US dollar terms. Conversely, Kopy would stand to benefit from any weakening of the rouble.
Kopy is controlled by its major shareholders, who own 88%
Together HC Alliance Mining and Lexor Group (formerly the shareholders of Amur Zoloto) hold 88% of the shares of Kopy. These shareholders can thus exert significant control over Kopy and there is a risk they may direct the company in a way contrary to the best interests of minorities. Partially mitigating this risk, Kopy Goldfields has a majority independent board structure. Kopy Goldfields is investigating the possibility of a Nasdaq Nordic main market listing in the future. The company is also strengthening ESG reporting and has appointed consultants to undertake a review.
Valuation
Based on our DCFE per-share valuation methodology, we value Kopy Goldfields at US$0.33 per share (SEK2.76/share) at our long-term real gold price forecast of US$1,524/oz. However, running a sensitivity analysis at a US$1,700/oz flat real gold price (see Exhibit 13) gives a valuation of SEK2.98/share and at US$1,900/oz that rises to SEK3.73/share – significantly above the current share price. Alternatively, applying the peer group comparable FY22 EV/EBITDA multiple of 5.2x to our forecast FY22 Kopy EBITDA of US$71.2m would suggest a valuation for Kopy of US$368m (equivalent to SEK2.98/ share after adjusting for net debt).
In the three months before the announcement of the Amur Zoloto transaction on 29 May 2020, Kopy Goldfields’ VWAP was SEK0.95/share and 782.2m Kopy Goldfields shares were issued to Amur Zoloto (implying a total consideration of SEK743m (US$77.8m) for the Amur Zoloto assets within the transaction based on VWAP). Since then, Kopy Goldfields’ share price has more than doubled to SEK2.26/share.
Valuation methodology
We value Kopy Goldfields based on a DCFE, which calculates the net present value of the maximum potential dividend (or rather total free cash flow to equity per share) each year, discounted at our standard 10% discount rate and using our standard gold price deck, as detailed earlier in this report. Dividend flow for the purposes of valuation (ie, free cash flow to equity per share) is calculated as:
■
free cash flow from the Yubileyniy, Perevalnoye and placer mines and the Malyutka project based on the assumptions discussed earlier in this report;
■
less corporate overheads;
■
less interest, debt and contract liability repayments (but adding any debt drawdowns);
■
plus our US$22.2m resource-based valuation of Krasny (see page 8) and a valuation for Maly Patom based on historical costs of US$3m, which are included in cash flows for valuation purposes as though realised in FY21; and
■
divided by the number of shares in issue (to which we forecast no change over the period).
DCFE valuation at the Edison gold price
Based on our gold price deck described earlier in this report (long-term real gold price of US$1,524/oz) and using a 10% real discount rate, we value Kopy at US$0.33/share (SEK2.76/share).
Exhibit 13: DCFE valuation of Kopy
2021* |
2022 |
2023 |
2024 |
2025 |
2026 |
2027 |
2028 |
2029 |
2030 |
2031 |
||||||
Free cash flow to equity excl Krasny (US$m) |
12 |
21 |
32 |
26 |
41 |
63 |
67 |
82 |
75 |
50 |
46 |
|||||
Value of Krasny and Maly Patom (US$m) |
25 |
|||||||||||||||
Free cash flow to equity incl Krasny (US$m) |
38 |
21 |
32 |
26 |
41 |
63 |
67 |
82 |
75 |
50 |
46 |
|||||
Sum of DCFE (US$m) |
295 |
|||||||||||||||
Shares in issue (m) |
889 |
889 |
889 |
889 |
889 |
889 |
889 |
889 |
889 |
889 |
889 |
|||||
FCFE per share (US$) |
0.04 |
0.02 |
0.04 |
0.03 |
0.05 |
0.07 |
0.08 |
0.09 |
0.08 |
0.06 |
0.05 |
|||||
FCFE per share (SEK) |
0.35 |
0.20 |
0.30 |
0.25 |
0.38 |
0.59 |
0.62 |
0.76 |
0.70 |
0.47 |
0.43 |
|||||
Equity discount rate |
10% |
|||||||||||||||
DCFE/share (US$) |
0.33 |
|||||||||||||||
DCFE/share (SEK) |
2.76 |
|||||||||||||||
Source: Edison Investment Research. Note: *2021 FCFE includes closing 2020 forecast cash.
Sensitivity analysis: Gold price and discount rate
The table below demonstrates the sensitivity of the base-case discount dividend valuation to gold price and discount rate assumptions. At a flat real long-term gold price of US$1,500/share and 10% discount rate, the discounted dividend valuation of Kopy would be SEK2.22 per share, but this rises to SEK2.98 per share at $1,700/oz flat real gold price (ie a US$1,700 nominal gold price rising by inflation) and to SEK3.73/share at US$1,900/oz – well above the current share price. In the current market conditions, many listed gold companies do appear to be pricing in longer-term real gold prices closer to spot (currently US$1,855/oz). This sensitivity analysis does not consider any hedging arrangements the company may have in place to limit downside risk.
Exhibit 14: Sensitivity of Kopy valuation (SEK per share) to gold price and discount rate
SEK/share |
Gold price – real (US$/oz) |
||||
1,300 |
1,500 |
1,700 |
1,900 |
||
Discount rate |
6% |
1.88 |
2.83 |
3.78 |
4.73 |
8% |
1.65 |
2.50 |
3.35 |
4.19 |
|
10% |
1.46 |
2.22 |
2.98 |
3.73 |
|
12% |
1.30 |
1.98 |
2.66 |
3.34 |
|
Source: Edison Investment Research
Comparable multiples valuation
We have considered a comparable group of four listed Russian gold producers: Polyus, Polymetal, Petropavlosk and Auriant Mining.
Our comparative valuation considers two key metrics:
■
Enterprise value/production.
■
Enterprise value/EBITDA.
We use latest reported net debt and the current market cap based on share prices as of 21 January 2021.
Exhibit 15: Peer group comparable valuation metrics
EV (US$m) |
Last 12 months |
EV production (US$/oz) |
EV/EBITDA (x) |
EV/EBITDA (x) |
EV/EBITDA (x) |
||
Polyus |
29,839 |
2,857 |
10,444 |
8.0 |
6.7 |
6.7 |
|
Polymetal |
12,475 |
1,555 |
8,023 |
7.4 |
6.3 |
5.9 |
|
Petropavlosk |
2,200 |
596 |
3,691 |
5.9 |
4.3 |
3.8 |
|
Auriant Mining |
132 |
31 |
4,248 |
4.3 |
4.3 |
4.2 |
|
Average |
6,602 |
6.4 |
5.4 |
5.2 |
|||
Kopy |
309 |
50 |
6,231 |
9.1 |
6.6 |
4.3 |
|
Source: Company reports* for the 12 months to September 2020. **Based on Edison Investment Research EBITDA forecasts for Kopy and Auriant and Refinitiv consensus for other comparable companies. Priced at close on 21 Jan 2021.
Applying the peer group FY22 EV/ EBITDA multiple of 5.2x to our forecast FY22 Kopy Goldfields EBITDA of US$71.2m would suggest a valuation for Kopy Goldfields of US$368m. After deducting Kopy pro-forma net debt of US$48m, that would imply a valuation of SEK2.98/share.
Financials
Earnings
Given all company revenues are US-dollar denominated (and costs largely rouble denominated) and that Amur Zoloto’s historical financial statements have been presented in US dollars, we have modelled future earnings and cash flows in US dollar terms. However, we have converted all historical and forecast figures into SEK on the end of this report. As the transaction is structured as a reverse takeover of Kopy Goldfields by Amur Zoloto, our financials present historical earnings for Amur Zoloto to FY19 and pro-forma group forecasts from FY20.
In FY19 Amur Zoloto generated US$25.5m in EBITDA (US$25.0m pro-forma including Kopy Goldfields) and made a net profit of US$9.2m (US$8.8m pro-forma).
In FY20 we forecast pro-forma EBITDA of US$38.3m and PBT of US$26.9m.
Beyond FY20, our forecast production growth to 98koz in FY23 then to 105koz in FY25 drives a significant increase in EBITDA. Over FY21 and FY22, we expect to see a minor benefit from sales of gold inventory following a period of inventory build up to 2019 (company description, published 23 June 2020). We forecast Kopy group EBITDA of US$82.0m in FY23 and PBT of US$62.4m.
Exhibit 16: Income statement key metrics (US$m)
FY18 |
FY19 |
FY20e |
FY21e |
FY22e |
FY23e |
FY24e |
2025e |
2026e |
2027e |
2028e |
2029e |
2030e |
2031e |
|
Gold production |
48 |
52 |
52 |
62 |
82 |
98 |
90 |
105 |
117 |
115 |
116 |
94 |
80 |
75 |
Gold sales |
Not disclosed |
Not disclosed |
55 |
63 |
83 |
98 |
90 |
105 |
117 |
115 |
116 |
94 |
80 |
75 |
All in sustaining costs |
Not disclosed |
1,030 |
1,047 |
1,099 |
939 |
957 |
927 |
884 |
779 |
789 |
774 |
769 |
765 |
768 |
Revenue |
60.0 |
70.1 |
98.1 |
116.1 |
150.3 |
176.4 |
161.9 |
180.5 |
181.1 |
174.8 |
177.0 |
143.1 |
121.2 |
114.5 |
Depreciation (and non-cash adjustments) |
(14.5) |
(10.2) |
(6.0) |
(8.5) |
(13.7) |
(15.5) |
(14.9) |
(15.6) |
(14.1) |
(12.2) |
(10.9) |
(9.5) |
(8.3) |
(7.2) |
Cost of Sales |
(32.0) |
(36.6) |
(49.4) |
(59.1) |
(68.7) |
(85.9) |
(75.5) |
(84.5) |
(84.9) |
(83.1) |
(84.0) |
(65.4) |
(54.0) |
(49.8) |
Gross profit |
13.6 |
23.3 |
42.7 |
48.5 |
68.0 |
75.0 |
71.5 |
80.4 |
82.2 |
79.5 |
82.1 |
68.2 |
58.9 |
57.5 |
General and Admin |
(6.1) |
(6.6) |
(7.5) |
(7.5) |
(7.5) |
(7.5) |
(7.5) |
(7.5) |
(7.5) |
(7.5) |
(7.5) |
(7.5) |
(7.5) |
(7.5) |
Share of results of JV |
(1.4) |
(1.4) |
(1.4) |
0.0 |
0.0 |
0.0 |
0.0 |
0.0 |
0.0 |
0.0 |
0.0 |
0.0 |
||
Other operating expenses |
(1.4) |
(1.5) |
(1.5) |
(1.5) |
(1.5) |
(1.0) |
(1.0) |
(0.5) |
(0.5) |
(0.5) |
(0.5) |
(0.5) |
(0.5) |
(0.5) |
Operating Profit |
6.2 |
15.3 |
32.3 |
38.1 |
57.6 |
66.5 |
63.0 |
72.4 |
74.2 |
71.5 |
74.1 |
60.2 |
50.9 |
49.5 |
EBITDA |
20.6 |
25.5 |
38.3 |
46.6 |
71.2 |
82.0 |
77.9 |
88.0 |
88.3 |
83.7 |
85.0 |
69.7 |
59.2 |
56.7 |
Net finance income (costs) |
(4.5) |
(3.5) |
(5.5) |
(4.0) |
(4.6) |
(4.2) |
(2.5) |
(1.4) |
(0.2) |
0.2 |
0.2 |
0.2 |
0.2 |
0.2 |
Profit before tax |
1.7 |
11.7 |
26.9 |
34.1 |
53.0 |
62.4 |
60.4 |
71.0 |
74.0 |
71.7 |
74.3 |
60.4 |
51.1 |
49.6 |
Tax |
(0.5) |
(2.6) |
(5.9) |
(7.5) |
(11.7) |
(13.7) |
(13.3) |
(15.6) |
(16.3) |
(15.8) |
(16.3) |
(13.3) |
(11.2) |
(10.9) |
Net profit |
1.2 |
9.2 |
20.9 |
26.6 |
41.3 |
48.7 |
47.1 |
55.4 |
57.7 |
55.9 |
57.9 |
47.1 |
39.9 |
38.7 |
Shares in issue |
Not disclosed |
Not disclosed |
886 |
889 |
889 |
889 |
889 |
889 |
889 |
889 |
889 |
889 |
889 |
889 |
Net profit per share (c) |
2.4 |
3.0 |
4.6 |
5.5 |
5.3 |
6.2 |
6.5 |
6.3 |
6.5 |
5.3 |
4.5 |
4.4 |
Source: Kopy - Company Description June 2020, Edison Investment Research forecasts. Note: FY18 and FY19 figures are historical financials as reported by Amur Zoloto on a standalone basis (as Amur Zoloto is the acquiror in the reverse takeover). Figures from FY20 are for the combined new Kopy Goldfields group.
Cash flow and funding
On 31 December 2019, the combined Amur Zoloto Kopy Group had pro-forma net debt totalling US$47.9m (US$43.6m Amur Zoloto and US$4.3m Kopy Goldfields) comprising:
■
A US$31.3m (approximately RUB1,939m) Amur Zoloto contract liability. This relates to a September 2018 advance sale of approximately 23koz of gold by Amur Zoloto at the then prevailing gold price and carrying a 6.45% interest rate. Repayment of this facility will be made through the delivery of physical gold to the counterparty and we understand that those deliveries are scheduled to take place between September 2023 and 2025. In our financial modelling within revenue (and in cash from operations) we reflect the ounces of gold delivered under the contract multiplied by an assumed gold price of US$1,200/oz, while in cash from funding we reflect the repayment of the US$31.3m as a cash from financing outflow between FY23 and FY25.
■
Other Amur Zoloto debt and lease liabilities of US$12.7m.
■
Kopy Goldfields debt of US$5m (SEK46.6m) carrying interest of 11.75% year and repayable by September 2022.
■
Group cash of US$1.1m ($0.4m Amur Zoloto and $0.7m Kopy).
By June 2020 net debt had fallen very slightly to US$47m (Kopy Goldfields presentation, Oct 2020).
The table below summarises cash flow key metrics from FY20–FY25 and resultant net debt movement. Our forecasts assume the group can draw down an additional US$15m in debt in FY20 and FY21 and no further equity contributions are needed to fund growth in the base case. Forecast net debt rises to US$55.7m in FY21, 1.2x EBITDA. From FY23 we expect Kopy Goldfields to become cash positive, ending FY23 with net cash of US$14.4m.
Exhibit 17: Free cash-flow key metrics (US$m)
FY20e |
FY21e |
FY22e |
FY23e |
FY24e |
FY25e |
|
EBITDA |
38.3 |
46.6 |
71.2 |
82.0 |
77.9 |
88.0 |
Tax and interest paid |
(8.6) |
(9.5) |
(13.9) |
(17.9) |
(15.8) |
(17.0) |
Net change in working capital |
(3.5) |
(0.5) |
(3.9) |
(7.2) |
3.8 |
(5.8) |
Cash from operations |
26.2 |
36.6 |
53.4 |
57.0 |
65.9 |
65.2 |
Capex |
(21.8) |
(44.7) |
(26.6) |
(11.3) |
(20.0) |
(4.7) |
Free cash flow |
4.4 |
(8.1) |
26.8 |
45.7 |
45.9 |
60.5 |
Net proceeds from (repayment of) borrowings |
5.0 |
10.0 |
(7.0) |
(13.3) |
(19.5) |
(19.5) |
Net change in cash |
10.1 |
2.6 |
19.8 |
32.4 |
26.4 |
41.0 |
Closing cash |
10.5 |
13.1 |
32.9 |
65.3 |
91.7 |
132.7 |
Net (debt)/cash |
(46.3) |
(55.7) |
(31.3) |
14.4 |
60.3 |
120.8 |
Source: Edison Investment Research
We have undertaken a sensitivity analysis on free cash flow and net debt in different gold price scenarios. In our view, given the strong EBITDA and operating cash flow generation of the company, it should readily be able to support a further US$25–35m in debt funding (so net debt could rise to US$72–82m) before any further equity funding would be required. In its capital markets day presentation (27 October 2020), Kopy noted that the capex programme is already ‘fully funded by long-term bank debt’. The company’s FY20 results should provide us with further insight into the company’s committed debt facilities.
Our analysis suggests any pressure on the funding of the capex programme using debt alone would only occur at a gold price below US$1,300/oz (significantly below the current gold price of US$1,8550/oz). The company uses ‘various hedging instruments to mitigate the risk of gold price fluctuations’ (company description, June 2020). Kopy would also have the flexibility to alter the pace of capex if needed. Taken together, these factors significantly mitigate any funding risk in relation to the capital programme. This analysis does not consider potential future development of the Krasny project.
|
Exhibit 18: FCF sensitivity to gold price |
|
|
Source: Edison Investment Research |
|
Exhibit 19: Net debt sensitivity to gold price |
|
|
Source: Edison Investment Research |
Exhibit 20: Financial summary
$'m |
2018 |
2019 |
2020 |
2021 |
2022 |
2023e |
2024e |
2025e |
||
31-December |
IFRS |
IFRS |
IFRS |
IFRS |
IFRS |
IFRS |
IFRS |
IFRS |
||
INCOME STATEMENT |
||||||||||
Revenue |
|
|
60.0 |
70.1 |
98.1 |
116.1 |
150.3 |
176.4 |
161.9 |
180.5 |
Cost of Sales |
(46.4) |
(46.8) |
(55.4) |
(67.6) |
(82.4) |
(101.4) |
(90.4) |
(100.1) |
||
Gross Profit |
13.6 |
23.3 |
42.7 |
48.5 |
68.0 |
75.0 |
71.5 |
80.4 |
||
EBITDA |
|
|
20.6 |
25.5 |
38.3 |
46.6 |
71.2 |
82.0 |
77.9 |
88.0 |
Operating Profit (before amort. and except.) |
|
|
6.2 |
15.3 |
32.3 |
38.1 |
57.6 |
66.5 |
63.0 |
72.4 |
Exceptionals |
0.0 |
0.0 |
0.0 |
0.0 |
0.0 |
0.0 |
0.0 |
0.0 |
||
Share-based payments |
0.0 |
0.0 |
0.0 |
0.0 |
0.0 |
0.0 |
0.0 |
0.0 |
||
Reported operating profit |
6.2 |
15.3 |
32.3 |
38.1 |
57.6 |
66.5 |
63.0 |
72.4 |
||
Net Interest |
(4.5) |
(3.5) |
(5.5) |
(4.0) |
(4.6) |
(4.1) |
(2.5) |
(1.4) |
||
Joint ventures & associates (post tax) |
0.0 |
0.0 |
0.0 |
0.0 |
0.0 |
0.0 |
0.0 |
0.0 |
||
Profit Before Tax (norm) |
|
|
1.7 |
11.7 |
26.9 |
34.1 |
53.0 |
62.4 |
60.4 |
71.0 |
Profit Before Tax (reported) |
|
|
1.7 |
11.7 |
26.9 |
34.1 |
53.0 |
62.4 |
60.4 |
71.0 |
Reported tax |
(0.5) |
(2.6) |
(5.9) |
(7.5) |
(11.7) |
(13.7) |
(13.3) |
(15.6) |
||
Profit After Tax (norm) |
1.2 |
9.2 |
20.9 |
26.6 |
41.3 |
48.7 |
47.1 |
55.4 |
||
Profit After Tax (reported) |
1.2 |
9.2 |
20.9 |
26.6 |
41.3 |
48.7 |
47.1 |
55.4 |
||
Minority interests |
0.0 |
0.0 |
0.0 |
0.0 |
0.0 |
0.0 |
0.0 |
0.0 |
||
Net income (normalised) |
1.2 |
9.2 |
20.9 |
26.6 |
41.3 |
48.7 |
47.1 |
55.4 |
||
Net income (reported) |
1.2 |
9.2 |
20.9 |
26.6 |
41.3 |
48.7 |
47.1 |
55.4 |
||
Average Number of Shares Outstanding (m) |
N/A |
N/A |
886 |
889 |
889 |
889 |
889 |
889 |
||
EPS - basic normalised (c) |
|
|
N/M |
N/M |
2.4 |
3.0 |
4.6 |
5.5 |
5.3 |
6.2 |
EPS - normalised (c) |
|
|
N/M |
N/M |
2.4 |
3.0 |
4.6 |
5.5 |
5.3 |
6.2 |
EPS - basic reported (c) |
|
|
N/M |
N/M |
2.4 |
3.0 |
4.6 |
5.5 |
5.3 |
6.2 |
Dividend per share (c) |
0.0 |
0.0 |
0.0 |
0.0 |
0.0 |
0.0 |
0.0 |
0.0 |
||
Revenue growth (%) |
N/A |
16.8 |
39.9 |
18.4 |
29.4 |
17.4 |
(8.2) |
11.5 |
||
Gross Margin (%) |
22.7 |
33.2 |
43.5 |
41.8 |
45.2 |
42.5 |
44.1 |
44.5 |
||
EBITDA Margin (%) |
34.4 |
36.4 |
39.0 |
40.1 |
47.4 |
46.5 |
48.1 |
48.8 |
||
Normalised Operating Margin |
10.3 |
21.8 |
32.9 |
32.8 |
38.3 |
37.7 |
38.9 |
40.1 |
||
BALANCE SHEET |
||||||||||
Fixed Assets |
|
|
55.7 |
63.8 |
100.3 |
136.5 |
144.4 |
140.2 |
145.3 |
134.4 |
Intangible Assets |
4.9 |
5.3 |
7.1 |
7.1 |
7.1 |
7.1 |
7.1 |
7.1 |
||
Tangible Assets |
46.1 |
43.6 |
59.5 |
95.7 |
108.6 |
104.4 |
109.5 |
98.5 |
||
Investments & other |
4.7 |
14.9 |
33.8 |
33.8 |
28.8 |
28.8 |
28.8 |
28.8 |
||
Current Assets |
|
|
33.8 |
48.9 |
64.1 |
69.2 |
99.9 |
143.1 |
163.4 |
212.1 |
Stocks |
28.6 |
43.4 |
48.4 |
50.9 |
61.8 |
72.5 |
66.5 |
74.2 |
||
Debtors |
2.5 |
3.5 |
3.6 |
3.6 |
3.6 |
3.6 |
3.6 |
3.6 |
||
Cash & cash equivalents |
0.9 |
0.4 |
10.5 |
13.1 |
32.9 |
65.3 |
91.7 |
132.7 |
||
Other |
1.7 |
1.6 |
1.6 |
1.6 |
1.6 |
1.6 |
1.6 |
1.6 |
||
Current Liabilities |
|
|
(9.8) |
(25.1) |
(26.9) |
(28.9) |
(30.8) |
(34.4) |
(24.2) |
(26.1) |
Creditors |
(5.9) |
(8.4) |
(10.2) |
(12.1) |
(14.1) |
(17.6) |
(15.5) |
(17.4) |
||
Tax payable |
(0.7) |
(1.2) |
(1.2) |
(1.2) |
(1.2) |
(1.2) |
(1.2) |
(1.2) |
||
Short term borrowings & contract liability |
(3.1) |
(12.9) |
(12.9) |
(12.9) |
(12.9) |
(12.9) |
(4.9) |
(4.9) |
||
Other |
(0.0) |
(2.6) |
(2.6) |
(2.6) |
(2.6) |
(2.6) |
(2.6) |
(2.6) |
||
Long Term Liabilities |
|
|
(37.9) |
(35.7) |
(48.4) |
(60.5) |
(55.8) |
(42.6) |
(31.1) |
(11.6) |
Long term borrowings & contract liability |
(35.7) |
(31.1) |
(43.8) |
(55.9) |
(51.3) |
(38.0) |
(26.5) |
(7.0) |
||
Other long term liabilities |
(2.2) |
(4.6) |
(4.6) |
(4.6) |
(4.6) |
(4.6) |
(4.6) |
(4.6) |
||
Net Assets |
|
|
41.7 |
51.8 |
89.1 |
116.3 |
157.7 |
206.3 |
253.4 |
308.8 |
Minority interests |
0.0 |
0.0 |
0.0 |
0.0 |
0.0 |
0.0 |
0.0 |
0.0 |
||
Shareholders' equity |
|
|
41.7 |
51.8 |
89.1 |
116.3 |
157.7 |
206.3 |
253.4 |
308.8 |
CASH FLOW |
||||||||||
EBITDA |
20.6 |
25.5 |
38.3 |
46.6 |
71.2 |
82.0 |
77.9 |
88.0 |
||
Working capital |
13.8 |
(17.8) |
(3.5) |
(0.5) |
(3.9) |
(7.2) |
3.8 |
(5.8) |
||
Exceptional & other |
(0.1) |
2.0 |
0.0 |
0.0 |
0.0 |
0.0 |
0.0 |
0.0 |
||
Tax |
(0.6) |
(2.7) |
(5.9) |
(7.5) |
(11.7) |
(13.7) |
(13.3) |
(15.6) |
||
Net operating cash flow |
|
|
33.8 |
7.0 |
28.9 |
38.6 |
55.7 |
61.1 |
68.4 |
66.6 |
Capex |
(4.6) |
(2.9) |
(21.8) |
(44.7) |
(26.6) |
(11.3) |
(20.0) |
(4.7) |
||
Acquisitions/disposals |
0.0 |
0.0 |
(4.3) |
0.0 |
0.0 |
0.0 |
0.0 |
0.0 |
||
Net interest |
(2.5) |
0.0 |
(2.7) |
(2.0) |
(2.2) |
(4.1) |
(2.5) |
(1.4) |
||
Equity financing |
0.0 |
0.0 |
0.0 |
0.7 |
0.0 |
0.0 |
0.0 |
0.0 |
||
Dividends |
0.0 |
0.0 |
0.0 |
0.0 |
0.0 |
0.0 |
0.0 |
0.0 |
||
Other |
0.0 |
0.0 |
0.0 |
0.0 |
0.0 |
0.0 |
0.0 |
0.0 |
||
Net Cash Flow |
26.7 |
4.2 |
0.1 |
(7.4) |
26.8 |
45.7 |
45.9 |
60.5 |
||
Opening net debt/(cash) |
|
|
64.6 |
37.9 |
43.6 |
46.3 |
55.7 |
31.3 |
(14.4) |
(60.3) |
FX |
0.0 |
0.0 |
0.0 |
0.0 |
0.0 |
0.0 |
0.0 |
0.0 |
||
Other non-cash movements |
0.0 |
9.8 |
2.8 |
2.1 |
2.3 |
0.0 |
0.0 |
0.0 |
||
Closing net debt/(cash) |
|
|
37.9 |
43.6 |
46.3 |
55.7 |
31.3 |
(14.4) |
(60.3) |
(120.8) |
Source: Company data, Edison Investment Research. Note: FY18 and FY19 figures are historical financials as reported by Amur Zoloto on a standalone basis (as Amur Zoloto is the acquiror in the reverse takeover). Figures from FY20 are for the combined new Kopy Goldfields group.
Exhibit 21: Financial summary
SEK'm |
2018 |
2019 |
2020 |
2021 |
2022 |
2023e |
2024e |
2025e |
||
31-December |
IFRS |
IFRS |
IFRS |
IFRS |
IFRS |
IFRS |
IFRS |
IFRS |
||
INCOME STATEMENT |
||||||||||
Revenue |
|
|
522.3 |
663.3 |
904.6 |
964.0 |
1,247.6 |
1,464.2 |
1,343.7 |
1,498.3 |
Cost of Sales |
(403.9) |
(442.9) |
(510.9) |
(561.2) |
(683.5) |
(841.5) |
(750.5) |
(831.0) |
||
Gross Profit |
118.4 |
220.4 |
393.7 |
402.8 |
564.1 |
622.8 |
593.2 |
667.3 |
||
EBITDA |
|
|
179.6 |
241.1 |
353.1 |
387.0 |
591.2 |
681.0 |
646.4 |
730.7 |
Operating Profit (before amort. and except.) |
|
|
53.7 |
144.4 |
297.8 |
316.5 |
477.7 |
552.2 |
522.6 |
600.9 |
Exceptionals |
0.0 |
0.0 |
0.0 |
0.0 |
0.0 |
0.0 |
0.0 |
0.0 |
||
Share-based payments |
0.0 |
0.0 |
0.0 |
0.0 |
0.0 |
0.0 |
0.0 |
0.0 |
||
Reported operating profit |
53.7 |
144.4 |
297.8 |
316.5 |
477.7 |
552.2 |
522.6 |
600.9 |
||
Net Interest |
(38.9) |
(33.5) |
(50.3) |
(33.5) |
(38.0) |
(34.4) |
(21.0) |
(11.4) |
||
Joint ventures & associates (post tax) |
0.0 |
0.0 |
0.0 |
0.0 |
0.0 |
0.0 |
0.0 |
0.0 |
||
Profit Before Tax (norm) |
|
|
14.8 |
110.9 |
247.6 |
283.0 |
439.7 |
517.8 |
501.6 |
589.5 |
Profit Before Tax (reported) |
|
|
14.8 |
110.9 |
247.6 |
283.0 |
439.7 |
517.8 |
501.6 |
589.5 |
Reported tax |
(4.2) |
(24.2) |
(54.5) |
(62.3) |
(96.7) |
(113.9) |
(110.3) |
(129.7) |
||
Profit After Tax (norm) |
10.5 |
86.7 |
193.1 |
220.7 |
343.0 |
403.9 |
391.2 |
459.8 |
||
Profit After Tax (reported) |
10.5 |
86.7 |
193.1 |
220.7 |
343.0 |
403.9 |
391.2 |
459.8 |
||
Minority interests |
0.0 |
0.0 |
0.0 |
0.0 |
0.0 |
0.0 |
0.0 |
0.0 |
||
Net income (normalised) |
10.5 |
86.7 |
193.1 |
220.7 |
343.0 |
403.9 |
391.2 |
459.8 |
||
Net income (reported) |
10.5 |
86.7 |
193.1 |
220.7 |
343.0 |
403.9 |
391.2 |
459.8 |
||
Average Number of Shares Outstanding (m) |
N/A |
N/A |
886 |
889 |
889 |
889 |
889 |
889 |
||
EPS - basic normalised (SEK) |
|
|
N/M |
N/M |
0.20 |
0.25 |
0.39 |
0.45 |
0.44 |
0.52 |
EPS - normalised (SEK) |
|
|
N/M |
N/M |
0.20 |
0.25 |
0.39 |
0.45 |
0.44 |
0.52 |
EPS - basic reported (SEK) |
|
|
N/M |
N/M |
0.20 |
0.25 |
0.39 |
0.45 |
0.44 |
0.52 |
Dividend per share (c) |
0.0 |
0.0 |
0.0 |
0.0 |
0.0 |
0.0 |
0.0 |
0.0 |
||
Revenue growth (%) |
NA |
27.0 |
36.4 |
6.6 |
29.4 |
17.4 |
(-8.2) |
11.5 |
||
Gross Margin (%) |
22.7 |
33.2 |
40.8 |
41.5 |
41.4 |
38.4 |
40.3 |
40.1 |
||
EBITDA Margin (%) |
18.2 |
32.5 |
36.3 |
39.9 |
43.8 |
42.6 |
44.5 |
44.6 |
||
Normalised Operating Margin |
10.3 |
21.8 |
30.2 |
32.8 |
33.9 |
33.2 |
34.7 |
35.3 |
||
BALANCE SHEET |
||||||||||
Fixed Assets |
|
|
456 |
594 |
832 |
1,133 |
1,199 |
1,164 |
1,206 |
1,115 |
Intangible Assets |
40 |
49 |
59 |
59 |
59 |
59 |
59 |
59 |
||
Tangible Assets |
378 |
406 |
494 |
794 |
901 |
866 |
909 |
818 |
||
Investments & other |
38 |
139 |
280 |
280 |
239 |
239 |
239 |
239 |
||
Current Assets |
|
|
277 |
455 |
532 |
574 |
829 |
1,187 |
1,357 |
1,760 |
Stocks |
235 |
405 |
402 |
423 |
513 |
602 |
552 |
616 |
||
Debtors |
21 |
32 |
30 |
30 |
30 |
30 |
30 |
30 |
||
Cash & cash equivalents |
7 |
4 |
87 |
109 |
273 |
542 |
761 |
1,101 |
||
Other |
14 |
15 |
13 |
13 |
13 |
13 |
13 |
13 |
||
Current Liabilities |
|
|
(80) |
(234) |
(223) |
(240) |
(256) |
(285) |
(201) |
(216) |
Creditors |
(49) |
(78) |
(84) |
(101) |
(117) |
(146) |
(129) |
(144) |
||
Tax payable |
(6) |
(11) |
(10) |
(10) |
(10) |
(10) |
(10) |
(10) |
||
Short term borrowings & contract liability |
(26) |
(120) |
(107) |
(107) |
(107) |
(107) |
(41) |
(41) |
||
Other |
(0) |
(25) |
(22) |
(22) |
(22) |
(22) |
(22) |
(22) |
||
Long Term Liabilities |
|
|
(311) |
(333) |
(402) |
(502) |
(464) |
(353) |
(258) |
(96) |
Long term borrowings & contract liability |
(293) |
(290) |
(364) |
(464) |
(425) |
(315) |
(220) |
(58) |
||
Other long term liabilities |
(18) |
(43) |
(38) |
(38) |
(38) |
(38) |
(38) |
(38) |
||
Net Assets |
|
|
342 |
483 |
739 |
966 |
1,309 |
1,712 |
2,104 |
2,563 |
Minority interests |
0 |
0 |
0 |
0 |
0 |
0 |
0 |
0 |
||
Shareholders' equity |
|
|
342 |
483 |
739 |
966 |
1,309 |
1,712 |
2,104 |
2,563 |
CASH FLOW |
||||||||||
EBITDA |
180 |
241 |
353 |
387 |
591 |
681 |
646 |
731 |
||
Working capital |
120 |
(168) |
(32) |
(4) |
(32) |
(60) |
32 |
(48) |
||
Exceptional & other |
(1) |
19 |
0 |
0 |
0 |
0 |
0 |
0 |
||
Tax |
(5) |
(26) |
(54) |
(62) |
(97) |
(114) |
(110) |
(130) |
||
Net operating cash flow |
|
|
294 |
66 |
267 |
320 |
462 |
507 |
568 |
553 |
Capex |
(40) |
(27) |
(201) |
(371) |
(221) |
(94) |
(166) |
(39) |
||
Acquisitions/disposals |
0 |
0 |
(40) |
0 |
0 |
0 |
0 |
0 |
||
Net interest |
(22) |
0 |
(25) |
(16) |
(19) |
(34) |
(21) |
(11) |
||
Equity financing |
0 |
0 |
0 |
5 |
0 |
0 |
0 |
0 |
||
Dividends |
0 |
0 |
0 |
0 |
0 |
0 |
0 |
0 |
||
Other |
0 |
0 |
0 |
0 |
0 |
0 |
0 |
0 |
||
Net Cash Flow |
232 |
39 |
1 |
(62) |
223 |
379 |
381 |
502 |
||
Opening net debt/(cash) |
|
|
562 |
330 |
412 |
426 |
463 |
259 |
(120) |
(501) |
FX |
0 |
29 |
(10) |
(43) |
0 |
0 |
0 |
(0) |
||
Other non-cash movements |
0 |
93 |
25 |
17 |
19 |
0 |
0 |
0 |
||
Closing net debt/(cash) |
|
|
330 |
412 |
426 |
463 |
259 |
(120) |
(501) |
(1,003) |
Source: Company data, Edison Investment Research. Note: FY18 and FY19 figures are historical US$ financials as reported by Amur Zoloto on a standalone basis (as Amur Zoloto is the acquiror in the reverse takeover), which we have converted to SEK at an average exchange rate of SEK8.70/US$ and closing exchange rate of SEK8.20/US$ for FY18, and average exchange rate of SEK9.46/US$ and closing exchange rate of SEK9.32/US$ for FY19. Figures from FY20 are Edison forecasts for the combined new Kopy Goldfields group converted to SEK at average exchange rate of SEK9.22/US$ for FY20 and closing exchange rate of SEK8.30/US$ with the rate of SEK8.30/US$ applied consistently from FY21.
|
|||||||||||||||||||||||||||||||||||||||||
|
||||||||||
|
||||||||||
Research: Healthcare
The company recently reported results for H1 FY21, featuring a 46% y-o-y increase in Cxbladder sales to NZ$3.3m. The US business grew 46% to NZ$2.9m and was assisted by the inclusion of Cxbladder into a local coverage determination (LCD) enabling reimbursement at US$760 per test from the US Centers for Medicare and Medicaid Services (CMS) on all tests after 1 July (corresponding to the second half of H1 FY21). The outlook for growth in the US business is strong due to the change in reimbursement, the Kaiser Permanente commercial agreement and the company’s intensified investment in its US operations.