Last close As at 05/08/2026
—
— 0.00 (0.00%)
Market capitalisation
—
Research: Metals & Mining
Kopy Goldfields has reported its first full year results as a Russian gold producer following the Amur Zoloto reverse acquisition (the comparative 2019 results are for Amur Zoloto only). The company saw revenue rise 41% to US$98.8m and EBITDA rise 67% to US$45.6m. Having secured a US$42.3m debt facility maturing in September 2023, Kopy is fully funded to support its growth profile and we expect the company to end 2021 with net debt of US$61.8m and US$13.7m in cash and undrawn debt facilities.
Written by
Kopy Goldfields |
Solid 2020 results with funding in place for growth |
Full-year results |
Metals & mining |
1 April 2021 |
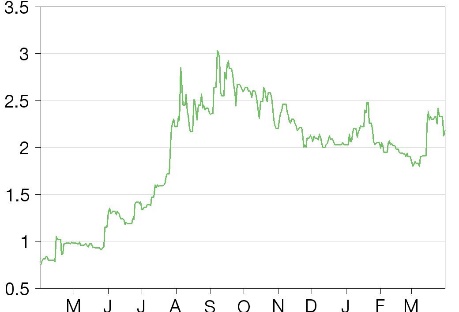
Share price performance
Business description
Next events
Analyst
Kopy Goldfields is a research client of Edison Investment Research Limited |
|||||||||||||||||||||||||||||||||||||||||||||||||||||
Kopy Goldfields has reported its first full year results as a Russian gold producer following the Amur Zoloto reverse acquisition (the comparative 2019 results are for Amur Zoloto only). The company saw revenue rise 41% to US$98.8m and EBITDA rise 67% to US$45.6m. Having secured a US$42.3m debt facility maturing in September 2023, Kopy is fully funded to support its growth profile and we expect the company to end 2021 with net debt of US$61.8m and US$13.7m in cash and undrawn debt facilities.
Year end |
Revenue (US$m) |
PBT* |
EBITDA (US$m) |
EPS* |
EV/EBITDA (x) |
P/E |
12/19 |
70.1 |
11.7 |
27.3 |
1.2 |
10.3 |
17.1 |
12/20 |
98.8 |
24.7 |
45.6 |
2.4 |
6.2 |
10.4 |
12/21e |
112.3 |
30.5 |
44.3 |
2.7 |
6.4 |
10.5 |
12/22e |
150.3 |
53.4 |
72.6 |
4.7 |
3.9 |
6.0 |
Note: *PBT and EPS are reported numbers (before adjusting for any exceptional items).
Strong set of 2020 results with EBITDA up 67%
Kopy Goldfields has reported its first full year results following the Amur Zoloto reverse acquisition (the comparative 2019 figures are for Amur Zoloto only). The company reported revenue of US$98.8m (up 41% y-o-y) driven by a 14% increase in gold sold to 55koz and a strong gold price. EBITDA of US$45.6m was up 67% year-on-year and reported PBT of US$24.7m was up 111% y-o-y.
Secured debt facilities in place to fund growth capex
We think one of the key positives from the 2020 results lies in the details of the company’s funding headroom. Kopy Goldfields has secured a US$42.3m debt facility (of which US$27m was undrawn as at December 2020) from VTB Bank which matures in September 2023. The term of the contract liability has been extended such that first gold deliveries will begin only in September 2023 and Kopy Goldfields ended 2020 with US$10.4m in cash and US$4.9m of gold in stock ready for sale. With 2021 being the peak year for capital investment (company guidance is US$56m in capex and exploration spend this year), we expect net debt to peak at the end of this year at US$61.8m (1.4x EBITDA). That would nevertheless leave around US$13.7m in funding headroom (cash and undrawn facilities) at year end.
Valuation: Base case DCFE of SEK2.78/share
Our updated base case discounted free cash flow to equity (DCFE) valuation of Kopy is little changed at US$286m (previously US$295m) or SEK2.78/share (previously SEK2.76/share). This is based on our standard gold price deck (long-term real gold price of US$1,524/oz) and 10% discount rate. Running a sensitivity analysis at a flat real long-term gold price of US$1,700/oz (ie US$1,700/oz rising by inflation) the discounted dividend valuation of Kopy would be SEK3.00 per share. The planned Nasdaq Nordic main market listing could be a catalyst for increased investor interest in Kopy Goldfields.
A solid set of 2020 full-year results
Kopy Goldfields’ preliminary FY20 results reflect its first set of results following the Amur Zoloto reverse takeover. For accounting purposes Amur Zoloto is treated as the acquirer for the consolidated financial information and Kopy Goldfields AB is presented as the acquiree. The comparable period (2019) results thus reflect Amur Zoloto’s financials on a standalone basis, while 2020 incorporates Kopy Goldfields from the effective date of acquisition (1 September 2020). Following the transaction with Amur Zoloto, Kopy Goldfields has chosen to change the presentation currency from Swedish krona (SEK) to US dollars (USD). The group has chosen to present its consolidated financial statements in US dollars as management believes it is a convenient presentation currency for international users of the consolidated financial statements of the group.
A strong set of 2020 results reflect both an increase in gold sales to 55koz in 2020 (2019 49koz) and the higher gold price (US$1,773/oz in 2020 from US$1,400/oz in 2019). As a result, Kopy Goldfields generated revenue of US$98.8m in 2020, a 41% y-o-y increase. The company generated US$45.6m in EBITDA (2019 $27.3m), reported PBT of US$24.7m (2019 US$11.7m) and earnings per share of 2.35c (2019 1.17c).
Despite investing significantly into growth capex in 2020, with US$17.9m spent, and taking on Kopy Goldfields’ net debt of US$6.3m, the company ended 2020 with net debt of US$41.9m (down slightly from US$43.6m at the end of 2019) resulting in a net debt to EBITDA ratio of 0.92.
Exhibit 1: FY20 results key metrics
2019 |
2020 |
% change |
|
Gold sales |
49 |
55 |
14% |
Revenue (US$m) |
70.1 |
98.8 |
41% |
All in sustaining costs (US$/oz) |
1,050 |
1,096 |
4% |
EBITDA (US$m) |
27.3 |
45.6 |
67% |
Reported PBT (US$m) |
11.7 |
24.7 |
111% |
Reported EPS (c) |
1.17 |
2.35 |
101% |
Cash (US$m) |
0.4 |
10.4 |
|
Net debt (US$m) |
43.6 |
41.9 |
Source: Kopy Goldfields
Secured debt facilities fully fund growth to >100koz
We think that one of the key positive takeaways from the full year results is the detail provided on the company’s funding position. Kopy ended 2020 with net debt of US$41.9m comprising:
■
A US$15.0m RUB-denominated loan
■
US$6.4m in SEK-denominated loans
■
A US$26.2m contract liability
■
US$4.7m in leases and debt due to related parties
■
US$10.4m in cash
The rouble-denominated debt is within a US$42.3m VTB Bank facility secured in June 2020 (US$27.3m undrawn). The facility matures only in September 2023.
In March 2021 the US$6.4m loan from the Scandinavian Credit Fund was repaid in full. Even after that repayment Kopy Goldfields is left with additional funding headroom of around US$21m. The company also ended 2020 with US$4.9m in gold in stock ready for sale.
The contract liability relates to a commodity pre-payment received in September 2018 which obliges Kopy Goldfields to deliver a certain amount of gold at the scheduled contract term and which bears interest at 6.45% per annum. Based on the gold price at the date the pre-payment was received, we calculate that the liability amounts to approximately 23koz of gold. The initial maturity date of the contract was 31 July 2022; however, during 2020 the company reached agreement with the bank to postpone the maturity of the contract liability and the new repayment schedule starts from September 2023 through to June 2025. The extension of this contract term further relieves any pressure on the Kopy balance sheet during the period of elevated capex in 2021 and 2022.
Listing on Nasdaq Stockholm main market progressing
In Kopy Goldfields’ presentation to analysts on 25 March 2021 it noted that it has begun a pre-listing review in preparation for listing on Nasdaq Stockholm’s main market. We believe that a move to the main market could help Kopy Goldfields to appeal to a broader group of potential investors, and thus act as a positive catalyst for the stock.
Updated financial forecasts: Solid EBITDA growth
Our updated financial forecasts continue to reflect Kopy Goldfields’ strong EBITDA and earnings growth profile as the company ramps up gold production from the 53koz produced in 2020 to 82koz in 2022. We forecast EBITDA of US$72.6m in 2022 (previously US$71.2m) putting Kopy Goldfields on a 2022 EV/EBITDA of just 3.9x.
Our updated financial forecasts are based on gold sales of 61koz in 2021 (previously 63koz) to align with company guidance for production of 56–59koz in 2021 – we assume the higher end – and assuming the sale of a further 2.5koz of gold from inventory. We also mark to market for the Q1 gold price (leaving forecasts unchanged), resulting in a small downward adjustment to 2021 realised prices to US$1,840/oz (from US$1,855/oz previously). We now forecast 2021 revenue of US$112.3m (previously US$116.1m), EBITDA of US$44.3m (previously US$46.6m) and PBT of US$30.5m (previously US$34.1m). That gives us a forecast 2021 earnings per share of 2.7c (previously 3.0c).
A more significant change in our forecasts is the increase in 2021e capex to US$55.8m (we previously forecast US$44.7m) to align with company guidance (Kopy Goldfields’ press release of 28 January 2021). In part this higher level of forecast capital expenditure reflects the deferral of some capex from 2020 into 2021 (US$17.9m spent in 2020 versus our forecast of US$21.8m) and in part it reflects the impact of a planned 26,000m of exploration drilling at the 1.8Moz Krasny exploration and development project as the company and its joint venture partner GV Gold aim to advance Krasny into the feasibility stage and production planning by year end.
Kopy Goldfields began 2021 with US$27m in undrawn debt facilities as well as US$10.4m in cash and US$4.9m in gold in stock ready for sale. Following the repayment of the US$6.4m Scandinavian credit fund loan in March 2021, the company remains very well funded to progress its planned capex programme. Assuming that a further US$20m is drawn down on the VTB debt facility during 2021 (leaving US$7m undrawn), we expect Kopy Goldfields to end 2021 with US$6.5m in cash and net debt of US$61.8m (previous forecast US$55.7m).
Our forecasts for 2022 and beyond reflect minor adjustments to more closely align forecast costs with the 2020 full year results and to take into account the impact of our updated forecast 2021 closing balances. We continue to expect the company to be strongly free cash flow positive after capex in 2022, ending the year with net debt of US$36.9m (we previously forecast US$31.3m).
Exhibit 2: Updated forecast key metrics
2020 |
2021e |
2021e |
2022e |
2022e |
|
Actual |
Old |
New |
Old |
New |
|
Gold sales (koz) |
55 |
63 |
61 |
83 |
83 |
Gold price (US$/oz) |
1,773 |
1,855 |
1,840 |
1,819 |
1,819 |
Revenue (US$m) |
98.8 |
116.1 |
112.3 |
150.3 |
150.3 |
All in sustaining costs (US$/oz) |
1,096 |
1,099 |
1,123 |
939 |
939 |
EBITDA (US$m) |
45.6 |
46.6 |
44.3 |
71.2 |
72.6 |
PBT (US$m) |
24.7 |
34.1 |
30.5 |
53.0 |
53.4 |
EPS (c) |
1.2 |
3.0 |
2.7 |
4.6 |
4.7 |
Capex & Krasny exploration (US$m) |
(17.9) |
44.7 |
(55.8) |
26.6 |
(26.6) |
Closing cash (US$m) |
10.4 |
13.1 |
6.5 |
32.9 |
26.3 |
Closing net debt (US$m) |
41.9 |
55.7 |
61.8 |
31.3 |
36.9 |
Source: Company accounts, Edison Investment Research
Sensitivities
Kopy Goldfields operates two hard rock mines and a number of smaller placer mines in Russia. In addition to the technical and operating risks of the mines, the company is thus also exposed to Russian political risk. Kopy Goldfields is 88% owned by its major shareholders, which creates further risk for minority investors. The latter risk may be partly mitigated by the move to the Nasdaq Stockholm main board. In addition to these more general risks, we think the two key risks for the company this year are any potential impact of COVID-19 on operations, and the balance sheet risk created during this period of higher capex.
The company continued to operate throughout 2020 despite the challenges posed by the coronavirus pandemic. A number of safety measures were introduced including 14-day quarantine for all personnel travelling to the production mine sites. However, during the last two weeks of December several cases of COVID-19 were reported at Yubileyniy impacting the pace of mining and processing. In January 2021 all operations were restored to planned scale. All employees in Russia have been offered the opportunity to get vaccinated free of charge. In the near term, COVID-19 nevertheless remains a key operational risk.
2021 represents the peak year in Kopy Goldfields’ significant growth capital programme (totalling US$130m by 2025) with the company expecting to spend US$56m on capex and exploration. That also means that net debt should peak this year – and we forecast closing 2021 net debt of US$61.8m – or 1.4x EBITDA. Our forecasts assume that the company draws down a further US$20m in debt this year from the available PJSC VTB facility, leaving US$7.2m in undrawn facilities and US$6.5m in forecast cash at year end 2021, or US$13.7m in total funding headroom. Even running a sensitivity analysis at a gold price of US$1500/oz, available funding headroom would remain at over US$5m.
Valuation
We value Kopy Goldfields using a DCFE, which calculates the net present value of the maximum potential dividend (or total free cash flow to equity per share) each year, discounted at a 10% discount rate and using our standard Edison gold price deck (long-term real gold price of US$1,524/oz) shown in Exhibit 3 below.
Dividend flow for the purposes of valuation (ie free cash flow to equity per share) is calculated as:
■
free cash flow from the Yubileyniy, Perevalnoye and placer mines and the Malyutka project less corporate overheads;
■
less interest, debt and contract liability repayments (but adding any debt drawdowns);
■
plus our US$22m resource-based valuation of Krasny (US$24.8 per ounce of gold resources) and a valuation for Maly Patom based on historic costs of US$3m, which are included in cash flows for valuation purposes as though realised in FY21; and
■
divided by the number of shares in issue (to which we forecast no change over the period).
Our updated base case DCFE valuation of Kopy is little changed at US$286m (previously US$295m). Translating into SEK at SEK8.65/US$ (previously SEK8.30/US$) gives us an updated DCFE valuation of SEK2.78 (from SEK2.76/share).
Exhibit 3: Edison gold price forecast (real and nominal US$/oz)
2021 |
2022 |
2023 |
2024 |
2025 |
2026 |
2027 |
2028 |
2029 |
|
Gold price (real US$/oz) |
1,850 |
1,819 |
1,749 |
1,681 |
1,617 |
1,554 |
1,524 |
1,524 |
1,524 |
Gold price (nominal US$/oz) |
1,850 |
1,892 |
1,892 |
1,892 |
1,892 |
1,892 |
1,968 |
2,046 |
2,128 |
Source: Edison Investment Research
Exhibit 4: DCFE valuation of Kopy
2021* |
2022 |
2023 |
2024 |
2025 |
2026 |
2027 |
2028 |
2029 |
2030 |
2031 |
||||||
Free cash flow to equity excl Krasny (US$m) |
9 |
21 |
33 |
25 |
46 |
61 |
66 |
70 |
75 |
51 |
44 |
|||||
Value of Krasny and Maly Patom (US$m) |
25 |
|||||||||||||||
Free cash flow to equity incl Krasny (US$m) |
34 |
21 |
33 |
25 |
46 |
61 |
66 |
70 |
75 |
51 |
44 |
|||||
Sum of DCFE (US$m) |
286 |
|||||||||||||||
Shares in issue (m) |
889 |
889 |
889 |
889 |
889 |
889 |
889 |
889 |
889 |
889 |
889 |
|||||
FCFE per share (US$) |
0.04 |
0.02 |
0.04 |
0.03 |
0.05 |
0.07 |
0.07 |
0.08 |
0.08 |
0.06 |
0.05 |
|||||
FCFE per share (SEK) |
0.32 |
0.19 |
0.30 |
0.23 |
0.43 |
0.57 |
0.62 |
0.68 |
0.73 |
0.49 |
0.43 |
|||||
Equity discount rate |
10% |
|||||||||||||||
DCFE/share (US$) |
0.32 |
|||||||||||||||
DCFE/share (SEK) |
2.78 |
|||||||||||||||
Source: Edison Investment Research. Note: *2021 FCFE includes closing 2020 cash.
Sensitivity analysis: Gold price and discount rate
The table below shows the sensitivity of the discount dividend valuation to gold price and discount rate assumptions. At a flat real long-term gold price of US$1,500/share and 10% discount rate, the discounted dividend valuation of Kopy would be SEK2.19 per share, but this rises to SEK3.00 per share at $1,700/oz flat real gold price (ie a US$1,700 nominal gold price rising by inflation).
Exhibit 5: Sensitivity of Kopy valuation (SEK per share) to gold price and discount rate
SEK/share |
Gold price – real (US$/oz) |
||||
1,300 |
1,500 |
1,700 |
1,900 |
||
Discount rate |
6% |
1.81 |
2.81 |
3.82 |
4.83 |
8% |
1.57 |
2.48 |
3.38 |
4.28 |
|
10% |
1.38 |
2.19 |
3.00 |
3.81 |
|
12% |
1.21 |
1.95 |
2.68 |
3.42 |
|
Source: Edison Investment Research
Exhibit 6: Financial summary
$m |
2018 |
2019 |
2020 |
2021e |
2022e |
2023e |
|||
Year end 31 December |
IFRS |
IFRS |
IFRS |
IFRS |
IFRS |
IFRS |
|||
INCOME STATEMENT |
|||||||||
Revenue |
|
|
60.0 |
70.1 |
98.8 |
112.3 |
150.3 |
176.4 |
|
Cost of Sales |
(46.4) |
(44.5) |
(55.0) |
(66.9) |
(82.3) |
(99.4) |
|||
Gross Profit |
13.6 |
25.6 |
43.8 |
45.4 |
68.0 |
77.0 |
|||
EBITDA |
|
|
20.6 |
27.3 |
45.6 |
44.3 |
72.6 |
82.0 |
|
Operating Profit (before amort. and except.) |
|
|
6.2 |
17.6 |
34.5 |
35.4 |
59.0 |
68.5 |
|
Exceptionals |
0.0 |
(2.3) |
(2.9) |
0.0 |
0.0 |
0.0 |
|||
Share-based payments |
0.0 |
0.0 |
0.0 |
0.0 |
0.0 |
0.0 |
|||
Reported operating profit |
6.2 |
15.3 |
31.6 |
35.4 |
59.0 |
68.5 |
|||
Net Interest |
(4.5) |
(3.5) |
(6.6) |
(4.0) |
(4.6) |
(4.2) |
|||
Joint ventures & associates (post tax) |
0.0 |
0.0 |
(0.3) |
(1.0) |
(1.0) |
0.0 |
|||
Profit Before Tax (norm) |
|
|
1.7 |
14.0 |
27.6 |
30.5 |
53.4 |
64.3 |
|
Profit Before Tax (reported) |
|
|
1.7 |
11.7 |
24.7 |
30.5 |
53.4 |
64.3 |
|
Reported tax |
(0.5) |
(2.6) |
(5.6) |
(6.7) |
(11.7) |
(14.2) |
|||
Profit After Tax (norm) |
1.2 |
11.5 |
22.0 |
23.8 |
41.6 |
50.2 |
|||
Profit After Tax (reported) |
1.2 |
9.2 |
19.2 |
23.8 |
41.6 |
50.2 |
|||
Minority interests |
0.0 |
0.0 |
0.0 |
0.0 |
0.0 |
0.0 |
|||
Net income (normalised) |
1.2 |
11.5 |
22.0 |
23.8 |
41.6 |
50.2 |
|||
Net income (reported) |
1.2 |
9.2 |
19.2 |
23.8 |
41.6 |
50.2 |
|||
Average Shares Outstanding (m) |
N/A |
783 |
815 |
889 |
889 |
889 |
|||
EPS - basic normalised (c) |
|
|
N/M |
1.47 |
2.7 |
2.7 |
4.7 |
5.6 |
|
EPS - normalised (c) |
|
|
N/M |
1.47 |
2.7 |
2.7 |
4.7 |
5.6 |
|
EPS - basic reported (c) |
|
|
N/M |
1.17 |
2.4 |
2.7 |
4.7 |
5.6 |
|
Dividend per share (c) |
0.0 |
0.0 |
0.0 |
0.0 |
0.0 |
0.0 |
|||
Revenue growth (%) |
N/A |
16.8 |
41.0 |
13.6 |
33.8 |
17.4 |
|||
Gross Margin (%) |
22.7 |
36.5 |
44.4 |
40.5 |
45.2 |
43.6 |
|||
EBITDA Margin (%) |
34.4 |
39.0 |
46.2 |
39.5 |
48.3 |
46.5 |
|||
Normalised Operating Margin |
10.3 |
25.1 |
34.9 |
31.6 |
39.2 |
38.8 |
|||
BALANCE SHEET |
|||||||||
Fixed Assets |
|
|
55.7 |
63.8 |
102.5 |
148.5 |
155.4 |
153.2 |
|
Intangible Assets |
4.9 |
5.3 |
5.9 |
5.9 |
5.9 |
5.9 |
|||
Tangible Assets |
46.1 |
43.6 |
39.9 |
81.9 |
94.8 |
92.6 |
|||
Investments & other |
4.7 |
14.9 |
56.7 |
60.7 |
54.7 |
54.7 |
|||
Current Assets |
|
|
33.8 |
48.9 |
58.1 |
54.5 |
85.8 |
127.3 |
|
Stocks |
28.6 |
43.4 |
39.8 |
40.0 |
51.5 |
60.4 |
|||
Debtors |
2.5 |
3.5 |
5.9 |
5.9 |
5.9 |
5.9 |
|||
Cash & cash equivalents |
0.9 |
0.4 |
10.4 |
6.5 |
26.3 |
58.9 |
|||
Other |
1.7 |
1.6 |
2.1 |
2.1 |
2.1 |
2.1 |
|||
Current Liabilities |
|
|
(9.8) |
(22.5) |
(19.5) |
(15.3) |
(17.1) |
(19.9) |
|
Creditors |
(5.9) |
(8.4) |
(7.7) |
(9.5) |
(11.3) |
(14.1) |
|||
Tax payable |
(0.7) |
(1.2) |
(2.7) |
(2.7) |
(2.7) |
(2.7) |
|||
Short term borrowing & contract liability |
(3.1) |
(12.9) |
(9.0) |
(3.0) |
(3.0) |
(3.0) |
|||
Other |
(0.0) |
(0.0) |
(0.0) |
(0.0) |
(0.0) |
(0.0) |
|||
Long Term Liabilities |
|
|
(37.9) |
(33.9) |
(47.0) |
(69.0) |
(63.9) |
(50.1) |
|
Long term borrowing & contract liability |
(35.7) |
(31.1) |
(43.3) |
(65.4) |
(60.2) |
(46.5) |
|||
Other long term liabilities |
(2.2) |
(2.8) |
(3.7) |
(3.7) |
(3.7) |
(3.7) |
|||
Net Assets |
|
|
41.7 |
56.2 |
94.2 |
118.6 |
160.3 |
210.4 |
|
Minority interests |
0.0 |
0.0 |
(0.0) |
(0.0) |
(0.0) |
(0.0) |
|||
Shareholders' equity |
|
|
41.7 |
56.2 |
94.2 |
118.6 |
160.3 |
210.4 |
|
CASH FLOW |
|||||||||
EBITDA |
20.6 |
27.3 |
45.6 |
44.3 |
72.6 |
82.0 |
|||
Working capital |
13.8 |
(17.8) |
(19.9) |
1.6 |
(4.7) |
(6.1) |
|||
Exceptional & other |
(0.1) |
0.2 |
(0.8) |
0.0 |
0.0 |
0.0 |
|||
Tax |
(0.6) |
(2.7) |
(5.1) |
(6.7) |
(11.7) |
(14.2) |
|||
Net operating cash flow |
|
|
33.8 |
7.0 |
19.8 |
39.2 |
56.2 |
61.8 |
|
Capex |
(4.6) |
(2.9) |
(17.9) |
(50.8) |
(26.6) |
(11.3) |
|||
Acquisitions and investment in assocs |
0.0 |
0.0 |
(5.6) |
(5.0) |
0.0 |
0.0 |
|||
Net interest |
(2.5) |
0.0 |
(2.5) |
(1.9) |
(2.3) |
(4.2) |
|||
Equity financing |
0.0 |
0.0 |
0.0 |
0.7 |
0.0 |
0.0 |
|||
Dividends |
0.0 |
0.0 |
0.0 |
0.0 |
0.0 |
0.0 |
|||
Other |
0.0 |
0.0 |
0.0 |
0.0 |
0.0 |
0.0 |
|||
Net Cash Flow |
26.7 |
4.2 |
(6.1) |
(17.9) |
27.3 |
46.3 |
|||
Opening net debt (cash) |
|
|
64.6 |
37.9 |
43.6 |
41.9 |
61.8 |
36.9 |
|
FX |
0.0 |
0.0 |
(7.8) |
0.0 |
0.0 |
0.0 |
|||
Other adjustments to net debt |
0.0 |
9.8 |
0.0 |
2.0 |
2.4 |
0.0 |
|||
Closing net debt (cash) |
|
|
37.9 |
43.6 |
41.9 |
61.8 |
36.9 |
(9.4) |
|
Source: Kopy Goldfields, Edison Investment Research forecasts
|
|
Research: Financials
Draper Esprit is an active investor, providing venture and growth capital to Europe’s fast-growing technology businesses. It held its annual investor day on 25 February 2021, where it showcased a broad range of portfolio companies, from recent investments to some of its leading pre-IPO investee companies. Even before the Trustpilot and Cazoo IPOs (uplifts of c 60p and 20p per share respectively), Draper Esprit had reported c 70p per share of additional portfolio value uplift (Graphcore, UiPath) since its H121 results. However, FX headwinds (GBP strengthening against USD) and carry are expected to affect how this value uplift translates into NAV. Draper Esprit’s portfolio includes 67 companies, with 15 later-stage companies in the core portfolio (eg Trustpilot, UiPath, Cazoo, Revolut).