Last close As at 05/08/2026
—
— 0.00 (0.00%)
Market capitalisation
—
Research: Energy & Resources
Renergen had a strong H219 as it secured final funding for Phase 1 of its Virginia Gas Project. The project is now firmly in the development phase, major equipment orders have been placed and first liquid production of both LNG and helium is expected to start around July 2021 – with the latter a first for sub-Saharan Africa. Our updated risked NAV of ZAR23.9/share suggests considerable upside potential to the current share price. However, economics and upside could be further enhanced if a directional well currently being drilled into an untested sandstone group at Virginia proves successful. Renergen has already announced preliminary results for the well, which indicate substantially better gas flows than expected, and most critically helium concentration of 12% (compared with 2–3% in its previous wells).
Written by
Renergen |
On track for liquid production by mid-2021 |
Fund-raising update |
Oil & gas |
30 January 2020 |
Share price performance
Business description
Next events
Analysts
Renergen is a research client of Edison Investment Research Limited |
|||||||||||||||||||||||||||||||||||||||||||||||||||||
Renergen had a strong H219 as it secured final funding for Phase 1 of its Virginia Gas Project. The project is now firmly in the development phase, major equipment orders have been placed and first liquid production of both LNG and helium is expected to start around July 2021 – with the latter a first for sub-Saharan Africa. Our updated risked NAV of ZAR23.9/share suggests considerable upside potential to the current share price. However, economics and upside could be further enhanced if a directional well currently being drilled into an untested sandstone group at Virginia proves successful. Renergen has already announced preliminary results for the well, which indicate substantially better gas flows than expected, and most critically helium concentration of 12% (compared with 2–3% in its previous wells).
Year end |
Revenue (ZARm) |
Adj. EBITDA* |
Reported net income (ZARm) |
Net (debt)/ |
Cash from operations (ZARm) |
Capex |
02/18 |
2.9 |
(26.9) |
(40.6) |
(31.1) |
(18.4) |
(13.9) |
02/19 |
3.0 |
(43.2) |
(45.0) |
48.3 |
(36.9) |
(13.3) |
02/20e |
4.8 |
(50.6) |
(58.0) |
(58.7) |
(52.0) |
(195.7) |
02/21e |
8.6 |
(30.4) |
(39.0) |
(450.5) |
(30.9) |
(361.0) |
Note: *EBITDA is normalised, excluding amortisation of acquired intangibles, exceptional items and share-based payments.
12% helium from current sandstone well
Results from a directional well currently being drilled to appraise a shallower sandstone interval at Virginia have been particularly positive, both in terms of gas flow rates and helium concentration of 12%. The strong flow rates have delayed completion and testing of the well, but if the early results are confirmed this could have a significant positive impact on Virginia economics and valuation.
On track for LNG/helium production by mid-2021
Meanwhile, the company is on track to complete Phase 1 of the Virginia development by mid-2021. Funding has come from equity raised during the company’s June 2019 listing on the ASX (A$10m) and a subsequent placement in January 2020 (c A$6m), and a US$40m US government agency loan, reflecting the importance of Renergen’s potential helium supply. Key equipment orders have been made and Renergen has hit all its early construction milestones to date.
Valuation: ZAR23.9/share risked 2P valuation
Renergen recently increased its ownership in the Virginia Gas Project to 100% on particularly favourable terms and this has helped increase our valuation from ZAR20.5/share to ZAR23.9/share. The major upside uncertainty at this stage is the ultimate economics of the Virginia Gas Project if the higher helium values and strong flow rates in the sandstone prove reproducible. This will become clearer once Renergen announces results of the ongoing well in February and we learn the impact of this programme on updated reserves and resources around May 2020.
On track for LNG production in mid-2021
Over the last few months Renergen has made several announcements that give us increased confidence the company will be able to switch to LNG and helium production in around July 2021. The company has also acquired the remaining 10% of the Virginia Gas Project that it did not own (in a significantly value-accretive deal). Meanwhile a horizontal well is currently being drilled in an untested sandstone reservoir and is showing encouraging results both for flow rate and helium concentration that could add additional volumes to existing reserves and resources during 2020.
Horizontal well ongoing with 12% helium announced
Renergen is currently drilling and logging a horizontal well targeting a prospective shallow Permian Karoo sandstone that sits within the Virginia Gas Project production area. The sandstone was originally identified in the 2016 well, 2057, which encountered gas at 290m. The helium concentration in 2057 was found to be almost 11%, compared to c 3% on average in the rest of the field. Renergen estimates that the sandstone is up to 100m thick in sections and covers an area of up to 90km2.
|
Exhibit 1: Horizontal well schematic |
|
|
Source: Renergen |
The current well is designed to assess the scale of the helium and methane reserves in the sandstone. These reserves are not included in Renergen’s existing reserve estimates (current reserves are primarily based on deeper underlying fault zones below the sandstone). The planned horizontal section of 1.5km through the sandstone would maximise exposure to the faults and fractures where flow is expected to be highest, with the well path targeting three major fracture zones. The well is targeting gas bearing structures within two primary target zones, the upper Vryheid Formation sandstones and Dwyka Group diamictite.
Renergen was expecting to complete drilling of the horizontal section in January, having completed the vertical and toe sections of the well in late 2019. Very encouragingly, the company reported strong gas flows almost immediately once the well entered the sandstone; in fact, gas shows in the drilling mud were reported while still in the shallower Karoo formation. After drilling only 50m of the horizontal section, the company reported a choked flow rate of 850mcfd, which is substantially ahead of pre-drill expectations.
In addition to the strong flow rates, Renergen has also reported that gas from this section contained 12% helium and more than 75% methane. The helium concentration is similar to that previously reported from the 2057 well in the same area of the structure, and well above the helium concentrations Renergen assumes in its current reserves and resources (average 2.33% for 2P reserves).
While we expected drilling of the horizontal section to be completed in January, the most recent announcements from the company are that further drilling has been delayed. We understand the delay is to replace the rig blowout preventer (BOP) with a larger facility suited to the potential flow rates being seen while drilling. We understand the replacement BOP will be in place around late January/early February after which drilling can recommence. However, given the large flow rates seen at the toe of the well it is not yet clear if Renergen will be able to complete the horizontal well as planned, or if an alternative well plan will be deployed. While awaiting the replacement BOP, Renergen has been running electric logs since 17 January 2020 and these will be used to evaluate the forward programme for the well.
In addition to the horizontal well, Renergen has confirmed that the first of its planned inclined wells in the Phase 1 development and appraisal programme will spud in early February. We expect results from the inclined wells to be available around six weeks from spudding. Renergen expects to accelerate drilling of the inclined wells in due course using multiple rigs. At present there are a large number of suitable rigs readily available in the South African market.
The results of the horizontal well and the inclined wells will be incorporated into an updated reserves and resource report. Initially the plan was to have this complete by end March 2020; however, we now understand this is likely to slip to around April/May given the delays with the horizontal well and the potential complexities from the unusually high flow rates.
Virginia LNG and helium production from 2021
Following the closing of a US$40m loan in late August 2019 with US government agency Overseas Private Investment Corporation (OPIC), Renergen triggered the final milestone in late October 2019 to start construction of its Virginia Gas Project by appointing Western Shell Cryogenic Equipment Co (WSCE) as the equipment supplier for its first LNG and liquid helium plant. EPCM Bonisana (Pty) (EPCM) will separately install the pipeline and manage the interface between the two installations.
The plant is expected to be installed by April 2021 (ahead of first gas to the plant in July 2021) and will have capacity to produce up to 2,700GJ of liquid natural gas and 350kg of liquid helium per day.
|
Exhibit 2: WSCE operating plant at commissioning stage in China |
|
|
Source: Renergen |
We assume capital costs for the first helium and LNG liquefiers of US$3.6m (ZAR52.5m) and US$14.4m (ZAR210m), respectively, along with ZAR27m for power facilities.
Interestingly, Renergen is being very open regarding the milestones to reach first LNG production, and has announced its construction schedule and committed to the market an update as each milestone is reached (Exhibit 3).
Exhibit 3: Virginia Phase 1 construction milestones (as of 29 January 2020)
Milestone |
Date |
Status |
Balance of plant |
27/11/2019 |
Completed on schedule |
Site establishment for pipeline |
10/12/2019 |
Completed ahead of schedule |
Design for pipeline completed |
01/04/2020 |
|
Site establishment for plant |
15/06/2020 |
|
Design for plant completed |
18/08/2020 |
|
Plant batch 1 FOB |
01/11/2020 |
|
Pipeline completed |
20/11/2020 |
|
Plant batch 2 FOB |
01/01/2021 |
|
Plant utilities commissioned |
08/04/2021 |
|
Gas to plant |
07/07/2021 |
Source: Renergen. Edison Investment Research
This unusually open approach gives us confidence both as to how realistic the schedule is, and that we can track progress accurately towards first LNG production in mid 2021.
Evolution of the South African LNG market
Renergen’s Virginia operation will be South Africa’s first commercial LNG facility as well as being sub-Saharan African’s first supplier of liquefied helium gas. As discussed in our previous notes, the majority of LNG production is expected to go into the South African domestic trucking market, in part replacing compressed natural gas (CNG) that Renergen is already supplying to a limited but growing number of domestic truck operators (see below). In the longer term there is the possibility of a substantially larger domestic LNG industry if the Total-operated Brulpadda field discovered in early 2019 is ultimately developed, although this will be some years off.
Ahead of LNG production in 2021, Renergen continues to grow out its commercial agreements with domestic truck operators for CNG. In September 2019, the company announced the commissioning of its second CNG filling station in Johannesburg, which will supply CNG to a fleet of approximately 15 trucks to be operated by Black Knight Logistics. Initially, these trucks will run on a combination of CNG and diesel, and once Renergen’s LNG facility is commissioned, they will be modified to take LNG, which will increase the refuelling range of the trucks. We understand the conversion from CNG to LNG is relatively simple/low cost.
We expect the new Black Knight trucks to consume in the region of 4GJ/day of CNG, ie adding a potential 60GJ/day to Renergen’s current CNG production. This would effectively triple the company’s revenues in the next 12 months (ahead of LNG production from 2021).
Increased ownership in flagship asset to 100%
Renergen announced in late December that it was acquiring the 10% Black Economic Empowerment (BEE) stake that it did not own in the Virginia Gas Project (owned by BEE partner, Cheryl Sjoberg) for ZAR23m (A$2.33m), net of loans. Given we previously valued Renergen’s 90% stake (on a risked basis) at US$159m (c A$230m) this was clearly a highly value-accretive deal to Renergen. We understand the deal was particularly attractive for Renergen as the company had previously funded the BEE partner with loans that would have made the sale to a third party less attractive.
Renergen has indicated it will not need to secure BEE investors for the 10% stake based on the ‘once empowered, always empowered’ principle adopted in South Africa. However, the company is open to considering any fair, market-related offers from BEE investors for the 10% stake, and has emphasised its continuing commitment to transforming and growing South Africa’s economy.
January 2020 fund-raise and potential change in major shareholder
To fund the acquisition of the additional 10% in the Virginia Gas Project, Renergen has raised in January 2020 an additional A$5.75m in equity (at A$1.2/share). This will also give the company additional funds to appraise the horizontal well and accelerate the inclined well programme as required. Encouragingly, we understand the raise was taken up by a number of institutions, in contrast with the ASX admission raise, which was split between a cornerstone investor and Australian retail investors.
Renergen also announced in November 2019 that its largest shareholder, Tamryn Investment Holdings Proprietary (Tamryn), had entered into an agreement with a private Chinese group, Notable Pioneer, where Notable Pioneer may acquire up to 20m shares from Tamryn, ie c 17% of the share capital. This would increase Notable Pioneer’s stake in Renergen to 24.81% (prior to the January placement). The option to acquire the stake expires on 5 February. We note that the South African Companies Act requires a mandatory offer to be made once a shareholder breaches 35%.
Financials: Almost fully funded for Phase 1
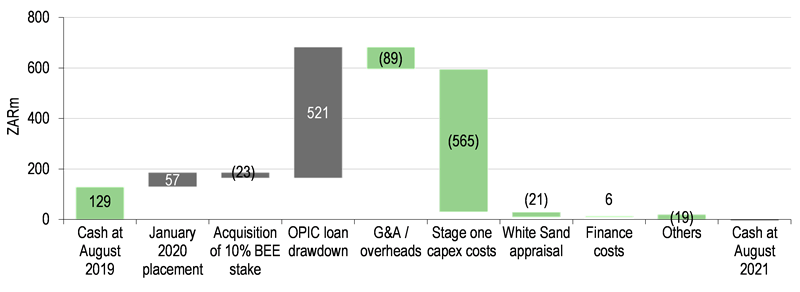
The 2019 ASX listing proceeds and January 2020 placing (c A$16m or ZAR162m) and the US$40m OPIC funding (ZAR521m) should cover almost all capital costs required for Renergen to complete Phase 1 of its Virginia LNG/helium development (Exhibit 9). We estimate at the point of first LNG production – around July/August 2021 – the company will have a negative cash balance of c ZAR5m (A$0.5m). This forecast may change once Renergen clarifies the work programme to complete the sandstone appraisal programme.
|
Exhibit 9: Stage one development sources and uses of capital |
|
|
Source: Edison Investment Research |
However, thereafter Renergen can be expected to be cash flow positive and the net debt position from mid-2021 should improve dramatically as we show in Exhibit 10.
|
Exhibit 10: Long-term cash generation (Phase 1 only) |
|
|
Source: Edison Investment Research |
The cash flow outlook will be very different if Renergen presses on with Phase 2 development at Virginia as shown in Exhibit 11. This forecast is based on current 2P reserves and will change once the updated reserves are available in around May 2020.
|
Exhibit 11: Long-term cash generation (Phase 1 and 2) |
|
|
Source: Edison Investment Research |
Exhibit 12: Financial summary
Accounts: IFRS; year end: February; ZAR000s |
2016 |
2017 |
2018 |
2019 |
2020e |
2021e |
2022e |
2023e |
2024e |
INCOME STATEMENT |
|
|
|
|
|
|
|
|
|
Total revenues |
0 |
1,722 |
2,885 |
2,987 |
4,784 |
8,587 |
304,725 |
316,041 |
327,334 |
Cost of sales |
0 |
(2,127) |
(3,483) |
(3,197) |
(1,888) |
0 |
(33,453) |
(34,926) |
(37,028) |
Gross profit |
0 |
(405) |
(598) |
(210) |
2,896 |
8,587 |
271,273 |
281,115 |
290,305 |
SG&A (expenses) |
(17,889) |
(21,589) |
(31,050) |
(43,010) |
(53,458) |
(38,950) |
(39,924) |
(40,922) |
(41,945) |
R&D costs |
0 |
0 |
0 |
0 |
0 |
0 |
0 |
0 |
0 |
Other income/(expense) |
0 |
0 |
4,708 |
0 |
0 |
0 |
0 |
0 |
0 |
Exceptionals and adjustments |
(1,518) |
0 |
(12,359) |
(1,629) |
(8,132) |
(8,132) |
(8,132) |
(8,132) |
(8,132) |
Depreciation and amortisation |
(88) |
(1,025) |
(803) |
(1,165) |
(1,757) |
0 |
(12,615) |
(12,886) |
(13,142) |
Reported EBIT |
(19,495) |
(23,019) |
(40,102) |
(46,014) |
(60,451) |
(38,495) |
210,602 |
219,176 |
227,086 |
Finance income/(expense) |
2,942 |
1,279 |
597 |
(2,534) |
2,439 |
(499) |
(19,880) |
(15,117) |
(8,617) |
Other income/(expense) |
0 |
0 |
0 |
0 |
0 |
0 |
0 |
0 |
0 |
Exceptionals and adjustments |
(2,946) |
(3,156) |
(3,532) |
0 |
0 |
0 |
0 |
0 |
0 |
Reported PBT |
(19,499) |
(24,896) |
(43,037) |
(48,548) |
(58,013) |
(38,995) |
190,722 |
204,059 |
218,469 |
Income tax expense (includes exceptionals) |
0 |
6,234 |
2,436 |
3,572 |
0 |
0 |
(72,424) |
(75,104) |
(77,606) |
Reported net income |
(19,499) |
(18,662) |
(40,601) |
(44,976) |
(58,013) |
(38,995) |
118,298 |
128,955 |
140,864 |
Basic average number of shares, m |
53 |
78 |
80 |
85 |
111 |
117 |
117 |
117 |
117 |
Basic EPS (ZAR/share) |
(0.4) |
(0.2) |
(0.5) |
(0.5) |
(0.5) |
(0.3) |
1.0 |
1.1 |
1.2 |
|
|
|
|
|
|
|
|
|
|
Adjusted EBITDA |
(17,889) |
(21,994) |
(26,940) |
(43,220) |
(50,562) |
(30,363) |
231,349 |
240,193 |
248,360 |
Adjusted EBIT |
(17,977) |
(23,019) |
(27,743) |
(44,385) |
(52,319) |
(30,363) |
218,734 |
227,308 |
235,218 |
Adjusted PBT |
(15,035) |
(21,740) |
(27,146) |
(46,919) |
(49,881) |
(30,863) |
198,854 |
212,191 |
226,601 |
Adjusted EPS (ZAR) |
(0.3) |
(0.2) |
(0.3) |
(0.5) |
(0.5) |
(0.3) |
1.1 |
1.2 |
1.3 |
Adjusted diluted EPS (ZAR/share) |
(0.3) |
(0.2) |
(0.3) |
(0.5) |
(0.5) |
(0.3) |
1.1 |
1.2 |
1.3 |
|
|
|
|
|
|
|
|
|
|
BALANCE SHEET |
|
|
|
|
|
|
|
|
|
Property, plant and equipment |
7,145 |
21,756 |
32,615 |
37,757 |
205,882 |
566,887 |
690,853 |
683,352 |
730,919 |
Goodwill |
0 |
0 |
0 |
0 |
0 |
0 |
0 |
0 |
0 |
Intangible assets |
61,504 |
75,453 |
65,838 |
70,494 |
99,755 |
99,755 |
99,755 |
99,755 |
99,755 |
Other non-current assets |
0 |
6,234 |
10,303 |
14,421 |
21,772 |
21,772 |
21,772 |
21,772 |
21,772 |
Total non-current assets |
68,649 |
103,443 |
108,756 |
122,672 |
327,409 |
688,414 |
812,380 |
804,879 |
852,446 |
Cash and equivalents |
41,721 |
12,401 |
3,037 |
97,956 |
510,584 |
118,716 |
121,180 |
265,768 |
367,196 |
Inventories |
0 |
0 |
0 |
0 |
0 |
0 |
0 |
0 |
0 |
Trade and other receivables |
4,134 |
8,933 |
2,459 |
4,482 |
6,697 |
6,697 |
6,697 |
6,697 |
6,697 |
Other current assets |
6,503 |
0 |
0 |
0 |
12,659 |
12,659 |
12,659 |
12,659 |
12,659 |
Total current assets |
52,358 |
21,334 |
5,496 |
102,438 |
529,940 |
138,072 |
140,536 |
285,124 |
386,552 |
Non-current loans and borrowings |
26,612 |
30,113 |
34,156 |
49,684 |
569,234 |
569,234 |
569,234 |
569,234 |
569,234 |
Other non-current liabilities |
0 |
0 |
0 |
0 |
0 |
0 |
0 |
0 |
0 |
Total non-current liabilities |
26,612 |
30,113 |
34,156 |
49,684 |
569,234 |
569,234 |
569,234 |
569,234 |
569,234 |
Trade and other payables |
3,490 |
5,503 |
11,433 |
11,193 |
20,084 |
20,084 |
20,084 |
20,084 |
20,084 |
Current loans and borrowings |
0 |
0 |
0 |
0 |
0 |
0 |
0 |
0 |
0 |
Other current liabilities |
0 |
0 |
0 |
0 |
0 |
0 |
0 |
0 |
0 |
Total current liabilities |
3,490 |
5,503 |
11,433 |
11,193 |
20,084 |
20,084 |
20,084 |
20,084 |
20,084 |
Equity attributable to company |
98,828 |
98,423 |
80,948 |
180,634 |
287,077 |
256,214 |
382,644 |
519,731 |
668,726 |
Non-controlling interest |
(7,923) |
(9,262) |
(12,285) |
(16,401) |
(19,046) |
(19,046) |
(19,046) |
(19,046) |
(19,046) |
|
|
|
|
|
|
|
|
|
|
CASH FLOW STATEMENT |
|
|
|
|
|
|
|
|
|
Profit before tax |
(19,499) |
(24,896) |
(43,037) |
(48,548) |
(57,544) |
(38,995) |
190,722 |
204,059 |
218,469 |
Net finance expenses |
(2,942) |
(1,279) |
(597) |
(1,419) |
(4,611) |
499 |
19,880 |
15,117 |
8,617 |
Depreciation and amortisation |
88 |
1,841 |
2,822 |
3,150 |
1,757 |
0 |
12,615 |
12,886 |
13,142 |
Share based payments |
1,518 |
0 |
114 |
334 |
8,132 |
8,132 |
8,132 |
8,132 |
8,132 |
Other adjustments |
5,921 |
4,453 |
10,169 |
11,941 |
7,838 |
(499) |
(19,880) |
(15,117) |
(8,617) |
Movements in working capital |
(6,266) |
(3,254) |
12,090 |
(2,327) |
(4,723) |
0 |
0 |
0 |
0 |
Other items |
0 |
0 |
0 |
0 |
0 |
0 |
0 |
0 |
0 |
Income taxes paid |
0 |
0 |
0 |
0 |
(2,856) |
0 |
(72,424) |
(75,104) |
(77,606) |
Cash from operations (CFO) |
(21,180) |
(23,135) |
(18,439) |
(36,868) |
(52,007) |
(30,863) |
139,045 |
149,972 |
162,138 |
Capex |
0 |
(20,714) |
(13,861) |
(13,343) |
(195,704) |
(361,005) |
(136,581) |
(5,384) |
(60,710) |
Acquisitions & disposals net |
0 |
0 |
0 |
0 |
0 |
0 |
0 |
0 |
0 |
Other investing activities |
0 |
0 |
0 |
0 |
(9,256) |
0 |
0 |
0 |
0 |
Cash used in investing activities (CFIA) |
49,512 |
(20,714) |
(13,861) |
(13,343) |
(204,960) |
(361,005) |
(136,581) |
(5,384) |
(60,710) |
Net proceeds from issue of shares |
72,957 |
13,427 |
23,480 |
140,212 |
153,247 |
0 |
0 |
0 |
0 |
Movements in debt |
0 |
0 |
0 |
5,149 |
520,547 |
0 |
0 |
0 |
0 |
Dividends paid |
0 |
0 |
0 |
0 |
0 |
0 |
0 |
0 |
0 |
Other financing activities |
(60,186) |
0 |
558 |
(231) |
(618) |
0 |
0 |
0 |
0 |
Cash from financing activities (CFF) |
12,771 |
13,427 |
24,038 |
145,130 |
673,176 |
0 |
0 |
0 |
0 |
Increase/(decrease) in cash and equivalents |
41,103 |
(30,422) |
(8,262) |
94,919 |
412,628 |
(391,868) |
2,464 |
144,588 |
101,428 |
Cash and equivalents at end of period |
41,721 |
11,299 |
3,037 |
97,956 |
510,584 |
118,716 |
121,180 |
265,768 |
367,196 |
Net (debt) cash |
15,109 |
(17,712) |
(31,119) |
48,272 |
(58,650) |
(450,518) |
(448,054) |
(303,466) |
(202,038) |
Source: Renergen accounts, Edison Investment Research
|
|
Research: TMT
Although we expected strong growth in H219, FY19 revenue of €326m, reflecting 30% overall growth and 15% organic growth, represents a sparkling performance. EBITDA and PBT were ahead of forecast at €49.5m and €41.0m, respectively. Given the higher revenue base, we are revising our FY20 revenue estimate up by 4%, but prudently holding operating profit and PBT at previous levels as margins normalise through FY20. We retain our view that Keywords remains strongly positioned as the only games service provider at a global scale. The company’s P/E rating (25.0x FY20e) reflects its leading market position, track record and potential, and should fall further as Keywords continues its buy-and-build strategy.