Petro Matad offers investors exposure to a fully funded exploration campaign targeting near-field, low-risk prospects as well as basin opening, high-impact potential. The 2018 two-well programme in blocks IV and V will test the yet to be drilled Baatsagaan and Taats basins in the heart of Mongolia, targeting 570mmbo of mid-case prospective resource. In Block XX, close to existing production, two low-cost wells will test extensions of proven plays in H218. In 2019 drilling returns to the Tugrug Basin to test a 200mmbo prospect, close to live oil shows and mapped on 3D seismic, as well as a 48mmbo target on Block XX analogous to producing fields to the north east. Attractive fiscal terms and the scalability of developments enable relatively small oil discoveries to be commercialised in the current oil price environment. Our risked valuation post assumed farm-out value dilution is 30.8p/share at 70$/bbl Brent long term. Valuation remains highly sensitive to oil price assumptions and exploration outcomes.
Written by
Petro Matad |
Low-cost, high-impact onshore oil exploration |
Initiation of coverage |
Oil & gas |
4 July 2018 |
Share price performance
Business description
Next events
Analysts
Petro Matad is a research client of Edison Investment Research Limited |
|||||||||||||||||||||||||||||||||||||||||||||||||
Petro Matad offers investors exposure to a fully funded exploration campaign targeting near-field, low-risk prospects as well as basin opening, high-impact potential. The 2018 two-well programme in blocks IV and V will test the yet to be drilled Baatsagaan and Taats basins in the heart of Mongolia, targeting 570mmbo of mid-case prospective resource. In Block XX, close to existing production, two low-cost wells will test extensions of proven plays in H218. In 2019 drilling returns to the Tugrug Basin to test a 200mmbo prospect, close to live oil shows and mapped on 3D seismic, as well as a 48mmbo target on Block XX analogous to producing fields to the north east. Attractive fiscal terms and the scalability of developments enable relatively small oil discoveries to be commercialised in the current oil price environment. Our risked valuation post assumed farm-out value dilution is 30.8p/share at 70$/bbl Brent long term. Valuation remains highly sensitive to oil price assumptions and exploration outcomes.
Year end |
Operating cash flow ($m) |
PBT* |
Net debt/(cash) ($m) |
Capex |
EBITDA ($m) |
12/16 |
1.8 |
10.8 |
(6.5) |
(0.6) |
11.1 |
12/17 |
(2.5) |
(9.9) |
(5.1) |
(3.1) |
(9.7) |
12/18e |
(5.4) |
(5.4) |
(16.7) |
(16.0) |
(5.5) |
12/19e |
(5.4) |
(5.4) |
1.5 |
(12.7) |
(5.5) |
Note: *PBT is normalised, excluding amortisation of acquired intangibles, exceptional items and share-based payments.
Mongolia onshore prospectivity
Petro Matad’s acreage combines high-impact exploration and low-risk targets across three blocks and multiple basins. Two exploration wells are planned for 2018 in Blocks IV and V, which offer frontier exploration but where good evidence of working petroleum systems is seen in surface outcrops. Block XX sits close to proven and producing fields in the Petro China operated Block XIX, providing potential early cash flow targets – two wells are planned for 2018. Three of the five Block XX lease line prospects identified have proven to be oil bearing in Block XIX.
Low F&D costs make for attractive risk/reward
Petro Matad’s prospect inventory benefits from low well costs, a simple development concept (using Block XIX as an analogue) and attractive fiscal terms that allow for cost recovery. Despite some uncertainty around offtake options, our analysis suggests an attractive risk/reward incentivising exploration. Even small oil discoveries (c 10mmbo) generate positive returns at $70/bbl Brent.
Valuation: High IRR developments minimise dilution
Valuation is based on the risked value of five identified and funded prospects. Petro Matad has identified significant exploration running room in the event of success. Our base case, risked valuation of 30.8p/share assumes 50% value dilution through farm-out. We note that the company expects standalone field developments to generate IRRs in excess of 50% based on a long-term oil price of $70/bbl Brent, hence our farm-out assumptions may prove to be conservative.
Investment summary
Low-cost, onshore, high-impact frontier exploration
Petro Matad offers investors exposure to an active exploration programme targeting multiple basins and play types onshore Mongolia. A combination of low well costs (just $2-4m for a development well), attractive production sharing contract (PSC) terms that enable cost recovery, and a sizeable prospective resource provide for an attractive risk reward. PetroChina’s current production at c 21kbod from Blocks XIX and XXI helps demonstrate that domestic logistical and infrastructure constraints can be overcome enabling commercial oil production. Petro Matad’s conceptual development studies suggest significant flexibility in engineering design such that small discoveries can be commercialised – Edison estimates a minimum economic volume of c 10mmbo for Blocks IV/V based on a long-term Brent oil price of $70/bbl (2022).
Valuation: Risked value of high-graded prospects
Our valuation is based on the expected monetary value (EMV) of five independent prospects: Snow Leopard; Wild Horse; Gazelle; Fox; Red Deer. The combined mid-case, unrisked prospective volume stands at over 831mmbo which we value at 265p/share in the unrisked exploration success case (we caveat that completely unrisked valuations do not take into account our view of geological, technical, commercial or political risks and should be used for indicative purposes only). Applying suitable risking, we reach a risked valuation of 62.1p/share (prior to 50% value dilution through farm-out) at $70/bbl long term (NPV12.5) on the assumption that the company’s six-well programme ($33m excluding overhead and PSC costs) is funded through the company’s combined $33m (net) fund-raise and existing cash. We estimate development project IRRs in the 50-120% range depending on discovery size, which we believe should attract farminee interest considering the exploration running room. Our base case valuation of 30.8p/share assumes $70/bbl Brent (2022) and conservative 50% value dilution through farm-out (see Appendix A for further detail). However, we note that if Petro Matad is able to debt finance development this would be potentially less dilutive. Including just the 2018 well programme, our valuation would be 19.0p/share.
|
Exhibit 1: RENAV per share waterfall and post-funding risked valuation range (NPV12.5) |
|
|
Source: Edison Investment Research. Note: *For exploration success case, unrisked NAV, see valuation section. |
Risks and sensitivities
Key components of risk include fiscal/country risk given Petro Matad’s single country exposure, geological/subsurface risk inherent of an exploration-led strategy in a frontier basin and funding risk. Key sensitivities include commodity price realisations and differentials, uncertainty over offtake costs/capital costs and the timing of development.
Company description
While Mongolia remains underexplored for hydrocarbons it has a buoyant mining industry, which is the country’s largest consumer of power. As of today, 100% of domestic production is exported to China while refined product is imported from Russia. The government of Mongolia is targeting the expansion of the country’s upstream and downstream oil and gas operations in order to meet domestic fuel demand and increase security of supply. The state of India has committed to investing up to $1bn in a domestic refinery in order to support this initiative. The planned refinery would be an obvious offtake route for Petro Matad oil discoveries. However, it is important to note that truck and rail transport routes also provide a path to refineries in Northern China.
Mongolia oil prospectivity: The exploration case
Petro Matad’s acreage is spread across multiple basins with varying risk profiles from high-impact frontier exploration with near-term drilling in Blocks IV and V in the west, to low-cost targets close to existing production in Block XX to the east. Although there has been no exploration drilling in Blocks IV and V, studies of outcrops together with core data from stratigraphic core holes have provided significant data and point to extensive clean sands and rich lacustrine source rocks in a proven petroleum system, which are likely to have better production characteristics than those seen to date in Mongolia. Significant upside could also be present in the turbidite fan complexes that have been identified across these blocks, although these will need to be assessed with 3D seismic. In Block XX, initial work will focus on targeting the extensions of producing trends and fields from the PetroChina operated Block XIX, and could provide a low-risk route to early cash flow.
Differentiated strategy: Low-cost onshore oil exploration
Petro Matad differentiates itself relative to its small-cap E&P peers through its focus on a low-cost, multi-well exploration strategy with material upside/running room in the event of success. Low costs, attractive fiscal terms and the scalability of development can make Block IV/V discoveries as small as 10mmbo commercial based on a $70/bbl long-term oil price. The break-even (NPV12.5 = zero) oil price for larger developments (>150mmbo) stands at sub $40/bbl Brent.
Management team and board
The Petro Matad team is chaired by Enkhmaa Davaanyam, the CEO of Petrovis Group, Mongolia’s largest fuel supplier. Ms Davaanyam provides a wealth of connections within Mongolia and board oversight. Petro Matad’s management team includes CEO Mike Buck and CFO John Henriksen –both worked for oil major ENI and held senior positions at Salamander Energy. Mike Buck has a geological/geophysical background, while John Henriksen is a qualified accountant and provides experience in financial management and business development.
Mongolia geology and exploration history
Estimates of Mongolia’s proven reserve base vary significantly, with some estimates suggesting a figure as high as 2.4bn barrels (source Wolf Petroleum current presentation), which would put it on a par with larger producers like Gabon and Colombia. The country’s petroleum potential has yet to be developed, while proven and producing fields sit in analogous and adjacent basins across the border in China. Oil has been produced in Mongolia since the 1940s, when the first oil wells were drilled in the East Gobi Basin. Two fields, Zuunbayan and Tsagaan-Els, were developed at this time and in 1950 construction of the country’s only refinery was completed. Oil from Zuunbayan was refined here until 1969 when the refinery was shut down due to declining production rates and economic factors. Industry development stagnated for the next 20 years. However, the collapse of the Soviet Union in 1989 acted as a catalyst for renewed investment in the sector. In 1993 the first PSC was signed and, in 1997, oil was discovered in Block XIX. Since then, drilling activity has focused on monetising discoveries, but the country remains vastly underexplored.
|
Exhibit 2: Proven and prospective basins in East-Central Asia |
|
|
Source: Petro Matad |
Although there are 30 PSCs in the country, to date only three blocks are producing and these are all operated by state-owned Chinese firms. Production from Zuunbayan restarted in 1998 from the Sinopec operated Block 97 in South East Gobi. This was joined in 1998 by production from the Toson-Uul field in PSC block XIX, and from Block XXI in 2009, with both of these eastern Mongolia blocks operated by PetroChina.
|
Exhibit 3: PSC blocks Mongolia (Petro Matad’s blocks shown in dark blue) |
Exhibit 4: Database for Blocks IV and V |
|
|
|
Source: Petro Matad |
|
Exhibit 3: PSC blocks Mongolia (Petro Matad’s blocks shown in dark blue) |
|
|
Source: Petro Matad |
|
Exhibit 4: Database for Blocks IV and V |
|
|
Source: Petro Matad |
90% of domestic output comes from Blocks XIX and XXI and is driven by Block XIX’s Tamsag field. Production has grown from 6kbod in 2010 to an average of 21kbod in 2017. Since 1998, production has been exported for refining in China, as there is no functioning refinery in Mongolia. The largest concession holders by acreage are juniors like Petro Matad and Australia-listed Wolf Petroleum with three blocks each.
Exploration history
Oil was first discovered by Soviet and Mongolian geologists in 1941, based on the observation of oil seeps and a surface anticline. The Zuunbayan field is located between Blocks XIII and XIV in the East Gobi and produced up to 4mmbo of oil between 1950 until 1969. Existing production from Blocks XIX and XXI comes from the Lower Cretaceous/Late Jurassic Tsagaantsav and Zuunbayan reservoirs, sourced by Lower Cretaceous lacustrine shales. Mongolia has a complex history of multiple strong tectonic movements resulting in the presence of a variety of trapping styles that can be identified on 2D seismic, including rotated fault blocks and thrusted anticlines that have provided favourable locations for hydrocarbon accumulation. In eastern Mongolia the reservoirs exhibit low permeability due to the presence of volcanic debris in the sediment that clogs the pore space. To the west in Blocks IV and V, the quality of the reservoirs is expected to be more favourable, with porosities between 10% and 30%. Studies on outcrop sections here indicate clean continuous sands that do not suffer from the volcanic deposits seen in the east. As is usual in lacustrine basins, any discovered oil is expected to be of a waxy nature. In Blocks XIX and XXI this has necessitated the use of insulation of field lines and standalone systems, but has not extended to requiring heating.
To date, most exploration and development wells have targeted reservoirs in structural traps, but 2D seismic data across Blocks IV and V also point to the presence of turbidite fan complexes, which have significant potential in analogous lacustrine basins in other basins around the world. These include the Vandana discovery in the Barmer Basin in India and the Sea Lion field in the North Falkland basin (NFB), where the Sea Lion complex is estimated to hold 2C resources of 517mmboe. These fan complexes are stratigraphic traps and will need to be properly identified on 3D seismic to be able to move from leads to prospects. However, they provide significant potential upside for the company.
Blocks IV and V
Petro Matad has identified prospects and leads across 12 basins in Blocks IV and V, and the mapped portfolio is estimated to hold mid-case, recoverable prospective resources of 2.2bn barrels. Three targets are drill ready and one of these, Snow Leopard in Block V, was planned to be spudded by mid-September 2017. Spudding was postponed because rig operator Sinopec was unable to obtain the necessary certification for the rig in time for drilling to be completed before winter conditions set in. Petro Matad has used the resulting extra time prior to drilling to enhance its drilling portfolio with the acquisition of additional seismic. This seismic acquisition commenced in November 2017 and was completed in early February 2018. The programme included 200km2 of 3D seismic in the Tugrug Basin in Block V and 2D seismic in the Khangai Basin in Block IV.
Two exploration prospects, Snow Leopard and Wild Horse, are planned to be drilled in 2018 with a further exploration well on the Fox prospect scheduled for Q219. The current exploration phase for the blocks expires in mid-2019, although a further two-year exploration extension is available.
In the case of commercial success, development wells are expected at this stage to be vertical fracked wells, which will require pumps to lift the produced fluids to surface. In eastern Mongolia the gas oil ratio (GOR) is low and if this is similar in Blocks IV and V, then it is expected that pressure support will need to come from water injection.
Exhibit 5 below provides a graphic visualisation of Petro Matad’s 2018 and 2019 exploration programme, showing unrisked value potential (prior to farm-out value dilution) versus Edison estimated chance of commercial success. Block IV and Block V prospects offer material value potential but are considered to be high-risk with chances of commercial success (Pc) in the 9% to 15% range.
|
Exhibit 5: Exploration efficient frontier for committed prospects |
|
|
Source: Edison Investment Research |
Snow Leopard (2018)
The Snow Leopard prospect in the Taats Basin in the west of Block V and is estimated to contain mid-case recoverable resources of 90mmbo. The well would be deep for Mongolia, at 3,350m. The risks here are around the presence of charge and source. 13 prospects and leads have been identified within the Taats Basin that would potentially be de-risked by success at Snow Leopard-1. The prospects have an estimated 500mmboe of recoverable resource in the mid-case.
|
Exhibit 6: Snow Leopard |
|
|
Source: Petro Matad |
Wild Horse prospect (2018)
Wild Horse sits in the Baatsagaan Basin in Block IV, updip of the two largest and deepest identified potential kitchen areas mapped in Petro Matad’s acreage. The prospect is estimated to hold mid-case recoverable resources of 480mmbo across three targets, the shallowest of which has a stratigraphic element. The target is shallower than those in Block V to the east as a result of erosion, so that the target depth (TD) of the well will be 1,850m. Success here will rely on the migration of hydrocarbons into the structural high, while interdependency between the three layers will depend on the effectiveness of the seal. Wild Horse has a closure area of 22km2 and a simple focused migration pathway has been identified from the south-west. The prospect is supported by a ‘soft’ (ie not volcanic) amplitude anomaly that conforms to structure, which could be an indication of hydrocarbon fluid charge. In addition to stacked pay potential, 14 prospects and leads have been identified within the Baatsagaan Basin with an estimated combined 750mmbo of recoverable resources in the mid-case.
Petro Matad’s mid-case estimate of Wild Horse prospective resource of 480mmbo is based on the volume estimates for three Jurassic stacked reservoir intervals. Geological inter-dependency between mapped reservoir targets increases the probability of either a highly successful event (multiple discoveries) or a low success outcome (no discoveries). We treat Wild Horse as a single prospect in our valuation.
|
Exhibit 7: Wild Horse |
|
|
Source: Petro Matad |
Fox prospect (2019)
The Fox prospect sits in the Tugrug Basin in the east of Block V and is estimated to hold mid-case recoverable resources of 200mmbo (60mmbo within identified primary target) across interbedded Jurassic and Cretaceous reservoir and shale source rock. The prospect is a tilted fault block (a proven model in the region) and is a three way dip closure against a fault. The well will be drilled to 4,000m for a cost of c $9m, which would make it one of the deepest wells to be drilled in Mongolia. The prospect is located south of a stratigraphic core hole drilled to 1,600m, which encountered live oil staining in the reservoir section, porous sands (10% to 30% porosity), good permeability and source rock with total organic content of 2-5%. Tests on extracted oil showed that it was unbiodegraded and lacustrine source derived. The 2017 3D seismic programme has aided the interpretation of Jurassic and Cretaceous reservoir rocks at Fox which are ideally located to receive charge from the Tugrug source kitchen. The key geological risk has been identified as trap effectiveness. In the Tugrug Basin success case, Petro Matad has identified seven prospects and leads within a 10km radius of Fox that would be partially de-risked by success in the Fox-1 well. The Fox-1 well will target a stacked reservoir system consisting of six pay intervals. We recognise that there will be geological risk inter-dependency between mapped reservoir sections/targets at Fox thereby increasing the probability of either a highly successful (multiple discoveries) or a low success outcome (no discoveries).
|
Exhibit 8: Fox prospect location |
Exhibit 9: Live oil staining in core |
|
|
|
Source: Petro Matad |
|
Exhibit 8: Fox prospect location |
|
|
Source: Petro Matad |
|
Exhibit 9: Live oil staining in core |
|
|
Source: Petro Matad |
Block XX
Block XX offers low-risk, low-cost exploration in an area close to proven and producing fields operated by PetroChina in Block XIX. The company has 130km2 of 3D seismic across the area drilled during the 2010/11 drilling campaign; however, PetroChina has further 3D over its producing acreage on the boundary between Blocks XIX and XX, which Petro Matad hopes it will be able to access in the future. Existing production per well in Block XIX is in the order of an average of 40bod, although it can be as high as 200-300bod. The tight nature of the reservoir means wells are fracked to improve productivity. Development well costs are low at $1-2m per well and the company estimates recoverable resources of 10-20mmbo in its lease line prospects, which could deliver early cash flow. Beyond the field extensions close to the block boundary, a number of analogous structures have been identified in the rest of the block that have the potential to provide upside.
The company will initially focus on the extensions of the structures on trend with the PetroChina fields into its acreage, and two wells will be drilled here in 2018. The wells will prioritise structures to the west of the block where reservoir quality and well productivity is observed to improve in the producing fields. Gazelle is an identified lease line prospect and is located adjacent to Block XIX and estimated to contain mid-case recoverable resources of 13mmbo. The Gazelle-1 well will be drilled to a total depth of c.2,300m, at an estimated cost of $2.5m. The location of the second well to be drilled in 2018 is yet to be confirmed.
One of the recognised analogous structures is the Red Deer prospect, located further away from Block XIX in the south-west area of the licence and identified following a review of existing 2D data. The prospect is estimated to contain mid-case prospective resources of 48mmboe and is expected to be drilled in 2019 at a cost of $2.9m. In the event of success, the well is located around 1km from the existing east to west trucking route. The exploration licence for Block XX has been extended and expires in July 2020.
|
Exhibit 10: Gazelle prospect location |
Exhibit 11: Red Deer prospect location |
|
|
|
Source: Petro Matad |
|
Exhibit 10: Gazelle prospect location |
|
|
Source: Petro Matad |
|
Exhibit 11: Red Deer prospect location |
|
|
Source: Petro Matad |
Mongolia development considerations and project economics
Mongolia has been a self-governing republic since 1991. With a population of just over three million people, Mongolia has the lowest population density in the world and the country’s GDP is heavily reliant on the mining sector – the nation’s largest consumer of energy. Coal dominates domestic power generation. However, Mongolia’s land mass and climate also make it suitable for alternatives such as solar, wind and hydro, which are likely to become competing power sources as technology evolves. Liquid fuels dominate the transportation sector and 100% of refined product is currently imported from Russia – there is political imperative to diversify this single source of supply. Currently Mongolia exports 21kbod of crude from Blocks XIX and XXI to refineries in China while importing refined product from Russia. This is expected to evolve over the next five years as foreign direct investment plays a part in developing a domestic downstream industry.
Why explore in Mongolia?
Beyond the geological rationale for exploration in Mongolia, which we discuss earlier in this note, there is a strong commercial rationale underpinned by several unique factors:
■
Low well costs (shallow wells cost just $1-2m while deeper development wells cost up to $4m) drive high expected monetary value (EMV).
■
Low population density – minimal above ground risk but can be a challenge for equipment mobilisation and resourcing.
■
Attractive fiscal terms with PSC cost recovery and 0% corporate tax. Key terms include: royalty at 5-8%; cost recovery capped at 40% of gross revenue; and contractor profit split at 45% to 60% depending on production rate.
■
Significant running room in the event of commercial discovery.
■
Recent increase in foreign direct investment, including Indian state funding for Mongolian refining capacity.
|
Exhibit 12: Mongolia contractor take versus other Asian/African fiscal regimes |
|
|
Source: Petro Matad, Edison Investment Research |
A key consideration for the development of oil discoveries in Mongolia are offtake options, ie the cost of transportation to buyers, be that by truck, rail or pipeline. Given the remoteness of the country’s hydrocarbon basins, pipeline construction and crude transport costs can have a significant bearing on project economics.
Petro Matad has identified several offtake options; we highlight some of these below:
1.
Mongolia refinery: Sainshand. Public announcements made in 2017 and Q118 suggest that plans are underway to construct a 1.5m tonne refinery (30kbd) in Sainshand Soum (district) at a cost of c $700m under a $1bn loan from the Import-Export Bank of India. This project has gained considerable momentum since the new government took office in H217. Crude from Block IV/V could be transported to Sainshand by truck or, if reserves justify, a dedicated pipeline.
2.
China refinery: Yumen. The Yumen refinery in Gansu province is known to have spare capacity and remains an offtake option via truck/railroad.
3.
China refinery: Ningxia. The Ningxia refinery is known to have spare capacity and remains an offtake option via truck/railroad.
4.
China refinery: Baota. The Baota refinery is known to have spare capacity and remains an offtake option via truck/railroad.
5.
China refinery: Hohhot refinery. The Hohhot refinery is known to have spare capacity and remains an offtake option via truck/railroad.
|
Exhibit 13: Identified offtake options |
|
|
Source: Petro Matad, Edison Investment Research |
Some uncertainty pertains with regard to the precise cost of various offtake options; we use company data on offtake costs, which are based on data obtained from Petrovis and US benchmarks. We note that company figures exclude the need for heated transport (required if the pour point of discovered waxy crude is high), which could add up to $2/bbl to opex costs. Given the uncertainty around price differentials, offtake options and costs, we have decided to use a conservative $5/bbl discount to Brent as a differential and company guidance on operational costs plus an additional 20% cost contingency.
Suitable development analogues for the development of resource onshore Mongolia include PetroChina’s development of c 160mmbo of resource in Block XIX and Block XXI; however, publicly available data on costs and productivity is sparse. Petro Matad believes that per well initial production (IP) rates range from just 40bod to 300bod, with estimated ultimate recovery (EUR) averaging 0.6mmbo. Given that better reservoir quality is expected in Block IV/V, management expects that in the event of an oil discovery, average IP rates and EUR will be higher than those found in Block XIX and Block XXI.
Edison’s capex cost assumptions are based on management guidance. Key assumptions include a development well cost of $3.9m, facility costs in line with domestic benchmarks and a conservative 40% development cost contingency to reflect engineering being at the conceptual design stage.
|
Exhibit 14: Block XIX, PetroChina operated production facility and tankage |
Exhibit 15: Crude oil production in Blocks XIX and XXI |
|
|
|
Source: Petro Matad |
|
Exhibit 14: Block XIX, PetroChina operated production facility and tankage |
|
|
Source: Petro Matad |
|
Exhibit 15: Crude oil production in Blocks XIX and XXI |
|
|
Source: Petro Matad |
As can be seen in Exhibit 14, total full-cycle unit costs range from $16.4/bbl to $33.5/bbl depending on development scenario. We believe these are broadly in line with onshore development analogues in frontier basins. For example, Tullow Oil quotes a full-cycle cost for discoveries onshore Kenya at $25-30/bbl (capex and opex including pipeline tariff).
As a basis for our valuation we estimate NPVs for potential small, medium and large oil discoveries as outlined below:
Exhibit 16: Field development scenarios and costs
Development size (mmbo) |
15 |
45 |
150 |
300 |
Offtake option |
Crude sold to domestic refinery at Sainshand |
Crude fills available ullage at Sainshand with remainder exported via truck and rail |
Crude fills available ullage at Sainshand. Pipeline operational in year 3 to Sainshand with remainder feeding ullage in Chinese refineries via rail from Sainshand |
Peak production (kbod) |
9 |
23 |
76.7 |
112.5 |
Producer well cost ($m) |
3.9 |
3.9 |
3.9 |
3.9 |
Licence period (years) |
25 |
25 |
25 |
25 |
Key opex inputs |
Facility opex including water injection and pour point suppression. Trucking to Sainshand |
Facility opex including water injection and pour point suppression. Trucking and rail costs |
Facility opex including water injection and pour point suppression. Pipeline operating costs |
Unit opex cost life of field ($/bbl) |
17.2 |
22.2 |
13.4 |
7.8 |
Key capex inputs |
Well costs, basic processing facility, tankage, export facility, power generation and water injection |
Well costs, basic processing facility, tankage, export facility, power generation and water injection. Pipeline costs |
Unit capex cost life of field ($/bbl) |
16.3 |
8.3 |
8.0 |
8.6 |
Source: Petro Matad, Edison Investment Research. Note: *Edison uses company guidance on offtake options and costs; however, we have included an additional 20% cost contingency within opex to reflect the potential for higher than estimated tariffs and/or heated truck/rail transport.
Conceptual production profiles for the development scenarios highlighted above are provided in Exhibit 15 below. Management assumes that initial production volumes will be used to fill available ullage at the planned 30kbod capacity domestic refinery in Sainshand, which we assume is operational in 2022. Volumes over and above available ullage at Sainshand will be exported to refineries in China via truck and railroad.
|
Exhibit 17: Development scenario production profiles |
|
|
Source: Petro Matad, Edison Investment Research |
Low volume threshold for commercial development
Based on our economic analysis, low well costs make it possible to scale a development to match the discovery resource size. This provides for a very low commercial threshold for oil given management’s current assumptions for well cost. Based on Edison’s long-term Brent oil price assumption of $70/bbl in 2022, we believe the commercial threshold for oil to be c 10mmbbl at $70/bbl Brent long term.
|
Exhibit 18: Positive NPVs even in small-field scenarios |
Exhibit 19: High unit NPVs at Edison Brent $70/bbl long term (2022) |
|
|
|
Source: Edison Investment Research |
|
Exhibit 18: Positive NPVs even in small-field scenarios |
|
|
Source: Edison Investment Research |
|
Exhibit 19: High unit NPVs at Edison Brent $70/bbl long term (2022) |
|
|
Source: Edison Investment Research |
High IRRs provide an attractive farm-out option post discovery
To value individual prospects we generate a relationship between prospect/development size and value per barrel for Block IV/V. Our analysis shows a higher value per barrel for larger discoveries based on our long-term oil price assumption of $70/bbl Brent, rising from $5.4/bbl for a 15mmbbl discovery to $6.5-7.7/bbl for larger discoveries. As can be seen in Exhibit 17, developments generate high IRRs, which should enable Petro Matad to farm-down its 100% equity interest in the event of discovery while minimising value dilution.
|
Exhibit 20: NPV12.5 $/bbl and post exploration IRR % |
Exhibit 21: Unit opex and capex cost by development scenario |
|
|
|
Source: Edison Investment Research |
|
Exhibit 20: NPV12.5 $/bbl and post exploration IRR % |
|
|
Source: Edison Investment Research |
|
Exhibit 21: Unit opex and capex cost by development scenario |
|
|
Source: Edison Investment Research |
Prospect EMVs are robust given low well costs, but commercial risk and uncertainty remain
We add an exploration overlay to our analysis, as decisions to drill are likely to be made on a case-by-case basis taking into account geological, technical and commercial risks, which we combine into our commercial chance of success (Pc). This risking incorporates probability of geological success (Pg) and probability of economic success (Pe). We calculate the expected monetary value (EMV) of an exploration prospect using the weighted value of failure (exploration well costs) plus the weighted value of success.
Petro Matad’s ability to scale development plans proportionally to discovered resource size, combined with relatively low well costs, means that even relatively high-risk prospects and small volumes are expected to deliver a positive EMV.
Valuation
Our valuation of Petro Matad is on the basis of risked value for the company’s drill-ready and committed prospects in blocks IV and V (Snow Leopard, Wild Horse and Fox), and block XX (Gazelle and Red Deer). The three larger Block IV/V prospects are viewed as risk independent as they target separate plays in two distinct hydrocarbon basins. Details of these prospects and justification for the unit NPV/boe values we use in our valuation are provided earlier in this note.
As with many E&Ps the unfunded risked value for prospects can be significant, and this is also the case for Petro Matad. In our base case valuation, shown in Exhibit 22 below, we include two elements of dilution that investors need to be cognisant of when investing in the small-cap E&P sector: 1) equity dilution to meet short-term exploration commitments; and 2) asset level working interest dilution through the farm-out of discoveries made during the exploration phase. We include the completed $33m (net proceeds) equity fund-raise to fund the company’s 2018 and 2019 exploration campaign, contingency and G&A. We also assume at this stage that Petro Matad retains 50% of asset value post farm-out (please see Appendix A for further details on our farm-out framework).
Exhibit 22: Petro Matad base case valuation
NOSH: 656.6m |
Country |
Diluted |
Pc** (%) |
Recoverable reserves |
Net risked |
Value per |
Discount rate |
||||
Asset |
Gross |
Net |
NPV/boe |
||||||||
12.5% |
10.0% |
15% |
|||||||||
Net cash at end 2017e |
100% |
100% |
5.1 |
0.6 |
0.6 |
0.6 |
|||||
Fund-raise $33m net |
100% |
100% |
33.0 |
3.7 |
3.7 |
3.7 |
|||||
SG&A – NPV12.5 of three years |
100% |
100% |
(13.0) |
(1.4) |
(1.4) |
(1.4) |
|||||
2018/2019 – committed prospects |
100% |
100% |
(30.0) |
(3.3) |
(3.3) |
(3.3) |
|||||
Core NAV |
|
|
|
|
|
|
-4.9 |
-0.5 |
-0.5 |
-0.5 |
|
Exploration |
|||||||||||
Snow Leopard 2018 |
Mongolia Block V |
50%* |
11% |
90.0 |
45.0 |
7.4 |
37.5 |
4.2 |
5.3 |
3.3 |
|
Wild Horse 2018 |
Mongolia Block IV |
50%* |
9% |
480.0 |
245.0 |
5.7 |
128.2 |
14.3 |
18.0 |
11.3 |
|
Fox 2019 |
Mongolia Block V |
50%* |
15% |
200.0 |
100.0 |
5.7 |
84.9 |
9.4 |
11.9 |
7.5 |
|
Gazelle 2018 |
Mongolia Block XX |
50%* |
38% |
13.0 |
4.0 |
4.0 |
9.8 |
1.1 |
1.4 |
0.9 |
|
Red Deer 2019 |
Mongolia Block XX |
50%* |
23% |
48.0 |
24.0 |
4.0 |
21.6 |
2.4 |
3.0 |
1.9 |
|
Exploration NAV |
|
|
|
|
|
|
281.9 |
31.3 |
39.6 |
24.9 |
|
RENAV |
|
|
|
|
|
|
277.0 |
30.8 |
39.1 |
24.3 |
|
Source: Edison Investment Research. Note: *Reflects value retained after assumed development farm-down. **Pc=Pg X Pe. Pg assumed at 15% for Snow Leopard, 12.5% for Wild Horse, 50% for Gazelle, 20% for Fox and 30% for Red Deer. Pe assumed to be 75%.
Our valuation is sensitive to several key assumptions such as oil price, WACC, farm-out dilution and development costs. The valuation waterfall below provides a breakdown of our risked valuation prior to farm-down at 62.1p/share, followed by what this potential could look like post farm-down at a range of oil prices. Edison’s base case valuation of 30.8p/share is on the basis of a $70/bbl Brent long-term oil price and 50% asset level value dilution. We note that the market is currently assuming a lower oil price assumption and a higher risking/asset level dilution than Edison’s base case valuation. In the exploration success case, our unrisked valuation would be significantly higher than our base case 30.8p/share risked valuation at 265p/share. We caveat that completely unrisked valuations do not take into account our view of geological, technical, commercial or political risks and should be used for indicative purposes only.
|
Exhibit 23: RENAV waterfall and post-funding risked valuation range (NPV12.5) |
|
|
Source: Edison Investment Research |
Please see our report on E&P investment considerations (published September 2016) for further details on E&P cost of capital and its impact on shareholder value through-cycle. We note that Petro Matad benefits from high IRR development projects based on Edison’s long-term oil price assumption of $70/bbl Brent (2022) and as such our base case assumption of 50% value dilution through farm-out is conservative. Actual farm-out terms will depend on several factors, including farminee risk appetite, planning assumptions and internal analysis of development returns.
Below we provide a RENAV valuation sensitivity to our long-term Brent oil price assumption and value dilution through farm-out.
Exhibit 24: RENAV (p/share) sensitivity to long-term oil price assumption and farm-out value dilution
Brent oil price $/bbl |
|||||
Value dilution % |
50 |
60 |
70 |
80 |
90 |
20% |
(0.3) |
24.6 |
49.6 |
74.2 |
95.0 |
30% |
(0.4) |
21.4 |
43.3 |
64.8 |
83.1 |
40% |
(0.4) |
18.3 |
37.1 |
55.5 |
71.1 |
50% |
(0.4) |
15.1 |
30.8 |
46.2 |
59.2 |
60% |
(0.4) |
12.0 |
24.5 |
36.8 |
47.2 |
Source: Edison Investment Research
Risks and sensitivities
We see the risks below as representative of all of the independent E&Ps focused on exploration and appraisal.
Company-specific risks
■
Fiscal/country risk – Petro Matad’s operations are geographically concentrated. On a stand-alone basis the company is exposed to changes in fiscal terms and perceived country risk. Fiscal terms are viewed as compelling relative to other frontier basins. The Petroleum Law of Mongolia was adopted in 1981 and later revised in 2014 providing a clear and transparent environment for investment. The natural resources sector in Mongolia accounts for more than half of the country’s GDP, providing incentive for the state to maintain a consistent approach to licensing and taxation.
■
Geological – Petro Matad is focused on a number of independent basins with varying play types across Blocks IV, V and XX. Geological risk is typical of an exploration biased independent E&P, but reduced through the company’s multi well programme targeting independent basins.
■
Development/third-party risk – A key risk/uncertainty in our view is the lack of firm information on the timing and scale of a potential domestic refinery. We assume domestic refining capacity is available from 2022 in our economic analysis but without this, Petro Matad would be exposed to the additional costs involved with selling crude to Chinese refineries.
■
Financial – As with most capital-constrained independent E&Ps, Petro Matad is reliant on a wide range of sources of capital to progress exploration activity and to monetise assets in the event of exploration success. The cost of capital will depend on source, but expensive sources of capital including farm-outs and equity can lead to material asset/shareholder dilution.
Generic sector risks
■
Commodity price – As with all companies operating in the upstream oil and gas sector, returns are driven by underlying commodity prices. Petro Matad is not immune, with the bulk of the company’s prospects leveraged to the price of Brent crude.
■
Supply chain – Upstream project returns are driven by a combination of commodity price, project operating and capital costs and fiscal regimes. An important consideration is the availability and cost of equipment and personnel. Costs for both human and physical assets tend to be positively correlated to the oil price.
■
Political – Risks are largely specific to the country of operation. Moody’s provides a Caa1 stable credit rating for Mongolia, citing the country’s strong growth potential and abundant mineral resources, but also flags a narrowly diversified economy exposed to commodity price swings. Moody’s expects real GDP growth of 4.2% in 2017 and 4.3% in 2018 from just 1% in 2016.
Management
Enkhmaa Davaanyam (non-executive chairperson): Ms Davaanyam is the CEO of Petrovis Group, Mongolia’s largest fuel supplier. She has over 19 years’ international experience in financing and risk management of mining, infrastructure and energy projects and commodities trading. She has served as deputy chair of the board of directors of Petrovis Group since 2011 and was appointed as the CEO in August 2013. Prior to joining Petrovis Group, Ms Davaanyam worked as a managing director at Macquarie Group for over 10 years, responsible for risk management in the energy sector in the US. Ms Davaanyam was appointed as Petro Matad’s chairperson in 2015.
Michael Buck (CEO): Mike Buck is an explorer by background and spent the first 20 years of his career with UK independent E&P company, LASMO, rising from graduate geophysicist to exploration manager and on to managing director of overseas business units. Following the acquisition of LASMO by Eni he was appointed managing director of Eni's Pakistan Geographic Unit and thereafter of the Iran Geographic Unit. Mr Buck has been directly involved in the discovery of over 1bnboe of recoverable reserves including: Indonesia – Kurau, Selatan, W. Kerendan, MDBD; Colombia – Juncal, El Palmar, Los Trompillos, Guepaje, Venganza, Purificacion; Libya – Elephant.
Mr Buck joined Salamander Energy in August 2006, was appointed to the board as an executive director in October 2006 and was Salamander's chief operating officer until March 2015 when Salamander was acquired by Ophir Energy. He was retained by Ophir until end 2015 to help with the integration of the two businesses. He subsequently worked as a consultant to numerous operating E&P companies in Asia before joining Petro Matad in October 2017.
John Henriksen (CFO): Mr Henriksen has 35 years’ experience in the international oil industry and in April 2012 assumed the role of CFO for the Petro Matad Group, based in Ulaanbaatar. Prior to this, he was the country manager for Salamander Energy’s Indonesian operations. Prior to Salamander, Mr Henriksen worked in senior financial roles for VICO, ENI, LASMO and Hudson’s Bay Oil & Gas, ultimately being responsible for all aspects of financial management, reporting and internal control. A substantial portion of Mr Henriksen’s career has been spent overseas in developing countries and as a result he has a full understanding of cultural sensitivities and working with local governments and partners. Mr Henriksen is a qualified accountant and holds a bachelor of commerce degree from the University of Alberta in Canada.
Tim Bushell (technical non-executive director): Tim Bushell is a geologist by training with over 35 years’ experience in the international upstream oil and gas industry. For 10 years he was CEO of Falklands Oil and Gas. During his career he has been directly involved in the discovery of over 700mmboe of recoverable reserves. These include: Falklands – Zebedee, Elaine/Isobel. Norway – Hyme, Snilehorn, Brasse and others. Mr. Bushell joined the Board of Petro Matad in April 207. He is also on the boards of Rockhopper and Genel and is a founder and advisor to Point Resources, a private equity-backed Norway-focused E&P company.
Dr Oyungerel Janchiv (non-executive director): Dr. Oyungerel graduated from the Institute of Petrochemical and Gas Industry, Moscow in 1979. She began her career as an economist at the Ulaanbaatar Oil Terminal and in 1982 became the chief economist at the Petroleum Supply department at the Mongolian Ministry of Transportation where she was employed until 1991. In 1991, she was appointed CEO of the Petroleum Import Concern of Mongolia and in 1994 became the CEO and chair of the board of directors of the government-owned company, Neft Import Company (NIC). In 1996, she founded Petrovis LLC and was the CEO until January 2008 and has been chair ever since. In January 2007, she completed a doctorate in economics in Moscow, Russia. In 2010, she became a non-executive director of Mongolian Mining Corporation (MMC) which is listed on the Hong Kong Stock Exchange. MMC is a high quality coking coal producer and exporter in Mongolia. On 15 August 2014, she was appointed chairperson of Ard Financial Group.
Financials
Petro Matad is an early stage E&P, hence current earnings and short-term P&L projections have little relevance. The company’s income statement as it stands simply reflects the ongoing cost of running the company’s Mongolian operations and corporate function. The positive cash flow impact of an oil development is unlikely to have a material impact on earnings and cash flow until 2021 at the earliest, in our view.
There is potential for earlier cash flows if Petro Matad is able to unitise oil fields that straddle Block XX and Block XIX with PetroChina, or if the company pursues an early production system based on discoveries made in Block IV/V. We intend to update our short-term forecasts if and when there is more visibility on short-term production and cash flow.
Key elements of short-term cash flow include:
■
Petro Matad closed 2017 with c $5.1m of cash and has since completed two equity fund-raises; $16m net in January 2018 and $17m net in June 2018; additional funding would be required to commit to an exploration programme and to support group G&A beyond 2019.
■
We assume a capex cost of $16m for the 2018 well programme including contingency but excluding overheads and PSC costs, with a cost of $4m for Wild Horse, $7m for Snow Leopard (of which $1m spent in 2017) and $2.5m for the shallower Block XX wells. 2019 wells are expected to cost $9m for Fox and $2.9m for Red Deer.
Exhibit 25: Financial summary
|
|
$ms |
2016 |
2017 |
2018e |
2019e |
Dec |
|
|
IFRS |
IFRS |
IFRS |
IFRS |
PROFIT & LOSS |
||||||
Revenue |
|
|
18.9 |
0.2 |
0.0 |
0.0 |
Cost of Sales |
0.0 |
0.0 |
0.0 |
0.0 |
||
Gross Profit |
18.9 |
0.2 |
0.0 |
0.0 |
||
EBITDA |
|
|
11.1 |
(9.7) |
(5.5) |
(5.5) |
Operating Profit (before amort. and except.) |
|
|
10.9 |
(9.9) |
(5.5) |
(5.5) |
Intangible Amortisation |
0.0 |
0.0 |
0.0 |
0.0 |
||
Exceptionals |
0.0 |
0.0 |
0.0 |
0.0 |
||
Other |
0.0 |
0.0 |
0.0 |
0.0 |
||
Operating Profit |
10.9 |
(9.9) |
(5.5) |
(5.5) |
||
Net Interest |
(0.1) |
0.0 |
0.0 |
0.0 |
||
Profit Before Tax (norm) |
|
|
10.8 |
(9.9) |
(5.4) |
(5.4) |
Profit Before Tax (FRS 3) |
|
|
10.8 |
(9.9) |
(5.4) |
(5.4) |
Tax |
0.0 |
0.0 |
0.0 |
0.0 |
||
Profit After Tax (norm) |
10.8 |
(9.9) |
(5.4) |
(5.4) |
||
Profit After Tax (FRS 3) |
10.8 |
(9.9) |
(5.4) |
(5.4) |
||
Average Number of Shares Outstanding (m) |
287.5 |
308.5 |
631.9 |
662.2 |
||
EPS - normalised (c) |
|
|
0.0 |
(0.0) |
(0.0) |
(0.0) |
EPS - normalised and fully diluted (c) |
|
|
0.4 |
(0.3) |
(0.1) |
(0.1) |
EPS - (IFRS) (c) |
|
|
0.0 |
(0.0) |
(0.0) |
(0.0) |
Dividend per share (c) |
0.0 |
0.0 |
0.0 |
0.0 |
||
Gross Margin (%) |
100.0 |
100.0 |
#DIV/0! |
#DIV/0! |
||
EBITDA Margin (%) |
58.9 |
-4599.5 |
#DIV/0! |
#DIV/0! |
||
Operating Margin (before GW and except.) (%) |
57.7 |
-4728.6 |
#DIV/0! |
#DIV/0! |
||
BALANCE SHEET |
||||||
Fixed Assets |
|
|
16.1 |
15.9 |
31.9 |
44.6 |
Intangible Assets |
15.3 |
15.3 |
15.3 |
15.3 |
||
Tangible Assets |
0.8 |
0.6 |
16.6 |
29.3 |
||
Investments |
0.0 |
0.0 |
0.0 |
0.0 |
||
Current Assets |
|
|
12.2 |
8.6 |
20.1 |
3.5 |
Stocks |
0.5 |
3.5 |
3.5 |
3.5 |
||
Debtors |
5.2 |
0.0 |
0.0 |
0.0 |
||
Cash |
6.5 |
5.1 |
16.7 |
0.0 |
||
Other |
0.0 |
0.0 |
0.0 |
0.0 |
||
Current Liabilities |
|
|
(1.4) |
(3.4) |
(3.4) |
(3.4) |
Creditors |
(1.4) |
(3.4) |
(3.4) |
(3.4) |
||
Short term borrowings |
0.0 |
0.0 |
0.0 |
0.0 |
||
Long Term Liabilities |
0.0 |
0.0 |
0.0 |
(1.5) |
||
Long term borrowings |
0.0 |
0.0 |
0.0 |
(1.5) |
||
Other long term liabilities |
0.0 |
0.0 |
0.0 |
0.0 |
||
Net Assets |
|
|
26.9 |
21.1 |
48.6 |
43.2 |
CASH FLOW |
||||||
Operating Cash Flow |
|
|
1.8 |
(2.5) |
(5.4) |
(5.4) |
Net Interest |
0.0 |
0.0 |
0.0 |
0.0 |
||
Tax |
0.0 |
0.0 |
0.0 |
0.0 |
||
Capex |
(0.6) |
(3.1) |
(16.0) |
(12.7) |
||
Acquisitions/disposals |
0.0 |
0.0 |
0.0 |
0.0 |
||
Financing |
(0.0) |
4.2 |
33.0 |
0.0 |
||
Dividends |
0.0 |
0.0 |
0.0 |
0.0 |
||
Net Cash Flow |
1.1 |
(1.4) |
11.6 |
(18.1) |
||
Opening net debt/(cash) |
|
|
(5.3) |
(6.5) |
(5.1) |
(16.7) |
HP finance leases initiated |
0.0 |
0.0 |
0.0 |
0.0 |
||
Other |
(0.0) |
0.0 |
0.0 |
0.0 |
||
Closing net debt/(cash) |
|
|
(6.5) |
(5.1) |
(16.7) |
1.5 |
Source: Edison Investment Research, Petro Matad accounts. Note: *$33m net equity fund-raise. **$16m 2018 exploration programme. ***Farm-in proceeds to cover capex beyond 2020.
|
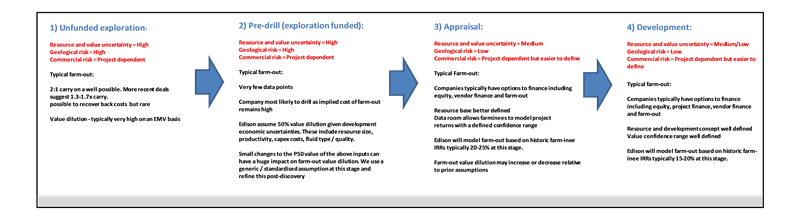
Appendix A Edison uses a farm-out framework when valuing E&P assets that are not self-funded through to first oil. In general, the extent of value dilution Edison assumes through farm-out decreases as asset certainty and risk decreases as shown in Exhibit 24. Given current uncertainty with regard to un-risked resource size, productivity, oil quality, and costs we use a generic assumption of 50% value dilution (stage 2 of our framework) for Petro Matad which we intend to refine post-drill. Exhibit 26: Edison E&P farm-out framework |
|
|
Source: Edison Investment Research |
|
|||||||||||||||||||||||||||||||||||||||||||||||||||||
|
|
Research: Industrials
IBU-tec has completed the acquisition of speciality chemicals company BNT Chemicals in a transformative deal that substantially expands the type of chemical treatments deployed, the markets served and the customer-base. Management estimates this will more than double annualised revenues and be immediately earnings enhancing with the potential to substantially improve BNT’s profitability in the medium term. The terms of the transaction were not disclosed. The consideration was payable in cash using some of the funds from the IPO and bank loans.