Last close As at 07/08/2026
—
— 0.00 (0.00%)
Market capitalisation
—
Research: Financials
DeA Capital has continued to be active in its direct investment portfolio in the opening months of FY17, returning to direct investment with a stake in a newly created and listed special purpose acquisition vehicle and a further reduction in its Migros stake. Q117 also saw further growth in AUM and a positive investment performance. Returning growth momentum to asset management and a diverse investment portfolio have the potential to create further value. Meanwhile the prospect of cash inflows as private equity fund investments mature provides a measure of protection against any rise in market volatility.
DeA Capital |
Growth, value and income |
Post Q117 outlook |
Financial services |
12 June 2017 |
Share price performance
Business description
Next events
Analysts
DeA Capital is a research client of Edison Investment Research Limited |
|||||||||||||||||||||||||||||||||||||||||||||||
DeA Capital has continued to be active in its direct investment portfolio in the opening months of FY17, returning to direct investment with a stake in a newly created and listed special purpose acquisition vehicle and a further reduction in its Migros stake. Q117 also saw further growth in AUM and a positive investment performance. Returning growth momentum to asset management and a diverse investment portfolio have the potential to create further value. Meanwhile the prospect of cash inflows as private equity fund investments mature provides a measure of protection against any rise in market volatility.
Year end |
Average AUM* (€bn) |
Fees from AAM** (€m) |
NAV/share |
DPS (declared) |
P/NAV |
Yield |
12/15 |
10.2 |
64.7 |
2.07 |
0.12 |
0.60 |
9.7 |
12/16 |
9.9 |
61.0 |
2.03 |
0.12 |
0.61 |
9.7 |
12/17e |
10.9 |
59.9 |
2.01 |
0.12 |
0.62 |
9.7 |
12/18e |
11.0 |
61.9 |
1.96 |
0.12 |
0.63 |
9.7 |
Note: NAV is stated NAV, including goodwill. *AUM is ex-SPC Credit Management. **Before inter-company eliminations.
A good start to 2017
AUM continued to grow during Q117, reaching c €10.9bn with an additional €0.5bn at SPC that we track separately. NAV per share increased to €2.08 (cum the FY16 dividend) compared with €2.03 at year end, driven by a recovery in the value of Migros (worth 3c per share) and gains on fund holdings, particularly the IDeA EESS (energy efficiency) Fund, in which DeA doubled its ownership share to c 30% late in FY16. Since Q1 DeA has completed a further partial exit from Migros via the exercise of a put option at TRY30.2 per share, raising an immediate €17.8m in cash. The sale crystallises a €3.8m P&L gain with a small €0.6m reduction in NAV.
With an additional boost to dividend capacity
The Migros transaction further strengthens DeA’s holding company net financial position (to an estimated €53m after the Q2 dividend payment) and supports continuing share repurchases and dividend distributions well ahead of recurring asset management profits. Management expects net divestment from maturing private equity funds to accelerate and, subject to market conditions, looks for a potential c €130-150m over the next three to four years, a potentially significant sum for reinvestment in new fund launches, new investments or distribution to shareholders, even after meeting outstanding investment commitments.
Valuation: Discount remains conservative
Our updated sum-of-the-parts (SOP) valuation at €1.88 (ex the recently paid €0.12 FY16 dividend) is little changed. Compared with the Q117 NAV per share of €1.96 (ex div), it replaces the book value of asset management with our estimated fair market value based on a peer comparison (see page 12) and it values the residual stake in quoted Migros at market. The c 37% share price discount continues to appear conservative given the new momentum in asset management, the diversity of its investment portfolio and the potential for investment realisations.
Investment summary: Growth, value and income
Alternative asset management and investment
DeA Capital (DeA) is one of Italy’s largest alternative investment operators, and is active as both an investor and a manager of assets. The investment division invests the group’s own permanent capital both directly via strategic stakes in companies and indirectly via funds, overwhelmingly managed by the group’s asset management division. DeA is majority owned by De Agostini, a group with other investments in the media, gaming and services sectors with a 58.3% stake (Exhibit 3); De Agostini is in turn owned by the Boroli and Drago families. The group in its current form was established by De Agostini in early 2007 as a vehicle in which to focus all of its alternative investment operations. The early focus of the group was on building up the direct private investment portfolio but in recent years this has been reducing and is currently c €300m in size. The alternative asset management platform comprises 64.3%-owned IDeA FIMIT, which manages €9.0bn in real estate funds, fully owned IDeA Capital Funds, which manages €1.9bn of private equity funds and, since June 2016, a stake (currently 68.7%) in SPC Credit Management, a restructurer and outsourced manager of non-performing loans (NPLs). The IRE business, formerly a subsidiary, is now 45% owned and provides property management and brokerage services. The group benefits from an experienced team of more than 180 investment professionals, a strong financial position, and strong connections within the Italian financial markets.
The group’s direct investments seek to benefit from the flexibility in timing of the entry and exit of investments that permanent capital allows (compared with a typical limited duration PE fund), while a strong capital position also allows the group to provide seed capital support to its own-managed range of fund offerings. DeA has steadily broadened its asset management capabilities so as to provide a recurring income balance within the group to the more volatile returns that are typical of private equity investment. On a global basis, low interest rates continue to stimulate demand for alternative assets (private equity, real assets, hedge funds) from investors seeking sustainable yields, although as we discuss below the group has had to deal with a number of headwinds particular to the Italian environment. A global report produced by PwC (“Alternative Asset Management 2020: fast forward to centre stage”) in 2015 shows that alternative assets have been growing at twice the rate of traditional investments over the past decade and forecasts further growth of c 8% pa to 2020.
Significant progress with strategic refocus
The global financial crisis had a significant impact on listed private equity valuations including that of DeA Capital. However, despite the benefit of the group’s permanent capital structure its valuation was slow to recover. Responding to this situation, from early 2013 management initiated a programme to:
1.
Sell its direct private equity investments, pay down debt and return a large part of the excess cash to shareholders.
2.
Increase its alternative asset management activities, which have more earnings visibility and stable cash flows than its direct private equity activities.
A by-product of shifting the weight of value of the group towards the alternative asset management activities and away from unquoted direct investments (Exhibits 1 and 2) is that it improves transparency.
During the past three years DeA Capital has made significant progress with this strategy and, as we show in the Valuation section (page 12), the wide discount to net asset value on which the shares trade has been reducing and trading volume in the shares has begun to increase.
■
Direct investments have reduced from 48% of invested assets at the end of FY13 to 20% as of 31 March 2017. In 2014, DeA Capital sold a 43% stake in GDS, a French healthcare provider, generating proceeds of €169m and in 2015 halved its position in Migros, a Turkish food retailer, generating a further c €108m of cash. A further reduction in the Migros stake has just been completed (see page 5, generating immediate proceeds of c €17.8m and realising a capital gain of €3.8m. Invested assets adjusts the net asset value analysis shown in Exhibit 6 for the holding company net financial position.
|
Exhibit 1: Split of net invested assets* Q117 |
Exhibit 2: Split of net invested assets* FY13 |
|
|
|
Source: DeA Capital. Note:*NAV less €66.1m net cash (holdings). |
Source: DeA Capital. Note: *NAV less €138.7m net debt (holdings). |
|
Exhibit 1: Split of net invested assets* Q117 |
|
|
Source: DeA Capital. Note:*NAV less €66.1m net cash (holdings). |
|
Exhibit 2: Split of net invested assets* FY13 |
|
|
Source: DeA Capital. Note: *NAV less €138.7m net debt (holdings). |
■
The holding company net financial position (defined as holding company cash and cash equivalents, available for sale financial assets, financial receivables less non-current liabilities and current financial liabilities) has moved from net debt of c €139m at the end of FY13 to net cash of c €66m at the end of Q117 (and we estimate a pro forma c €53m allowing for the recent Kenan/Migros option exercise, as well as the Q217 payment of the c €31m FY16 dividend).
■
A substantial share of realisation proceeds have been returned to shareholders through stock repurchases for treasury and special dividend distributions. Over the past three years, DeA has increased its holding of treasury shares from 10.6% of the total to 15.3% as at the end of Q117 at a cost of c €23m. It has since increased to 15.5% and the group has authority to repurchase up to 20% of the shares. Around €82m was distributed by way of a reduction in capital in respect of the FY14 year and in FY15 and FY16 DeA Capital has continued to distribute c €30m pa, which we anticipate continuing over the next couple of years.
|
Exhibit 3: DeA Capital shareholder structure |
Exhibit 4: Treasury share purchase (million shares) |
|
|
|
Source: DeA Capital. Note: As at 31 March 2017 |
Source: DeA Capital |
|
Exhibit 3: DeA Capital shareholder structure |
|
|
Source: DeA Capital. Note: As at 31 March 2017 |
|
Exhibit 4: Treasury share purchase (million shares) |
|
|
Source: DeA Capital |
■
In addition, DeA Capital continues to invest in both its portfolio and its alternative asset management capabilities. In Q316 it acquired a majority stake in SPC Credit Management, providing it with in-house expertise in non-performing loan (NPL) management. During Q117, DeA made its first direct investment for several years, investing €7.8m in a 5.8% stake in a newly formed and listed special purpose acquisition company (SPAC) named Crescita. Additionally, it continues to support fund initiatives and made new commitments of c €32m in 2016.
In the following section we provide a more detailed look at the structure of the group and in later sections look at each of the divisions in greater detail. In the Financials section on page 9, we provide an explanation of how the group reports the returns from its activities in the financial statements.
A closer look at the group’s structure and operations
In Exhibit 5 we show an overview of the group structure, split between direct private equity investments, indirect investments in funds, and the group’s alternative asset management division.
|
Exhibit 5: DeA Capital group structure |
|
|
Source: DeA Capital |
In Exhibit 6 we show a breakdown of the group’s net asset position. At the end of Q117, DeA had group shareholders’ equity of €540.4m or €2.08 per share. Of this, €472.8m represented the value of the investment portfolio, split between private equity investments (direct investments and fund investments) of €303.4m and the investment in the alternative asset management division of €169.4m. The group net financial position of €66.1m represented c €0.25 per share or c 12% of the total. We also show our estimate of the pro forma position, adjusted for the recent Kenan/Migros option exercise, increasing the net financial position and reducing the direct investment further. The FY16 dividend has also now been paid and, allowing for this, the pro forma Q117 holding company net financial position of €83.9m reduces to c €53m. The Q117 growth in NAV per share was driven by an increase in the value of the Kenan/Migros holding and the value of the group’s private equity fund investments.
Exhibit 6: Group NAV analysis
Net assets (€m) |
NAV per share (€) |
||||||||
Q117 pro forma |
Q117 |
FY15 |
FY16 |
Q117 pro forma |
Q117 |
FY15 |
FY16 |
||
Private equity investments |
|||||||||
Kenan (Migros) |
56.5 |
74.9 |
76.3 |
66.9 |
0.22 |
0.29 |
0.29 |
0.26 |
|
Private equity/real estate funds |
208.7 |
208.7 |
194.1 |
202.9 |
0.80 |
0.80 |
0.74 |
0.78 |
|
Crescita |
8.1 |
8.1 |
0.0 |
0.0 |
0.03 |
0.03 |
0.00 |
0.00 |
|
Sigla & other |
11.7 |
11.7 |
11.7 |
11.7 |
0.05 |
0.05 |
0.04 |
0.04 |
|
Total |
285.0 |
303.4 |
282.1 |
281.5 |
1.10 |
1.17 |
1.07 |
1.08 |
|
Alternative asset management |
|||||||||
IDeA FIMIT SGR |
124.0 |
124.0 |
121.7 |
122.7 |
0.48 |
0.48 |
0.46 |
0.47 |
|
IDeA Capital Funds SGR |
38.4 |
38.4 |
39.7 |
37.7 |
0.15 |
0.15 |
0.15 |
0.14 |
|
IRE |
7.0 |
7.0 |
11.3 |
6.9 |
0.03 |
0.03 |
0.04 |
0.03 |
|
Total |
169.4 |
169.4 |
172.7 |
167.3 |
0.65 |
0.65 |
0.65 |
0.64 |
|
Investment portfolio |
454.4 |
472.8 |
454.8 |
448.8 |
1.75 |
1.82 |
1.72 |
1.72 |
|
Other |
1.5 |
1.5 |
2.2 |
0.7 |
0.01 |
0.01 |
0.01 |
0.00 |
|
Net financial position (Holdings) |
83.9 |
66.1 |
58.4 |
79.7 |
0.32 |
0.25 |
0.22 |
0.31 |
|
Net asset value |
539.8 |
540.4 |
515.4 |
529.2 |
2.08 |
2.08 |
1.95 |
2.03 |
|
Source: DeA, Edison Investment Research. Note: Pro forma is adjusted for Migros partial sale but does not adjust for the Q2 payment of the FY16 dividend of c €31m.
Private equity investments
Direct private equity investment portfolio
The direct investments mainly comprise Migros, a large Turkish food retailer, Sigla Credit, an Italian provider of salary backed loans and personal loans, and since Q117 Crescita, the newly formed and listed SPAC. The Migros investment is held indirectly through DeA’s 17.11% investment in Kenan Investments. At the end of 2016 Kenan owned 40.25% of Migros but has recently exercised an option to sell 9.75% at an effective price of TRY30.2 per share (current price c TRY26.6). DeA’s share of the proceeds is €22.2m, of which it has received €17.8m, with €4.4m retained by Kenan in escrow until 2020 to cover any potential tax liability that may emerge. The transaction will trigger a €3.8m gain in the P&L account, with €4.4m charged to the fair value reserve through other comprehensive income generating a small (€0.6m) reduction in NAV. Kenan retains a 30.5% stake in Migros, of which DeA’s effective share is 5.2% with a current value of €54.3m (see page 13).
DeA owns 41.4% of Sigla Credit. It has been on improving performance trend with an increased focus on salary backed loans and a recovery in its portfolio of personal loans. At the end of 2015 it was designated a held for sale asset when DeA launched an ongoing process to sell its holding.
DeA’s participation in the recently listed Crescita is its first direct investment for several years. The total outlay was €7.8m, for which DeA acquired 5.8% of the ordinary shares and 9.2% of the preference shares. The investment was valued at €8.1m at the end of Q117 following an early rise in the price of ordinary shares. The SPAC’s objective is to complete a business combination with a yet to be identified Italian target company within 24 months of listing or return the capital. On a successful combination, the original investors will likely see their ownership stake diluted as the capital base is enlarged.
Investment in private equity funds
DeA’s fund investments are primarily in funds managed by the group. They include seven PE funds managed by the subsidiary DeA Capital Funds, two funds managed by the real estate management subsidiary IDeA FIMIT, and units in six externally managed venture capital funds.
The fund investments primarily reflect management’s desire to utilise a strong capital base in providing seed capital support to its own-managed range of fund offerings. With this purpose in mind, new commitments of c €32m were made in 2016, with undrawn commitments ending the year at c €108m. The new commitments included c €11m to IDeA Taste of Italy, c €15m to IDeA CCR 1, and c €1m to Santa Palombo. Additionally, DeA’s undrawn commitment to IDeA EESS (energy efficiency fund) increased by up to a maximum €5m when it increased its stake from 15.3% to 30.4% at a cost of €5.35m, representing a 20% discount to the fund value at the time. The move seems well timed given the strong upwards move in the fund value in Q117.
We show an overview of the fund investments in Exhibit 7. There is considerable concentration in three of the funds, IDeA I FoF, IDeA Opportunity Fund, and to a lesser extent ICFII. Together these three funds represent 71%, 53% and 76% of DeA’s overall fund exposure in terms of total commitments, outstanding commitments and holding value, respectively. Significantly, these three funds also represent the older vintages (2009 and prior) of the DeA Capital fund stable and are expected to see a continued increase in fund reimbursements and reduction in fund size.
Exhibit 7: Overview of fund investments
€m |
|
Fund description |
DeA commitment |
Total committed capital |
DeA investment as % total |
DeA holding value |
||
Total |
Outstanding |
% drawn |
31-Mar-17 |
|||||
IDeA I Fund of Funds |
Jan 2007 |
Fund of 41 funds with range of investment strategies; in turn holding positions with varying maturities in 330 companies, differentiated by geography |
173.5 |
25.3 |
85.4% |
681.1 |
25.5% |
68.5 |
ICF II |
Feb 2009 |
Fund of 27 funds with a range of investment strategies; in turn holding positions in 382 companies, differentiated by geography |
51.0 |
14.4 |
71.7% |
281.0 |
18.1% |
46.5 |
ICF III |
April 2014 |
Fund investing in PE funds in core (eg buy out), credit & distressed and emerging markets |
12.5 |
6.5 |
48.2% |
67.0 |
18.7% |
6.9 |
IDeA Opportunity Fund I |
May 2008 |
Acquisition of minority interests |
101.8 |
15.4 |
84.9% |
216.6 |
47.0% |
43.8 |
IDeA EESS |
Aug 2011 |
SMEs in Italy and abroad active in energy saving and efficient use of natural resources |
30.4 |
7.2 |
76.3% |
100.0 |
30.4% |
22.1 |
IDeA Taste of Italy |
Dec 2014 |
SMEs specialising in the agricultural food sector, especially the production and distribution of processed products or related services |
25.2 |
16.5 |
34.4% |
218.1 |
11.6% |
7.2 |
IDeA CCR I |
Jun-16 |
Acquisition of secondary loans and provision of new finance aimed at relaunching distressed but viable SMEs |
15.2 |
14.0 |
7.6% |
262.8 |
5.8% |
0.1 |
Fondo Venere |
Mar 2017* |
Predominantly residential real estate in Northern Italy |
7.0 |
0.0 |
100.0% |
77.0 |
9.1% |
3.6 |
Santa Palombo |
|
Develops social housing in the metropolitan areas of Rome |
1.0 |
0.6 |
40.0% |
82.5 |
1.2% |
0.4 |
6 venture capital funds |
2000 to 2004 |
Various venture capital funds |
39.2 |
4.3 |
88.9% |
1401.7 |
2.8% |
9.6 |
Total |
|
|
456.7 |
104.4 |
|
3,387.7 |
|
208.7 |
Source: DeA Capital
The expected shrinking of the older funds represents a likely acceleration in cash flow to the group, supporting new fund initiatives, share repurchases, and dividends. But as we explain in the next section, it is also a challenge for the private equity management subsidiary DeA Capital Funds.
Alternative asset management
The alternative asset management platform provides a multi-asset platform across private equity, real estate, and non-performing loans (NPLs) comprising:
■
64.3%-owned IDeA FIMIT with real estate AUM of €9.0bn in 41 managed funds (five of which are listed). It is the largest independent real estate manager in Italy with a c 20% market share (source: Assogestioni) and serves institutional and retail clients.
■
Wholly owned IDeA Capital Funds manages €1.9bn of private equity funds in nine funds: four funds of funds, a direct co-investment fund, three theme funds, and one that is in the process of liquidation.
■
68.7%-owned SPC Credit Management, a restructurer and outsourced manager of NPLs with AUM of €0.5bn.
■
45% owned IRE, which provides property management and brokerage services. DeA reduced its investment from 96.3% in FY16 to allow IRE to operate more independently in the market.
We provide a summary of the divisional earnings and our forecasts in Exhibit 8. Given their small starting position we have not yet begun to forecast SPC AUM separately. We also show the divisional profits adjusted to add back the non-cash amortisation (purchase price allocation amortisation or PPA) in relation to the intangible value of customer relationships recognised at the creation of IDeA FIMIT through merger. We use this adjusted profit figure in our valuation.
Exhibit 8: Alternative asset management financial summary
€000s unless otherwise stated |
2014 |
2015 |
2016 |
2017e |
2018e |
AuMs (€bn) – end period |
|
|
|
|
|
IDeA Capital Funds |
1.5 |
1.6 |
1.9 |
1.9 |
1.7 |
IDeA FIMIT |
9.0 |
7.9 |
8.7 |
9.0 |
9.3 |
|
10.5 |
9.5 |
10.6 |
10.9 |
11.0 |
AuMs (€bn) – average |
|
|
|
|
|
IDeA Capital Funds |
1.4 |
1.6 |
1.8 |
1.9 |
1.8 |
IDeA FIMIT |
9.1 |
8.6 |
8.1 |
9.0 |
9.2 |
|
10.5 |
10.2 |
9.9 |
10.9 |
11.0 |
Management fees/AuM bps |
|
|
|
|
|
IDeA Capital Funds |
103 |
107 |
112 |
99 |
110 |
IDeA FIMIT |
59 |
55 |
50 |
46 |
46 |
|
|
|
|
|
|
FIMIT fees |
54,116 |
47,725 |
40,261 |
41,120 |
42,090 |
Cap Funds fees |
14,432 |
16,947 |
20,724 |
18,784 |
19,800 |
Total alternative asset management fees |
68,548 |
64,672 |
60,985 |
59,904 |
61,890 |
Income from equity investments |
(524) |
(359) |
531 |
1,242 |
1,594 |
Other inv income/expense |
663 |
(88) |
1,088 |
(41) |
|
Income from services |
18,357 |
18,549 |
8,336 |
828 |
800 |
Revenue |
87,044 |
82,774 |
70,940 |
61,933 |
64,284 |
Total expenses |
(71,152) |
(120,285) |
(60,245) |
(44,651) |
(45,385) |
Finance income/expense |
155 |
616 |
19 |
|
|
Profit before tax |
16,048 |
(36,895) |
10,714 |
17,282 |
18,899 |
Taxation |
(6,584) |
(409) |
(3,405) |
(5,095) |
(5,699) |
Profit after tax |
9,464 |
(37,304) |
7,309 |
12,188 |
13,201 |
Minority interests |
(172) |
16,631 |
1,178 |
(2,848) |
(3,025) |
Attributable profits |
9,292 |
(20,673) |
8,487 |
9,340 |
10,176 |
Profits adjusted for PPA |
|
|
|
|
|
Attributable profit |
9,292 |
(20,673) |
8,487 |
9,340 |
10,176 |
PPA |
7,523 |
2,871 |
2,422 |
1,308 |
1,000 |
Tax effect at basic rate |
(2,362) |
(901) |
(761) |
(411) |
(314) |
Minority effect |
(1,840) |
(704) |
(593) |
(320) |
(245) |
Adjusted attributable profit |
12,612 |
(19,408) |
9,555 |
9,917 |
10,617 |
Source: DeA Capital, Edison Investment Research
In terms of AUM, IDeA FIMIT has recently begun to grow again after a period of weakness during FY14/15, which included the liquidation of maturing fixed-term funds and a reduction in the property investment weighting of Italian pension funds. The fee margin (46bp of average AUM in Q117) was also negatively affected by market conditions, including increased competition and the introduction of fee caps on some funds to protect AUM, but this has recently shown signs of stabilisation, which management expects will continue. IDeA FIMIT continued to add AUM in Q1, winning a new €0.3bn mandate to manage a fund for a prominent asset in the centre of Milan.
With funds of funds falling out of favour with investors after the global financial crisis, IDeA Capital turned its attention to thematic funds. It has seen a steady increase in AUM over the past three years and added a net c €0.3bn in FY16, similar to the c €263m of gross assets added by the IDeA Corporate Credit Recovery Fund I that launched mid-year. The IDeA Taste of Italy fund also grew further to reach €218m (from €140m at the end of FY15), exceeding management’s target of €200m. The upward trend in revenue margin over the past three years reflects a number of trends. The new thematic funds have higher fee margins than the older funds of funds and are increasing their share of the total, but as the older funds enter a divestment stage their fee margins are under pressure. Meanwhile, 2016 received an exceptional boost from issue related fees related to the closing of the Taste of Italy fund, and is the main driver of the lower revenue margin we forecast for FY17-18.
Over time, revenue margin should continue to benefit as the older funds of funds complete their run-off, but at the same time AUM will reduce. We look for gross maturities of c €200-300m over the next two to three years. Management will seek to offset these maturities with new fund launches and a second credit recovery fund launch is currently being considered, possibly for later in FY17. We have not included this in our forecast at this stage, which is the reason for the FY17-18 decline in AUM.
In 2016, with average AUM and fee revenues below the FY15 level, management fees declined. Despite the non-repeat of issue related fees, we expect FY17 management fee revenues to come close to the FY16 level, supported by higher average AUM. For FY18 we look to a return to growth. The significant decrease in other expenses between FY15 and FY16 mainly reflects the non-repeat of €62.4m in intangible amortisation and impairment charges in FY15. This resulted from a reassessment of the carrying value of these assets on its balance sheet in light of reduced revenue and profit expectations for these businesses. FY16 other expenses were reduced by the mid-year non-consolidation of IRE Advisory, which is now accounted for as an associate following the sale of 55% of the business, but also included €5.0m of additional intangible impairment that was substantially offset by minority interests. The forecast decline in other expenses in FY17 reflects the assumption of no further intangible impairments and allows for the H116 IRE pre-deconsolidation costs to drop out altogether. Management indicates that investment in the new credit platform and the IDeA Corporate Credit Recovery Fund I issue costs had a negative impact on FY16 costs of between €0.5m and €1.0m, but these are unlikely to fall away in the near term.
DeA acquired its stake in SPC Credit Management in Q316. SPC has operated for 15 years as a restructurer and outsourced manager of NPLs and focuses on banking, leasing, consumer and commercial loans, mainly secured ones. The contribution to earnings and AUM is currently small, but management plans to further develop its activities in the broad NPL segment with a view to creating a third leg (in addition to real estate and private equity) to its integrated alternative asset management platform.
Financials
We show a summary of the consolidated financial statements, prepared in accordance with IFRS, in Exhibit 16. The application of accounting principles to DeA’s operations creates a relatively complex picture as we briefly describe below:
■
DeA’s minority interests in private equity investments (both direct investments such as Migros, Sigla and Crescita, and the majority of its fund investments) are categorised as available for sale assets (AFS) and are recorded in the balance sheet at estimated fair value. Changes in fair value are recorded directly in shareholders’ funds through the other comprehensive income line until such time as the investment is sold or impaired, when the gain or loss is posted to the income statement. Migros is carried at a market valuation and the unquoted valuations are estimated by management (see below).
■
DeA’s 46.99% interest in the IDeA OFI Fund is fully consolidated, line by line, in the consolidated financial statements in accordance with IRFS 10 as it is considered that DeA Capital exercises control. Fair value movements on AFS assets held with IDeA OFI appear within the other consolidated income line until sold or impaired.
■
DeA’s interest in the IDeA EESS Fund (30.4%) and the Venere Fund (9.1%) are both included within associates, with DeA’s share of the change in net asset value being recognised directly in the P&L. The other associate is the operating company IRE, of which DeA now owns 45%.
■
The majority owned alternative asset management businesses, IDeA FIMIT, IDeA Capital Funds and SPC, are fully consolidated on a line-by-line basis and their carrying value in the balance sheet is net equity plus goodwill, which is subject to an annual impairment test.
■
The valuations of unquoted investments are estimated by management based on their best judgment and estimation. For the fund investments, the starting point is the fund managers’ valuation reports. In estimating the fair values management considers recent transactions, transactions involving similar instruments and valuation models, although it remains the case that the actual values that can eventually be realised may differ from these estimates. Management has indicated that there is an OTC secondary market for some of its funds, which tends to support the values used in the financial statements.
Focus on asset management earnings and investment NAV
As a consequence of the varying accounting treatments of DeA’s activities, we believe investors should focus their attention on the trends and performance of the alternative asset management division and how this, in combination with changes in the value of the investment portfolio (whatever the accounting treatment), feeds through into overall changes in NAV. The latter is best tracked in the separate NAV breakdown and analysis contained in the results.
We have detailed our forecasts for the alternative asset management division and in the valuation section below we use these forecasts to estimate a divisional fair value as part of an overall sum-of-the-parts valuation framework.
In addition to the alternative asset management profit contribution, our group NAV forecasts also assume a normalised growth in the carried value of all fund investments (AFS, consolidated, and associate). Although this approach does not mirror management’s IRR based approach to investment we believe it is a useful way to model some of the expected returns that may be earned. Our assumption is a 7.5% pa growth in value (fair value gains less impairments) for all funds with the exception of real estate funds (the Venere associate and the IDeA FIMIT AFS funds) where we assume c 4%. These assumed changes in value feed into our NAV forecasts via other comprehensive income in respect of the AFS fund investments, and the associate line of the P&L in respect of the equity accounted Venere and IDeA EESS. For the consolidated IDeA OFI the returns are split fairly equally between net profits consolidated in the P&L account and fair value gains that are reported in other comprehensive income, although for modelling purposes we assume that future returns all pass through other comprehensive income.
We note that the 7.5%/4% return assumptions compare with a five-year average return (fair value movements plus impairments as a percentage of opening value) on all AFS funds (including the IDeA FIMIT funds) of 7.5%. On the same basis we estimate that the return on the consolidated IDeA OFI has been 7.8% over the past two years but that the year average is lower at c 1.0% pa. We make no future return assumptions in relation to the direct investments with the majority of this still represented by the quoted Migros via Kenan Holdings, the value of which has been volatile over the past five years, driven by Migros share price movements and foreign currency swings. The average fair value movement during the period has been a positive c 14.8% pa.
With cash flow to support share buy-backs and dividends
Additionally, we believe that focus should be given to the development of cash flow and of the holding company net financial position, as this will continue to drive cash returns to shareholders by way of share buy-backs and dividends.
Dividends are currently running at c €30m pa and in Exhibit 4 we show share repurchases that have average c €5m pa over the past four years. In aggregate this is substantially ahead of the c €10m pa of recurring cash earnings that are being generated by the alternative asset management division and is supported by realised gains and net divestment from the investment portfolio, which we expect to continue through FY18. Management expects net divestment from maturing private equity funds to accelerate and, subject to market conditions, looks for a potential c €130-150m over the next three to four years. This would be a significant sum available for reinvestment in further new fund launches, co-investments or distribution to shareholders, even after meeting outstanding investment commitments.
DeA had c €108m of undrawn commitments to PE and real estate funds as at the end of FY16 and made new commitments during the year of c €32m (Exhibit 9). In terms of cash flow, capital calls from the funds are spread over a number of years and to a greater or lesser degree, depending on the profile of the funds, are covered by fund reimbursements. Calls have been running at c €20m pa (€21.8m in FY16) lower than the level of reimbursements, generating positive cash flow. Comparing the level of outstanding commitments with net consolidated financial resources (adjusted for declared but non-accrued dividend payments) there has been a notable strengthening in the position between 2014 and 2016. Net uncovered commitments (allowing no benefit from future reimbursements) of c €131.2m in 2014 reduced to c €35.9m in 2016; the increase between 2015 and 2016 reflects the part distribution of realisation proceeds from the direct investment divestments.
Exhibit 9: Fund commitment summary
€m |
2014 |
2015 |
2016 |
2017e |
2018e |
Fund commitments brought forward |
104.8 |
106.5 |
92.6 |
107.7 |
87.7 |
New commitments |
21.1 |
5.8 |
32.3 |
N/A |
N/A |
Capital calls |
(18.6) |
(20.0) |
(16.5) |
(20.0) |
(20.0) |
Exchange differences & other |
(0.8) |
0.3 |
(0.7) |
0 |
0 |
Undrawn commitments carried forward |
106.5 |
92.6 |
107.7 |
87.7 |
67.7 |
Net consolidated financial position |
57.8 |
133.8 |
103.1 |
85.7 |
90.0 |
Non-accrued dividend |
(82.4) |
(33.5) |
(31.3) |
(31.1) |
(31.1) |
Adjusted net consolidated financial position |
(24.7) |
100.3 |
71.8 |
54.6 |
58.9 |
Outstanding commitments less adjusted net financial position |
131.2 |
(7.7) |
35.9 |
33.1 |
8.8 |
Capital calls |
(18.6) |
(20.0) |
(21.8) |
(20.0) |
(20.0) |
Capital reimbursements from funds |
29.0 |
42.1 |
25.6 |
25.3 |
50.0 |
Net capital reimbursements from funds |
10.4 |
22.1 |
3.8 |
5.3 |
30.0 |
Source: DeA Capital, Edison Investment Research
We have made no assumptions about new fund commitments, although we expect DeA to continue to participate in future fund launches. We assume that capital calls continue to run at c €20m pa (we have increased this from an assumed €15m to reflect new commitments recently made) and for reimbursements from the funds to accelerate due to the maturity of a number of these as discussed above on page 6. As a result, we expect accelerating net capital reimbursement from the funds and, combined with our overall estimates for cash flow (which include operational cash flow and direct investment activity), the net financial position (Exhibit 10) and the inclusion of no new commitments in our workings, Exhibit 9 shows a further decline in net uncovered commitments.
Exhibit 10: Net financial position
€m |
2014 |
2015 |
2016 |
2017e |
2018e |
Cash and bank deposits |
55.6 |
123.5 |
96.4 |
79.7 |
84.6 |
Available-for-sale financial assets |
5.1 |
7.5 |
4.2 |
4.2 |
4.2 |
Financial receivables |
2.7 |
3.5 |
3.7 |
2.5 |
2.5 |
Non-current financial payables |
(5.2) |
0.0 |
0.0 |
0.0 |
0.0 |
Current financial payables |
(0.4) |
(0.7) |
(1.2) |
0.0 |
(1.2) |
Other |
0.0 |
0.0 |
0.0 |
-1.2 |
0.0 |
Consolidated net financial position |
57.8 |
133.8 |
103.1 |
85.2 |
90.0 |
o/w Alternative Asset Management |
16.1 |
40.4 |
23.3 |
N/A |
N/A |
o/w Private Equity |
1.1 |
3.4 |
0.1 |
N/A |
N/A |
o/w Holding Company |
40.6 |
90.0 |
79.7 |
N/A |
N/A |
Source: DeA Capital, Edison Investment Research
We show the recent trend in the group net financial position in Exhibit 10, which includes the recent direct investment of c €8m in Crescita and c €18m proceeds from the Kenan/Migros option exercise. Cash distributions are supported by the holding company net financial position rather than at the consolidated level. This adjusts for consolidated cash balances that form part of the group subsidiaries and although we do not specifically forecast this balance, we would expect it to broadly follow the trend in the consolidated cash balance. We expect a slight dip during the current year but for a healthy balance of c €90m being maintained despite forecasting ongoing dividend payments at an unchanged level. We do not forecast share repurchases although they are to be expected.
Although not included in our forecast net financial position, we note the possibility of a sale of the direct investment in Sigla (Q117 fair value of €11.5m), which is carried as a “held for sale” asset. The sale process commenced in late 2015 and continues, although we believe no conclusion is imminent. The decision of DeA’s partner Kenan to dispose of 9.75% of Migros by exercising its option may in our view indicate the direction of travel with respect to the remaining 30.5% stake in Migros, with DeA’s share currently valued in excess of €50m, although we have not included any further divestment in our forecasts. Nor do we include any new direct investments, although the Crescita investment indicates a renewed openness to direct investment on the part of management.
Minimal changes in estimates
We have updated our estimates to reflect the Q117 results and also the Kenan/Migros option exercise. There is a slight reduction in forecast fees from alternative asset management (offset divisionally by lower costs) and a slight increase in NAV per share, which stems from progress year to date in the investment portfolio.
Exhibit 11: Estimate changes
Average AUM (€bn) |
Fees from AAM (€m) |
NAV/share (€) |
Dividend (€) |
|||||||||
Old |
New |
% chg. |
Old |
New |
% chg. |
Old |
New |
% chg. |
Old |
New |
% chg. |
|
2017e |
10.8 |
10.9 |
1.0 |
60.6 |
59.9 |
-1.1 |
1.98 |
2.01 |
1.6 |
0.12 |
0.12 |
0.0 |
2018e |
11.0 |
11.0 |
0.0 |
62.8 |
61.9 |
-1.5 |
1.94 |
1.96 |
1.0 |
0.12 |
0.12 |
0.0 |
Source: Edison Investment Research
Valuation
To capture both the net asset value of DeA’s investment portfolio and a fair trading value for the alternative asset management activities, we use a sum-of-the-parts (SOP) approach to value DeA. This is very similar in structure to the company’s own NAV analysis shown in Exhibit 6, but also makes mark-to-market value adjustment to the investment in the quoted Migros as well as replacing the book value of the asset management activities with a P/E-derived valuation based on the adjusted alternative asset management divisional earnings. We present the data on a pro forma basis, adjusting the Q117 balance sheet for the recent exercise of Migros options.
Our updated SOP value of €1.88 per share allows for the Q2 payment of the FY16 dividend (€0.12 per share) and therefore reduces from the previous €1.97 per share. It continues to provide support for the published NAV, which at the end of Q117 was €2.08 (cum dividend) or €1.96 (ex-dividend). The Migros share price has continued to increase since the end of Q117 and we have valued the remaining Migros stake, owned through the Kenan participation, using a share price of TRY26.2 and an exchange rate of €0.25/TRY (as at 8 June 2017). DeA’s share of the value of this 30.5% stake in Migros is €54.3m, to which we add the €4.4m of proceeds that will be held in escrow by Kenan until up to 2020. The current Crescita market valuation is little changed from Q117.
Exhibit 12: Sum-of-the-parts valuation
€m except where stated |
Value (€m) |
Comment |
Kenan 17.11% (€4.4m option proceeds in escrow) |
4.4 |
As per company announcement |
Kenan 17.11% (Migros 30.5% of share capital, plus €4.4m in escrow) |
54.3 |
Share price (2 June 2017) |
Crescita |
8.1 |
From Q117 report – market value |
Sigla and other direct investments |
11.7 |
From Q117 report – FV/net equity |
Private equity/real estate funds |
208.7 |
From Q117 report – FV/net equity |
Direct and fund investments |
287.2 |
|
Alternative asset management |
143.6 |
14.5x FY17 earnings |
Other assets |
1.5 |
From Q117 report |
Net financial positions |
52.6 |
Q117 adjusted for Migros option proceeds/dividend |
Group total |
516.2 |
|
Shares outstanding (m) |
259.2 |
|
Sum-of-the-parts per share (€) |
1.88 |
Source: DeA Capital, Edison Investment Research
Our valuation of the alternative asset management business is based on the application of what we believe to be a suitable earnings multiple to forecast net income after minority interests. To establish a suitable multiple, we consider the consensus P/E multiples for a number of private equity, specialist and conventional asset managers in Europe and North America. The range of consensus multiples for private equity managers continues to be very wide, which most likely includes distortions from performance fees and one-off effects. The average multiples across all categories has moved up since we last published in March 2017 and is now 14.5x current year earnings (was 13.6x) and 13.5x next year earnings (was 13.0x). We are using a multiple of 14.5x current year adjusted earnings in our fair value, similar to the all categories average, and up from 14.3x when we last wrote. This results in a value of €143.6m, which remains below the balance sheet net asset value (Q117: €169.4m). The balance sheet value is now equivalent to 17.1x FY17 earnings, which would position DeA’s alternative asset management business within the range of valuations for private equity managers and towards the top of the range of specialist managers.
Exhibit 13: Asset manager average consensus earnings and book multiples by category
Averages |
Market cap (US$m) |
Current year P/E (x) |
Next year P/E |
P/BV |
Dividend yield (%) |
Private equity |
17,039 |
16.6 |
15.3 |
5.6 |
3.5 |
Specialist |
5,844 |
12.6 |
11.6 |
3.9 |
5.0 |
Conventional |
5,677 |
14.4 |
13.6 |
2.8 |
3.7 |
All |
10,086 |
14.5 |
13.5 |
3.9 |
4.0 |
Source: Bloomberg, Edison Investment Research. Data as at 2 June 2017.
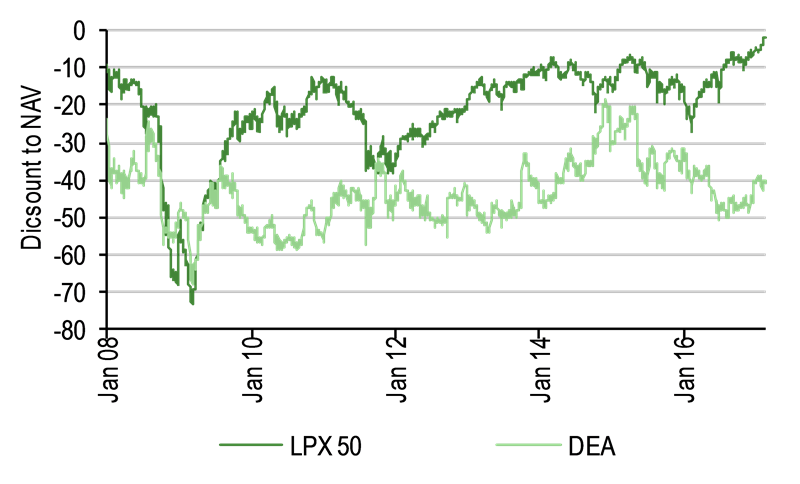
DeA’s share price reached a high of €1.59 earlier in 2017, but has since pulled back, trimming its 12-month price appreciation to c 5% (€1.18 to €1.24) as of 9 June 2017, to which €0.12 per share in dividends paid may be added. The discount to the Q117 (ex-dividend) NAV of 37% continues to be above that of the broader private equity fund sector, as represented by the LPX50 index of 50 leading listed private equity funds (see Exhibits 14 and 15), and as such the recent pull-back in the share price may provide an attractive entry point.
We note DeA’s ongoing share repurchase programme aimed at managing this discount. More fundamentally, the renewed momentum and longer-term growth potential of the alternative asset management business, and the likely future net distributions from the relatively diverse and mature investments in private equity funds, are both supportive of continued value generation as well as distributions to shareholders. Trading in DeA shares has also shown a positive increase in recent months. Having averaged c 160,000 shares per day through 2016, trading volume has increased year to date to c 600,000 (source: Bloomberg, 8 June 2017).
|
Exhibit 14: DeA and LPX50 discounts to NAV (10-year) |
Exhibit 15: DeA and LPX50 discounts to NAV (3-year) |
|
|
|
Source: Bloomberg, Edison Investment Research |
|
Exhibit 14: DeA and LPX50 discounts to NAV (10-year) |
|
|
Source: Bloomberg, Edison Investment Research |
|
Exhibit 15: DeA and LPX50 discounts to NAV (3-year) |
|
|
Source: Bloomberg, Edison Investment Research |
Sensitivities
DeA’s financial results and prospects are very sensitive to financial market conditions. These affect its ability to realise divestments, raise new funds and find new investment opportunities, and will also influence the valuations of its investments. We note the growing share of alternative asset management within the overall valuation, driven by recurring fee revenues that are less directly linked to market fluctuations.
As noted on page 10, the valuations of the underlying investments in the private equity funds and those direct investments that are in unquoted investments are based on a rigorous but ultimately subjective assessment by management, with inevitable uncertainty about realisable values.
The Migros investment, although further reduced since Q117, still represents €0.22 of NAV or c 12% of our estimated fair value. Although quoted, we note the considerable volatility that the Turkish equity market and Turkish lire are subject to.
Any disruption to markets as witnessed during the global financial crisis could be expected to slow the pace at which the PE funds are able to realise investments and make reimbursements of capital, and could have a noticeable impact on the net balance of capital calls and reimbursements with a negative impact on group cash flow.
Exhibit 16: Financial summary
€000s |
2014 |
2015 |
2016e |
2017e |
2018e |
||
December |
IFRS |
IFRS |
IFRS |
IFRS |
IFRS |
||
PROFIT & LOSS |
|
|
|||||
Alternative Asset Management fees |
|
|
66,045 |
62,416 |
59,114 |
57,941 |
59,900 |
Income (loss) from equity investments |
|
|
(786) |
(539) |
524 |
7,689 |
3,459 |
Other investment income/expense |
|
|
(56,149) |
72,464 |
12,338 |
5,849 |
0 |
Income from services |
|
|
19,176 |
21,700 |
8,509 |
921 |
800 |
Other income |
|
|
|||||
Revenue |
|
|
28,286 |
156,041 |
80,485 |
72,400 |
64,159 |
Expenses |
|
|
(87,957) |
(128,514) |
(66,888) |
(51,278) |
(52,185) |
Net Interest |
|
|
2,905 |
4,982 |
(1,220) |
193 |
0 |
Profit Before Tax (norm) |
|
|
(56,766) |
32,509 |
12,377 |
21,315 |
11,974 |
Tax |
|
|
1,720 |
6,452 |
(199) |
(2,964) |
(3,339) |
Profit After Tax (norm) |
|
|
(55,046) |
38,961 |
12,178 |
18,351 |
8,635 |
Profit from discontinued operations |
|
|
(887) |
286 |
0 |
0 |
0 |
Profit after tax (inc. discontinued operations) |
|
|
(55,933) |
39,247 |
12,178 |
18,351 |
8,635 |
Minority interests |
|
|
(1,668) |
1,825 |
39 |
(3,794) |
(3,025) |
Net income (FRS 3) |
|
|
(57,601) |
41,072 |
12,217 |
14,557 |
5,610 |
Profit after tax breakdown |
|
|
|||||
Private equity |
|
|
(60,739) |
78,322 |
7,859 |
10,433 |
(250) |
Alternative asset management |
|
|
9,464 |
(37,304) |
7,309 |
12,257 |
13,298 |
Holdings/Eliminations |
|
|
(4,658) |
(1,771) |
(2,702) |
(4,284) |
(4,414) |
Total |
|
|
(55,933) |
39,247 |
12,466 |
18,405 |
8,635 |
Average Number of Shares Outstanding (m) |
|
|
273.8 |
266.6 |
263.1 |
259.2 |
259.2 |
EPS (FRS 3) (c) |
|
|
(21.0) |
15.4 |
4.6 |
5.6 |
2.2 |
Dividend per share - declared basis (€) |
0.00 |
0.12 |
0.12 |
0.12 |
0.12 |
||
Exceptional capital distribution per share (€) |
0.30 |
0.00 |
0.00 |
0.00 |
0.00 |
||
|
|
||||||
BALANCE SHEET |
|
|
|||||
Fixed Assets |
|
|
786,141 |
558,086 |
559,335 |
569,054 |
557,524 |
Intangible Assets (inc. g'will) |
|
|
229,711 |
167,134 |
156,583 |
154,202 |
151,602 |
Other assets |
|
|
39,988 |
38,590 |
35,244 |
35,898 |
35,898 |
Investments |
|
|
516,442 |
352,362 |
367,508 |
378,954 |
370,024 |
Current Assets |
|
|
117,585 |
173,882 |
141,521 |
131,281 |
135,016 |
Debtors |
|
|
50,711 |
20,694 |
15,167 |
24,306 |
24,306 |
Cash |
|
|
55,583 |
123,468 |
96,438 |
79,709 |
83,444 |
Other |
|
|
11,291 |
29,720 |
29,916 |
27,266 |
27,266 |
Current Liabilities |
|
|
(36,193) |
(31,294) |
(26,979) |
(30,030) |
(30,030) |
Creditors |
|
|
(35,833) |
(30,643) |
(25,757) |
(28,879) |
(28,879) |
Short term borrowings |
|
|
(360) |
(651) |
(1,222) |
(1,151) |
(1,151) |
Long Term Liabilities |
|
|
(40,911) |
(15,514) |
(12,830) |
(12,569) |
(12,569) |
Long term borrowings |
|
|
(5,201) |
0 |
(19) |
(19) |
(19) |
Other long term liabilities |
|
|
(35,710) |
(15,514) |
(12,811) |
(12,550) |
(12,550) |
Net Assets |
|
|
826,622 |
685,160 |
661,047 |
657,737 |
649,941 |
Minorities |
|
|
(173,109) |
(138,172) |
(131,844) |
(136,541) |
(142,663) |
Shareholders' equity |
|
|
653,513 |
546,988 |
529,203 |
521,195 |
507,278 |
Year-end number of shares m |
|
|
271.6 |
263.9 |
261.2 |
259.2 |
259.2 |
NAV per share |
|
|
2.41 |
2.07 |
2.03 |
2.01 |
1.96 |
|
|
||||||
CASH FLOW |
|
|
|||||
Operating Cash Flow |
|
|
188,419 |
188,492 |
19,148 |
16,650 |
34,833 |
Acquisitions/disposals |
|
|
(1,476) |
70 |
(290) |
(17) |
0 |
Financing |
|
|
(157,756) |
(38,148) |
(4,362) |
(2,017) |
0 |
Dividends |
|
|
0 |
(82,432) |
(33,494) |
(31,345) |
(31,099) |
Other |
|
|
|||||
Cash flow |
|
|
29,187 |
67,982 |
(18,998) |
(16,729) |
3,734 |
Other items |
|
|
0 |
(97) |
(8,032) |
0 |
0 |
Opening cash |
|
|
26,396 |
55,583 |
123,468 |
96,438 |
79,709 |
Closing cash |
|
|
55,583 |
123,468 |
96,438 |
79,709 |
83,444 |
Financial debt |
|
|
(5,561) |
(651) |
(1,241) |
(1,170) |
(1,170) |
Closing net (debt)/cash |
|
|
50,022 |
122,817 |
95,197 |
78,539 |
82,274 |
Source: DeA Capital, Edison Investment Research
|
|||||||||||||||||||||||||||||||||||||||
|
||||||||||||||
|
||||||||||||||
Research: Investment Companies
The Merchants Trust (MRCH) aims to generate a high and growing level of income with the potential for long-term capital growth from a relatively concentrated, actively managed portfolio of UK equities. At end-January 2017, the benchmark was changed from the FTSE 100 index to the FTSE All-Share index, reflecting the evolution of the portfolio over several years towards a lower exposure to large-cap equities, giving the manager the opportunity to select from a broader range of dividend-paying companies. MRCH has a competitive yield compared to the UK stock market and also versus its peers. It has a progressive dividend policy and has increased its annual dividend for the last 35 consecutive years.