Last close As at 07/08/2026
—
— 0.00 (0.00%)
Market capitalisation
—
Research: Investment Companies
The Merchants Trust (MRCH) aims to generate a high and growing level of income with the potential for long-term capital growth from a relatively concentrated, actively managed portfolio of UK equities. At end-January 2017, the benchmark was changed from the FTSE 100 index to the FTSE All-Share index, reflecting the evolution of the portfolio over several years towards a lower exposure to large-cap equities, giving the manager the opportunity to select from a broader range of dividend-paying companies. MRCH has a competitive yield compared to the UK stock market and also versus its peers. It has a progressive dividend policy and has increased its annual dividend for the last 35 consecutive years.
The Merchants Trust |
New benchmark, same focus on income/growth |
Investment trusts |
12 June 2017 |
Share price/discount performance
Three-year performance vs index
Gearing
Analysts
|
|||||||||||||||||||||||||||||||||||||||||||||||||||||||||||||||||||||||||||||||||||||||||||||
The Merchants Trust (MRCH) aims to generate a high and growing level of income with the potential for long-term capital growth from a relatively concentrated, actively managed portfolio of UK equities. At end-January 2017, the benchmark was changed from the FTSE 100 index to the FTSE All-Share index, reflecting the evolution of the portfolio over several years towards a lower exposure to large-cap equities, giving the manager the opportunity to select from a broader range of dividend-paying companies. MRCH has a competitive yield compared to the UK stock market and also versus its peers. It has a progressive dividend policy and has increased its annual dividend for the last 35 consecutive years.
12 months |
Share price |
NAV |
Blended benchmark* (%) |
FTSE All-Share (%) |
FTSE 100 |
31/05/13 |
46.7 |
42.4 |
28.4 |
30.1 |
28.4 |
31/05/14 |
12.6 |
9.5 |
7.8 |
8.9 |
7.8 |
31/05/15 |
1.3 |
6.3 |
5.7 |
7.5 |
5.7 |
31/05/16 |
(13.2) |
(12.0) |
(7.2) |
(6.3) |
(7.2) |
31/05/17 |
27.1 |
25.1 |
26.3 |
24.5 |
25.5 |
Source: Thomson Datastream. Note: All % on a total return basis in GBP. *Blended benchmark is FTSE 100 index until 31 January 2017 and FTSE All-Share index thereafter.
Investment strategy: Three pillars to the process
The manager is able to draw on the broad resources of Allianz Global Investors (AllianzGI); he constructs MRCH’s portfolio predominantly on a bottom-up basis based on three elements: fundamentals, valuation and themes. Fundamental analysis focuses on the competitive position of the business and its financial strength; valuation considerations are based on absolute and relative metrics and dividend yield; and themes take into account the macroeconomic environment and the stage of the business cycle, along with industry and secular trends. The portfolio is diversified across industries and typically holds c 40-50 positions in primarily larger-cap UK equities. Selective writing of covered calls is used to enhance income, and gearing of between 10-25% of net assets at the time of drawdown is permitted.
Market outlook: Attractive level of income
Despite a recent period of strong equity returns, UK equities still offer an attractive dividend yield. The outlook for dividend growth is positive as company fundamentals improve, especially in the more cyclical areas where some companies were forced to cut their dividends in an environment of weak commodity prices. For investors seeking exposure to UK equities, a fund focused on a high and growing level of income with the potential for capital growth may be of interest.
Valuation: Discount narrowing over the near term
MRCH’s current 6.4% share price discount to cum income NAV with debt at market value is modestly wider than the 6.2% average discount of the last 12 months. It is also wider than the averages of the last three, five and 10 years (range of 2.2% to 3.7%). The trust has a progressive dividend policy; its annual dividend has grown for 35 consecutive years and over time it has grown at a higher rate than UK inflation. MCRH currently yields 5.1%.
Exhibit 1: Trust at a glance
Investment objective and fund background |
Recent developments |
|||||||||||||||||||||||||||||||||||||||||||||||||||||||||
The Merchants Trust’s investment objective is to provide an above-average level of income and income growth, together with long-term growth of capital through investing mainly in higher-yielding large-cap UK companies. Since 1 February 2017, the benchmark is the FTSE All-Share index. |
■ 27 March 2017: Annual report to 31 January 2017. NAV TR +14.9% versus benchmark TR +21.4%. Share price TR +15.1%. ■ 30 January 2017: Retirement of non-executive director Mike McKeon; the role of senior independent director has been assumed by Sybella Stanley. ■ 18 January 2017: Announcement of a change in the benchmark from FTSE 100 index to FTSE All-Share index. ■ 16 January 2017: Third interim dividend of 6.1p declared. |
|||||||||||||||||||||||||||||||||||||||||||||||||||||||||
Forthcoming |
Capital structure |
Fund details |
||||||||||||||||||||||||||||||||||||||||||||||||||||||||
AGM |
May 2018 |
Ongoing charges |
0.63% |
Group |
Allianz Global Investors |
|||||||||||||||||||||||||||||||||||||||||||||||||||||
Interim results |
September 2017 |
Net gearing |
17.6% |
Manager |
Simon Gergel |
|||||||||||||||||||||||||||||||||||||||||||||||||||||
Year end |
31 January |
Annual mgmt fee |
0.35% |
Address |
199 Bishopsgate, London, |
|||||||||||||||||||||||||||||||||||||||||||||||||||||
Dividend paid |
Quarterly |
Performance fee |
None |
|||||||||||||||||||||||||||||||||||||||||||||||||||||||
Launch date |
February 1889 |
Trust life |
Indefinite |
Phone |
+ 44 (0)800 389 4696 |
|||||||||||||||||||||||||||||||||||||||||||||||||||||
Continuation vote |
None |
Loan facilities |
See page 7 |
Website |
||||||||||||||||||||||||||||||||||||||||||||||||||||||
Dividend policy and history (financial years) |
Share buyback policy and history (financial years) |
|||||||||||||||||||||||||||||||||||||||||||||||||||||||||
Dividends are paid quarterly in August, November, February and May. The annual dividend has increased for 35 consecutive years. |
Renewed annually, the trust has authority to purchase up to 14.99% and allot up to 5% of issued share capital. |
|||||||||||||||||||||||||||||||||||||||||||||||||||||||||
|
|
|||||||||||||||||||||||||||||||||||||||||||||||||||||||||
Shareholder base (as at 30 April 2017) |
Portfolio exposure by sector (excluding cash, as at 30 April 2017) |
|||||||||||||||||||||||||||||||||||||||||||||||||||||||||
|
|
|||||||||||||||||||||||||||||||||||||||||||||||||||||||||
Top 10 holdings (as at 31 May 2017) |
||||||||||||||||||||||||||||||||||||||||||||||||||||||||||
|
||||||||||||||||||||||||||||||||||||||||||||||||||||||||||
Source: The Merchants Trust, Edison Investment Research, Bloomberg, Morningstar. Note: *N/A where not in May 2016 top 10.
Market outlook: Positive backdrop for UK equities
UK equities rallied strongly during 2016 (the FTSE All-Share index had a total return of 16.8%), helped by sterling weakness, which boosted the earnings of companies with unhedged overseas operations. So far in 2017, UK shares have continued their upward move, hitting a series of new highs. Exhibit 2 shows the valuation of UK indices. Despite a rerating in recent months, with the forward P/E multiple of the FTSE 100 index rising by 0.5 points to 15.3x and the FTSE 250 forward earnings multiple rising by 1.2 points to 16.3x, dividend yields of 4.0% for large-cap companies and 3.2% for mid-cap companies remain relatively attractive versus UK government bond yields of c 1.0%. In addition, in aggregate, earnings estimate revisions for UK companies are positive, providing a supportive backdrop.
|
Exhibit 2: Valuation metrics for FTSE 100, 250 and Small Cap indices (as at 1 June 2017) |
|
|
Source: Edison Investment Research, Bloomberg |
Fund profile: Focus on high and growing income
Launched in February 1889, MRCH is one of the oldest LSE-listed investment trusts. It aims to generate a high and growing level of income with the potential for long-term capital growth. Since 2006, MRCH has been managed by Simon Gergel, who is AllianzGI’s chief investment officer for UK equities. He runs a relatively concentrated portfolio of c 40-50 positions. Since end-January 2017, MRCH has been benchmarked against the FTSE All-Share index (previously the FTSE 100 index). No single asset may exceed 15% and the portfolio must be invested across at least five sectors with no one sector above 35%. Gearing of 10-25% of net assets is permitted (at the time of drawdown). MRCH pays one of the highest dividend yields in the AIC UK Equity Income sector and its annual dividend has increased for the last 35 consecutive years. To maintain the record of dividend growth, reserves have been used when necessary.
The fund manager: Simon Gergel
The manager’s view: Still finding investment opportunities
The manager argues that the UK stock market still offers reasonable value despite hitting new highs; he notes that in absolute terms the FTSE 100 index is only c 10% higher than it was at the end of 1999. He suggests that there are a number of companies offering good value and that the yield on the FTSE All-Share index of c 3.75% compares favourably with government bond yields of c 1.0%; however, he does acknowledge that in aggregate, UK equities are not as cheap as they were and there are macro risks such as the Brexit negotiations. Gergel notes that oil companies reported good Q117 earnings results. He says that the major oil companies are starting to generate cash: for example, Royal Dutch Shell, having cut costs in response to a lower oil price, was able to cover its capex and dividends for the first time in several years. The manager has a positive outlook for other select mega-cap companies such BP, GlaxoSmithKline and HSBC. He argues that HSBC has undertaken some interesting transactions, such as the sale of its peripheral assets in Brazil, and a change in the way that its Chinese subsidiary is accounted for has led to an increase in HSBC’s capital base. As a result, analysts have more confidence in the ability of HSBC to pay and grow its dividend.
Asset allocation
Investment process: Bottom-up stock selection
The manager adopts a rigorous bottom-up, high-conviction stock selection process based on three elements: fundamentals, valuation and themes. Fundamental analysis includes an assessment of a company’s competitive position, financials and corporate governance, valuations are considered on both absolute and relative bases and themes take into account the macroeconomic backdrop, the stage of the business cycle and industry/secular trends. Gergel explains that while MRCH invests in an actively managed portfolio of primarily large-cap UK equities, the portfolio does not just offer exposure to the UK economy. The majority of UK companies have overseas operations, so investing in their shares affords exposure to wider geographies, but within the robust UK legal framework and strong corporate governance regime.
Stocks are sold if valuation targets are reached, if the original investment thesis is called into question, or if a better investment opportunity becomes available. Two recent examples were Hostelworld and BT. Hostelworld was purchased at its November 2015 IPO for 185p per share. Having appreciated significantly, the manager considered that its shares were no longer attractively valued; the final part of the position was sold at a share price in excess of 300p. The sale of BT shows the rigour and quick response in MRCH’s investment process; the stock was sold on the day that it announced a profit warning. The manager believes that the original buy thesis of improving cash flow at BT no longer holds true, so the position was sold and the company has subsequently said that it will be lowering guidance for its dividend growth, which the manager sees as a significant event. As well as the UK equity team, the manager is able to draw on the wide resources of AllianzGI, including its GrassrootsTM market research product, which may help him form his investment decisions. A recent report on portfolio holding Inmarsat found that in a survey of 15 maritime distributors or installers of Inmarsat equipment, 14 out of 15 distributors think their relationship with Inmarsat is either satisfactory or very satisfactory.
Current portfolio positioning
As shown in Exhibit 3, MRCH’s portfolio weighting to the largest UK equities represented in the FTSE 100 index has continued to reduce. The manager explains that over the last decade, exposure to the FTSE 100 has declined from c 90% to the current level of c 60%. Within that index, the top 10 companies generate c 60% of the total dividend payments, so with MRCH’s focus on high and growing income, a higher exposure to smaller-cap companies provides wider yield opportunities with less stock-specific risk to MRCH’s potential income.
Exhibit 3: Market capitalisation breakdown (% unless stated)
Index |
Portfolio end-April 2017 |
Portfolio end-April 2016 |
Change (pp) |
FTSE 100 |
59.3 |
66.3 |
(7.0) |
FTSE 250 |
32.1 |
26.8 |
5.3 |
FTSE Smaller Companies |
5.7 |
6.1 |
(0.4) |
Other |
0.8 |
0.0 |
0.8 |
Cash |
2.1 |
0.8 |
1.3 |
100.0 |
100.0 |
Source: The Merchants Trust, Edison Investment Research
MRCH’s portfolio is unconstrained; this is illustrated in Exhibit 4, where sector exposure can differ markedly from the benchmark. The manager continues to have a meaningful underweight exposure (-10.7pp) to the consumer goods sector (an area favoured by many of MRCH’s income peers) as he considers that the majority of these companies are unattractively valued.
Exhibit 4: Portfolio sector exposure vs benchmark (% unless stated)
Portfolio end-April 2017 |
Portfolio end-April 2016 |
Change |
Index |
Active weight |
Trust weight/ index weight (x) |
|
Financials |
27.9 |
24.9 |
3.0 |
26.1 |
1.8 |
1.1 |
Industrials |
15.2 |
13.8 |
1.4 |
11.3 |
3.9 |
1.3 |
Consumer services |
15.0 |
18.2 |
(3.2) |
11.7 |
3.4 |
1.3 |
Oil & gas |
12.5 |
12.3 |
0.2 |
11.5 |
1.0 |
1.1 |
Utilities |
9.0 |
9.9 |
(0.9) |
3.5 |
5.5 |
2.6 |
Healthcare |
7.3 |
7.5 |
(0.2) |
9.1 |
(1.8) |
0.8 |
Consumer goods |
4.9 |
6.7 |
(1.8) |
15.6 |
(10.7) |
0.3 |
Basic materials |
3.5 |
2.8 |
0.7 |
6.8 |
(3.3) |
0.5 |
Telecommunications |
2.6 |
3.1 |
(0.5) |
3.7 |
(1.1) |
0.7 |
Technology |
0.0 |
0.0 |
0.0 |
0.9 |
(0.9) |
0.0 |
Cash |
2.1 |
0.8 |
1.3 |
0.0 |
2.1 |
N/A |
100.0 |
100.0 |
100.0 |
Source: The Merchants Trust, Edison Investment Research
A recent addition to MRCH’s portfolio is Meggitt, a manufacturer of aerospace components that operate in high-stress environments such as high temperature or pressure, where product quality is paramount. A high c 75% of revenues are generated from sole-sourced, life-of-programme contracts, which means these contracts are highly profitable and there is less competition for aftermarket sales. The company has been under pressure as airlines had been sourcing refurbished Meggitt products from other suppliers; however, this has been addressed as Meggitt now offers its own refurbished products, along with new aftermarket supplies. The cyclical outlook for Meggitt is also positive as high original equipment manufacturing demand in recent years should feed through into strong aftermarket sales. Although an accounting change will depress earnings growth in 2017, the manager believes that the long-term outlook for the company is encouraging.
Performance: Outperforming over five years
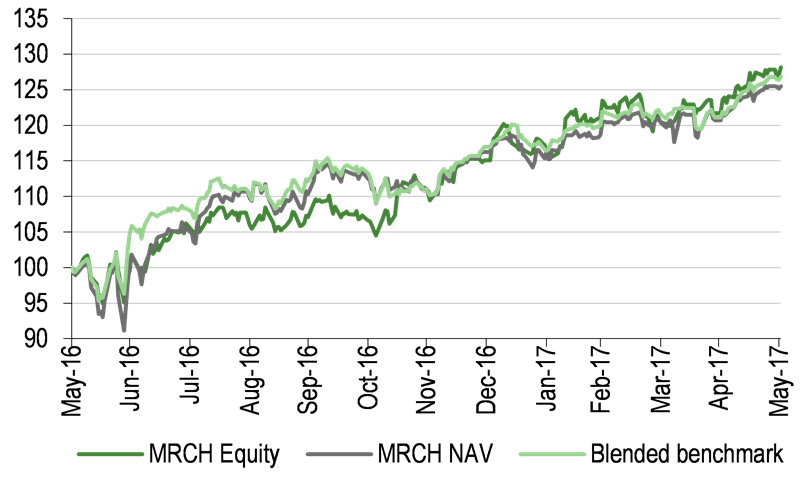
Absolute performance is shown in Exhibit 5. The manager comments that MRCH’s NAV performance has benefited from its relatively high level of gearing in a rising market. So far in FY18, the largest positive stock contributor to performance has been Inmarsat. Having performed poorly in FY17 on concerns about higher price competition, the manager has increased confidence in the company’s growth outlook following recent contract wins.
|
Exhibit 5: Investment trust performance to 31 May 2017 |
||||||||
Price, NAV and benchmark total return performance, one-year rebased |
Price, NAV and benchmark total return performance (%) |
|||||||
|
|
|||||||
|
Source: Thomson Datastream, Edison Investment Research. Note: Three, five and 10-year performance figures annualised. Blended benchmark is FTSE 100 index until 31 January 2017 and FTSE All-Share index thereafter. |
||||||||
|
Exhibit 6: Share price and NAV total return performance, relative to indices (%) |
||||||||
|
One month |
Three months |
Six months |
One year |
Three years |
Five years |
10 years |
|
Price relative to blended benchmark |
0.1 |
(0.3) |
0.6 |
0.6 |
(9.7) |
7.7 |
(4.7) |
|
NAV relative to blended benchmark |
(0.7) |
0.2 |
(1.0) |
(1.0) |
(5.5) |
6.5 |
(8.8) |
|
Price relative to FTSE All-Share |
0.1 |
(0.3) |
0.8 |
2.1 |
(10.8) |
4.0 |
(7.5) |
|
NAV relative to FTSE All-Share |
(0.7) |
0.2 |
(0.8) |
0.5 |
(6.6) |
2.8 |
(11.5) |
|
Price relative to FTSE 100 |
(0.4) |
0.3 |
1.3 |
1.3 |
(9.1) |
8.5 |
(4.1) |
|
NAV relative to FTSE 100 |
(1.2) |
0.8 |
(0.4) |
(0.3) |
(4.9) |
7.2 |
(8.2) |
|
|
Source: Thomson Datastream, Edison Investment Research. Note: Data to end-May 2017. Geometric calculation. |
||||||||
Relative returns are shown in Exhibit 6. MRCH’s NAV total return is ahead of the blended benchmark over five years, while trailing over one, three and 10 years. In share price total return terms, MRCH has outperformed over one and five years, while lagging over three and 10 years.
|
Exhibit 7: NAV total return performance relative to blended benchmark over five years |
|
|
Source: Thomson Datastream, Edison Investment Research |
Discount: Narrower since Q416
MRCH’s current 6.4% share price discount to cum-income NAV with debt at market value is modestly wider than the 6.2% average discount of the last year (range of 2.2% to 10.9%), and wider than the averages of the last three, five and 10 years of 3.7%, 2.8% and 2.2%, respectively.
|
Exhibit 8: Three-year discount to NAV (debt at par or book value) |
Exhibit 9: Three-year cum-income discount (debt at fair or market value) |
|
|
|
Source: Thomson Datastream, Edison Investment Research |
|
Exhibit 8: Three-year discount to NAV (debt at par or book value) |
|
|
Source: Thomson Datastream, Edison Investment Research |
|
Exhibit 9: Three-year cum-income discount (debt at fair or market value) |
|
|
Source: Thomson Datastream, Edison Investment Research |
With interest rates at low levels versus history, the market value of MRCH’s debt is higher than its par value (therefore the value of the NAV with debt at par value is higher than the value of the NAV with debt at market value). Hence, the share price discount to NAV with debt at market value is lower than the discount to NAV with debt at par value.
Capital structure and fees
MRCH is a conventional investment trust with one class of share; there are currently 108.7m ordinary shares in issue. It has long-term debt of £108.6m, the majority of which was negotiated when interest rates were considerably higher than they are today. Its main commitments are a £34m 11.125% debenture maturing in January 2018, a £42m 9.25% bond maturing in 2023 and a £30m 5.875% bond maturing in 2029. The board is actively pursuing replacement options for the £34m debenture expiring in January 2018. If it was refinanced at the current level of interest rates, the manager suggests that it would add more than 3% to MRCH’s earnings, which would be positive for dividend cover. In recent years, MRCH’s NAV and share price total returns have been affected by its high-cost debt. As interest rates have come down, the value of its debt has increased, which has offset the benefit of the pull to par as some of its debt nears maturity.
In FY17, the annual management fee was 0.35%; it is charged to the capital and revenue accounts in a ratio of 65:35 respectively, which reflects the board’s expected split of capital and income returns. The ongoing charge in FY17 was 0.63%, which was a 5bp increase versus the prior year, but is still favourable when compared to the peer group average (AIC UK Equity Income sector, see Exhibit 11).
Dividend policy and record
Dividends are paid quarterly in August, November, February and May. MRCH aims to generate a high and growing level of income. MRCH’s annual dividend has grown for 35 consecutive years. The FY17 annual dividend of 24.2p was a 0.8% increase versus the prior year and was broadly covered by revenue. At end-January 2017, revenue reserves of £24.8m were equivalent to 0.94x the FY17 dividend payment.
Exhibit 10 (left-hand side) illustrates that over the last 20 years, MRCH’s dividend yield is consistently higher than the yield offered by large-cap UK equities, and the right-hand chart shows that its dividend growth has been meaningfully higher than UK inflation during the 35-year period of MRCH’s consecutive annual dividend increases.
|
Exhibit 10: MRCH’s dividend yield and growth (%) |
|
Merchants Trust’s dividend yield vs FTSE 100 dividend yield |
Growth of Merchants Trust’s dividend vs UK inflation |
|
|
|
Source: Thomson Datastream, The Merchants Trust, Edison Investment Research |
|
Peer group comparison
MRCH is a member of the AIC UK Equity Income sector, a relatively large peer group comprising 23 trusts. In Exhibit 11 we highlight the largest seven; they all have market caps higher than £500m. MRCH’s NAV total return is above the selected and whole sector averages over one year, ranking ninth out of 23. Over longer time periods, MRCH’s performance still lags the peers, after a difficult period where it had less invested in the defensive consumer staples sector in particular. Its ongoing charge is the fourth lowest in the whole sector and no performance fee is payable. MRCH has one of the highest levels of gearing (of which the majority is high cost – see Capital structure and fees section), which may explain why it has one of the widest discounts in the sector. The trust has an attractive dividend yield of 5.1%, which is the fourth highest out of 23 peers.
Exhibit 11: AIC UK Equity Income peer group (market cap above £500m) at 8 June 2017*
% unless stated |
Market cap £m |
NAV TR |
NAV TR |
NAV TR |
NAV TR |
Discount (ex-par) |
Ongoing charge |
Perf. fee |
Net gearing |
Dividend yield (%) |
The Merchants Trust |
516.2 |
22.4 |
14.6 |
75.3 |
52.5 |
(8.2) |
0.6 |
No |
118 |
5.1 |
City of London |
1,457.9 |
18.6 |
26.9 |
89.1 |
95.9 |
1.0 |
0.4 |
No |
106 |
3.9 |
Edinburgh Investment |
1,478.3 |
18.5 |
39.7 |
109.1 |
117.6 |
(6.0) |
0.6 |
No |
106 |
3.4 |
Finsbury Growth & Income |
1,122.1 |
24.9 |
48.2 |
147.8 |
188.0 |
1.4 |
0.7 |
No |
102 |
1.8 |
Murray Income Trust |
541.4 |
26.9 |
22.2 |
78.4 |
76.0 |
(7.2) |
0.8 |
No |
102 |
4.0 |
Perpetual Income & Growth |
954.5 |
14.1 |
23.4 |
103.4 |
128.7 |
(7.8) |
0.7 |
No |
113 |
3.4 |
Temple Bar |
850.6 |
22.4 |
20.4 |
83.7 |
114.9 |
(5.8) |
0.5 |
No |
99 |
3.2 |
Selected stock average |
988.7 |
21.1 |
27.9 |
98.1 |
110.5 |
(4.7) |
0.6 |
106 |
3.5 |
|
Sector average (23 peers) |
436.3 |
19.5 |
26.8 |
96.6 |
82.2 |
(1.1) |
1.2 |
112 |
3.8 |
|
MRCH rank in sector (out of 23 peers) |
7 |
9 |
21 |
19 |
18 |
18 |
20 |
4 |
4 |
Source: Morningstar, Edison Investment Research. Note: *Performance data to 7 June 2017. TR=total return. Net gearing is total assets less cash and equivalents as a percentage of net assets.
The board
Following the retirement of Mike McKeon on 31 January 2017, there are now five directors on the board of MRCH. All are non-executive and independent of the manager. Chairman Simon Fraser was appointed to the board in August 2009 and assumed his current role in 2010. Sybella Stanley became the senior independent director following McKeon’s retirement; she was appointed in November 2014. The other three board members are: Paul Yates (appointed in March 2011), Mary Ann Sieghart (appointed in November 2014) and Timon Drakesmith (chairman of the audit committee, appointed in November 2016). Board members have varied backgrounds with both investment and corporate commercial experience.
|
|
Research: Industrials
2G Energy is the third largest provider of gas driven CHP (combined heat power) plants in Germany. It has diversified its activities so that it is less exposed to changes in the regulatory environment for renewables and CHP in Germany through expanding export markets and service revenues. Gas powered systems are becoming increasingly important as sources of power when output from solar and wind systems is low. The stock represents a low-risk play on the shift to decentralised, decarbonised modes of power generation.