Last close As at 05/08/2026
—
— 0.00 (0.00%)
Market capitalisation
—
Research: Financials
ICG-Longbow Senior Secured UK Property Debt Investments (LBOW) provides exposure to the UK real estate debt market through investments in senior secured whole loans. Recently, the company has successfully completed its portfolio transition under the revised investment strategy (adopted in 2017). As a result, its current weighted average coupon rate of 7.11% pa (at end-October 2019), together with contractual arrangement and exit fees, should generate sufficient income to cover the targeted dividend payout of 6p per annum (translating into a c 6% dividend yield).
ICG-Longbow SSUP |
Dividend cover restored |
Investment companies |
8 January 2020 |
Share price/discount performance
Three-year performance vs index
Gearing
Analyst
|
|||||||||||||||||||||||||||||||||||||||||||||||||||||||||||||||||||||||||||
ICG-Longbow Senior Secured UK Property Debt Investments (LBOW) provides exposure to the UK real estate debt market through investments in senior secured whole loans. Recently, the company has successfully completed its portfolio transition under the revised investment strategy (adopted in 2017). As a result, its current weighted average coupon rate of 7.11% pa (at end-October 2019), together with contractual arrangement and exit fees, should generate sufficient income to cover the targeted dividend payout of 6p per annum (translating into a c 6% dividend yield).
|
LBOW’s portfolio successfully migrated under the new investment policy |
|
|
Source: Company accounts, Edison Investment Research. Note: Amounts shown based on balance outstanding rather than final commitment. *Zero if amount drawn under LBOW’s credit facility was higher than cash on balance sheet. |
Opportunity in the UK CRE debt market
LBOW’s focus of senior secured whole loans in the UK mid-market space allows it to earn attractive coupon yields at around 7% pa on average, which is in excess of standard senior commercial real estate debt (3–5% pa at present). This is achieved through investments in the range of £10–25m (which it considers niche) with LTV up to 75% at portfolio level and 85% in the case of selected loans (with the share of investments at LTVs in excess of 80% capped at 20% of portfolio). At the same time, LBOW puts strong emphasis on risk mitigation and extensive stress testing of the borrower’s business plan to ensure capital protection and resilience of income.
Why consider investing in ICG-Longbow SSUP?
■
Attractive dividend yield from a senior secured loan portfolio.
■
Loan investments across different regions and real estate subsectors (albeit with limited exposure to retail).
■
Successful redeployment of proceeds from maturating loans translated into a weighted average unexpired loan term above two years.
Valuation: Dividend yield at c 6%
LBOW’s shares are currently trading at a small 2.9% discount to last reported NAV (as at end October 2019). The fund has consistently delivered a 6p dividend per share pa, which currently represents a 6.3% yield.
Exhibit 1: Company at a glance
Investment objective and fund background |
Recent developments |
||||||||||||||||||||||||||||||||||||||||||||||||||||||||||||||||||||||
ICG-Longbow Senior Secured UK Property Debt Investments (LBOW) focuses on investing in a portfolio of UK real estate debt-related instruments, mainly comprising whole loans secured by first ranking fixed charges against commercial property investments. It aims to provide attractive quarterly dividends totalling 6p annually, capital preservation and a degree of capital gains in the long term. LBOW was launched in February 2013 and its investing strategy was revised in March 2017 allowing for higher LTV loan investments. |
■ 16 December 2019: Quarterly update – NAV at end-October 2019 at 98.09p. ■ 13 December 2019: Interim dividend announcement (1.5p per share). ■ 24 September 2019: Committing £6.5m to a fund managed by the real estate developer LBS Properties. ■ 9 September 2019: Entered into a new £24.6m loan commitment to an affiliate of RoyaleLife. |
||||||||||||||||||||||||||||||||||||||||||||||||||||||||||||||||||||||
Forthcoming |
Capital structure |
Fund details |
|||||||||||||||||||||||||||||||||||||||||||||||||||||||||||||||||||||
AGM |
2020 |
Ongoing charges |
0.8% (LTM at end-July 2019) |
Group |
ICG |
||||||||||||||||||||||||||||||||||||||||||||||||||||||||||||||||||
Interim results |
N/A |
Net cash |
2.4% (at end-October 2019) |
Manager |
Intermediate Capital Managers Ltd |
||||||||||||||||||||||||||||||||||||||||||||||||||||||||||||||||||
Year end |
31 January |
Annual mgmt fee |
1.0% NAV |
Address |
42 Wigmore Street, W1U 2RY London |
||||||||||||||||||||||||||||||||||||||||||||||||||||||||||||||||||
Dividend paid |
May, July, October, January |
Performance fee |
None |
||||||||||||||||||||||||||||||||||||||||||||||||||||||||||||||||||||
Launch date |
February 2013 |
Company life |
Indefinite |
Phone |
+44 (0) 20 3201 7500 |
||||||||||||||||||||||||||||||||||||||||||||||||||||||||||||||||||
Continuation vote |
2022 |
Loan facilities |
£25m working capital facility |
Website |
|||||||||||||||||||||||||||||||||||||||||||||||||||||||||||||||||||
Dividend policy and history (financial years) |
Share buyback policy and history (financial years) |
||||||||||||||||||||||||||||||||||||||||||||||||||||||||||||||||||||||
LBOW aims at quarterly dividend payout of 6p pa. The company was able to maintain this rate since it was fully invested in April 2014. The dividend is usually declared in April, June, September and December and paid in the subsequent month. LBOW may also pay special dividends in respect of prepayment fees. |
The company has not executed any buyback programme since launch. A special resolution was passed during the 2019 AGM, granting the board the authority to repurchase up to 18,183,287 ordinary shares over a period of 15 months. |
||||||||||||||||||||||||||||||||||||||||||||||||||||||||||||||||||||||
|
|||||||||||||||||||||||||||||||||||||||||||||||||||||||||||||||||||||||
Shareholder base (as at 8 January 2020) |
Portfolio exposure by segment (as at 31 October 2019) |
||||||||||||||||||||||||||||||||||||||||||||||||||||||||||||||||||||||
|
|
||||||||||||||||||||||||||||||||||||||||||||||||||||||||||||||||||||||
Top holdings |
|||||||||||||||||||||||||||||||||||||||||||||||||||||||||||||||||||||||
|
|||||||||||||||||||||||||||||||||||||||||||||||||||||||||||||||||||||||
Source: ICG-Longbow SSUP, Edison Investment Research, Refinitiv. Note: *Based on two interim dividend payments (1.5p each) made so far. **Includes the Meadows loan, recently reclassified from retail to residential. ***N/A where not in end-October 2018 top 10.
Fund profile
LBOW is an investment fund domiciled in Guernsey that was launched in February 2013 and invests in a diversified portfolio of good-quality, defensive and primarily fixed-rate senior secured UK commercial real estate (CRE) loans. LBOW considers the range of £10–25m for individual loan size as an attractive market niche, as it is out of reach for small private lenders, but also too small for banks and larger debt funds.
LBOW targets quarterly dividend payments of 6p per ordinary share (annualised) earned on the portfolio of senior secured whole loans in the UK mid-market space. Recently, these payments have been partially made of retained earnings and capital rather than based entirely on coupon income, due to a significant share of lower-yielding legacy loans and cash in the portfolio. In 2017, LBOW decided to broaden its CRE debt investment spectrum to improve the income potential of its portfolio and in turn achieve its stated objective. The upper LTV limit at the portfolio level was raised from 65% to 75% and to 85% at individual loan level (although loans with LTV exceeding 80% may not constitute more than 20% of gross asset value). The transformation process has been substantially completed in recent months as all assets held at end-October 2019 have been originated, extended or repriced under the new investment policy. Consequently, LBOW was able to restore full dividend cover. While the higher LTV ceiling under the revised investment policy results in an increased risk profile of the fund, we note that LBOW managed to allocate its dry powder without approaching its upper LTV limit (its investment portfolio as at end-October 2019 has a weighted average LTV of 65.7%).
|
Exhibit 2: LBOW’s positioning in ICG-Longbow’s risk/reward universe |
|
|
Source: ICG-Longbow |
The fund manager: Intermediate Capital Managers
LBOW is managed by Intermediate Capital Managers (ICM), which is part of Intermediate Capital Group, an LSE-listed specialist asset manager with 30 years of experience in private debt, credit and equity and €41.1bn in assets under management (AUM) as at end-September 2019 (invested both on behalf of third-party investors and on its own balance sheet). Intermediate Capital Group’s UK real estate debt investments are managed by ICG-Longbow (ICGL), which was established in 2006 and operates through ICM. ICGL’s team consists of 36 members, including 23 investment professionals and eight members responsible for credit risk management, portfolio monitoring and fund operations. ICGL’s seven investment directors have an average of around 25 years’ experience in direct property, financing or investment management. ICGL has a dedicated senior debt investment team, consisting of four members including two qualified accountants and a chartered surveyor. It is important to note that ICGL’s expertise covers a solid understanding of both the debt markets and the UK property markets. For a detailed track record, please refer to our initiation note on LBOW.
The manager’s view: debt investment more compelling than equity
LBOW’s portfolio transition has now completed with significant new investment activity in H219, and agreements reached to extend the terms of several of its shorter duration loans. The investment manager does not foresee any significant levels of repayments in the near term and, despite a slowdown in property transactions, has actually seen an increase in investment opportunities in Q419. This leaves it able to balance its new lending activities against the availability of capital and its revolving credit facility, which should allow the investment manager to pursue the ‘highest-calibre’ deals from those in its pipeline.
Whilst the short-term direction of the market is expected to be driven by the level of stability in the UK’s political environment, the manager believes that robust occupational market fundamentals remain in most sectors outside of retail and provide a solid base for lending activity. Moreover, the prospect of a period of uncertainty or volatility in transactional markets may lead to attractive opportunities to support loan sponsors focused on implementing business plans and creating value rather than trading assets.
Further, the manager believes that with the latest IPF consensus forecasts for total property returns averaging 3.7% for the next two years, the case for debt investment as a means of securing real estate exposure is compelling given the strong yields available and downside protection from a first mortgage position.
Market outlook: Brexit still looming
When analysing LBOW’s portfolio, it is important to understand the situation in underlying UK property markets, as well as lending conditions for commercial real estate. UK markets continue to exhibit varying performance among the respective property segments, with the broader market affected by the Brexit uncertainty (with the deadline recently extended to January 2020), as well as more muted economic data. This is illustrated by lower transaction volumes, with all UK year-to-date volumes (as of Q319) down 26.5% y-o-y to £33.2bn, according to a recent Market in Minutes report from Savills. There are also minor indications of potential prospective yield softness in high street retail, shopping centres, as well as M25 and provincial offices, according to Savills.
The residential real estate segment reveals clear evidence of delayed Brexit impact, as Savills cut its forecasts for house price growth in 2019 from 1.5% (published in November 2018) to 0.5% according to its December UK Housing Market Update. In September 2019, KPMG expected house prices to remain stable in 2019 and to increase by 1.3% in 2020 in the case of a successful Brexit with a deal signed on 31 October 2019. The decision to push back the deadline means continued uncertainty resulting in lack of buyer confidence. Having said that, the recent UK election results may provide some easing in this respect. A no-deal Brexit would result in price decreases between 5.4% and 7.5% y-o-y across the different UK regions in 2020, according to KPMG. Having said that, it is important to note that a downturn may be less severe compared to previous cycles, given the low interest rate environment and better housing affordability in most UK regions compared to the period before the onset of the 2008/09 crisis.
The UK office market remains robust, with a record low vacancy rate averaging 4.6% across the six largest UK cities (the Big 6) at end of H119 (according to Jones Lang LaSalle, JLL). The rate is particularly low for Grade A offices, assisted by low levels of speculative new supply completed this year and solid letting activity. Total take-up in the Big 6 cities was 4% below H118, but still visibly higher than the 10-year average, according to JLL. This was assisted, among other things, by strong demand for flexible workspace. In the regional cities, Bristol, Cardiff and Edinburgh are characterised by relatively low vacancy rates and a limited supply pipeline, while Birmingham, Manchester and Glasgow see a stronger pipeline and somewhat higher vacancies, according to Cushman & Wakefield. As for the broader market, based on the Investment Property Forum (IPF) UK consensus forecast (autumn 2019 edition), office rental value is expected to grow by 1.5% and 1.0% in 2019 and 2020, respectively. On the other hand, office property prices should remain broadly stable, with consensus suggesting no capital value increase in 2019 and 0.2% growth in 2020.
Industrial/logistics real estate continues to perform well, supported by the ongoing expansion of e-commerce. Current IPF consensus for rental growth is 3.1% and 2.3% in 2019 and 2020, respectively. At the same time, consensus indicates capital value growth of c 1.7–2.1% pa in the coming years. Cushman & Wakefield recently highlighted that although the investment market has softened slightly, prime yields have remained firm.
The retail sector (where LBOW has limited exposure) remains negatively affected by, among other things, continued expansion of e-commerce and employee cost pressures. Consequently, the retail investment market declined by 10% in H119 after falling in 2017 and 2018 (as per JLL data). According to JLL’s recent investor confidence survey, 46% perceive retail as subject to major risk (and do not plan to invest in this segment), while further a 31% see moderate risk and would only consider very selective investments. In this environment, investors are likely to focus on niche sectors, such as pubs, leisure and roadside retail. Moreover, the redevelopment of underperforming retail space should become more prevalent (with LBOW’s Meadows loan a good example in this respect).
Exhibit 3: UK CRE consensus expectations
|
Rental value growth (%) |
Capital value growth (%) |
Total return (%) |
||||||
|
2019 |
2020 |
2021 |
2019 |
2020 |
2021 |
2019 |
2020 |
2021 |
Office |
1.5 |
1.0 |
1.7 |
0.0 |
0.2 |
1.5 |
4.0 |
4.4 |
5.7 |
West End office |
2.1 |
1.2 |
2.2 |
0.5 |
1.1 |
2.0 |
3.9 |
4.6 |
5.6 |
City office |
1.1 |
0.7 |
2.0 |
(0.6) |
0.2 |
2.0 |
3.3 |
4.1 |
6.0 |
Industrial |
3.1 |
2.3 |
2.1 |
2.1 |
1.7 |
1.7 |
6.6 |
6.1 |
6.2 |
Standard Retail |
(3.6) |
(3.1) |
(1.4) |
(9.4) |
(6.8) |
(2.1) |
(5.2) |
(2.3) |
2.7 |
Shopping Centre |
(5.3) |
(4.5) |
(2.3) |
(15.4) |
(10.2) |
(4.5) |
(10.5) |
(4.5) |
1.6 |
Retail Warehouse |
(4.3) |
(3.4) |
(1.2) |
(12.7) |
(7.6) |
(2.0) |
(7.1) |
(1.4) |
4.6 |
All Property |
(0.2) |
(0.2) |
0.7 |
(3.5) |
(2.2) |
0.1 |
0.9 |
2.5 |
4.9 |
Source: Investment Property Forum UK Consensus Forecasts (autumn 2019)
The property lending market remained stable in H119 (even if new lending growth decelerated), as illustrated by the findings of the recent UK CRE Lending report published by Cass Business School. New CRE lending for H119 stood at c £23.4bn, up 4% y-o-y. Interestingly, this coincides with a 22% y-o-y drop in UK investment activity in H119 to £21.5bn (according to JLL). CRE lending margins outside retail for senior loans secured by prime property at low LTV ratios have experienced some pressure on pricing in recent years. Average margins in the broad whole loans space (which is the prime comparative market for LBOW) compressed somewhat at the beginning of 2019, according to the Link Asset Services survey. Still, margins on whole loans originated by debt funds remained above 600bp, translating into a coupon rate of c 7% (broadly in line with LBOW’s new lending opportunities). It is also important to note that credit spreads in the CRE whole loan space are generally deal-specific (ie they vary on a deal-by-deal basis) and LBOW has highlighted that it has not experienced any meaningful narrowing of spreads recently.
Recently, there was an increase in investors looking to deploy capital in the CRE space, translating into greater competition among lenders. However, lenders were more cautious on opportunities with higher market and sectoral risks, as well as value-added lending (showing a preference for long-term core income lending). This tendency may provide higher return opportunities for players such as LBOW.
Asset allocation
Several new investments post quarter-end
In Q219 (ending July 2019), LBOW’s portfolio activity was largely focused on existing loan investments. This included the repayment of two lower-yielding legacy investments, the £22.4m Commercial Regional Space portfolio and £8.0m Ramada Gateshead loan. LBOW also made further advances on the Affinity and Southport loans (£1.9m in total). On top of this, the BMO loan was subject to short-term extension on improved terms (ie higher coupon rate) to October 2019 (with a further extension offered post end Q319).
In Q319, LBOW completed a number of new loan investments. Firstly, the company made a £24.6m commitment to a RoyaleLife affiliate to refinance a residential bungalow portfolio consisting of 10 assets, as well as a £6.5m commitment to a fund managed by LBS Properties to acquire an office property in central London. These loans carry an initial LTV of 78.9% and 69.3%, respectively. LBOW has also refinanced its existing Northlands loan with a new £12.5m commitment (vs £8.5m previously) with a three-year tenure and initial LTV at 55.3% (53.5% previously).
As a result, the group’s investment portfolio at end-October 2019 consisted of 10 loans with an aggregate principal balance of c £118.4m and total capital committed of £128.6m. The weighted average LTV stands at 65.7% (vs 63.0% at end-January 2019), which means that the company successfully deployed its dry powder without approaching the upper LTV limit (75% at portfolio level). The portfolio’s weighted average coupon rate and unexpired loan term improved to 7.11% (vs 6.23% at end-January 2019) and c 2.0 years (vs 1.2 years at end-January 2019), respectively. The net new investments utilised most of LBOW’s net cash, with its gross cash standing at £12.8m and the drawn part of its revolving credit facility at £10.0m at end-October 2019. The remaining credit balance was supposed to be committed to the £15.3m regional credit portfolio loan, which was already in the documentation phase but eventually fell away post Q319 end. However, this has allowed partial repayment of the credit facility (only £1.2m drawn at the date of the last factsheet) and to pursue a £7.8m alternative opportunity in the industrial sector (which is now in solicitors’ hands). Altogether, the c £59m of gross new investment in the current fiscal year carries a projected weighted average IRR of over 9% (based on coupons and arrangement/exit fees), an initial LTV of c 68% and over a three-year average loan term.
We understand that all loan investments remain compliant with their respective covenants. This includes the £9.0m Quattro loan, where the borrower has recently exchanged contracts to sell one of the three properties representing the loan collateral (which was part of its original business plan). According to the investment manager’s internal methodology, the loan’s credit rating deteriorated at end-January 2019 as a result of the lower interest cover ratio following the utilisation of its interest reserve, with the loan being serviced from a pre-funded account (at the same time, the Meadows loan was upgraded following the grant of planning permission). Having said that, the interest on the loan is still being paid and during Q219 (ending July 2019), LBOW recorded a modest increase in value for the largest of the Quattro portfolio properties (which resulted in an LTV decline from 83.7% at end April 2019 to 80.6% at end-October 2019). The borrower has continued to incur certain capital expenditures for this property and secured new planning permission allowing for additional retail use. The sponsor’s plan is to sell and/or refinance the underlying properties. While the investment manager has assessed the probability of default over the remaining term as low, it said that it is closely monitoring the asset for any further deterioration.
Exhibit 4: LBOW’s portfolio summary as at end-October 2019
Project |
Underlying assets |
Sector |
Balance outstanding (£m) |
Total commitment (£m) |
Weighted average maturity |
Current LTV |
BMO |
Portfolio of 17 properties located across the UK, principally in the high street retail and industrial sectors. |
Mixed use |
15.8 |
15.8 |
Oct 19* |
51.5% |
Northlands Portfolio |
Mixed-use portfolio of high street retail and tenanted residential units located predominantly in London and the South East. |
Mixed use |
9.0 |
12.5 |
Oct 22 |
55.3% |
Halcyon Ground Rents |
A portfolio of 21 freehold ground rent investments, of which 72% are industrial with leasehold rents receivable based on 22% to 25% of market rent, with the balance being leisure uses at ground rents of 50%. |
Industrial/ distribution |
5.7 |
5.7 |
Dec 19 |
65.2% |
Carrara Ground Rents |
A single-ground rent investment located in Leeds, subject to a ground rent of 25% of market rent. The property is a modern office building on an established business park accessed from the M1 motorway, which is fully let to a strong covenant. |
Office |
1.3 |
1.3 |
Dec 19 |
65.0% |
Meadows RE Fund II |
A former retail park in north London; the borrower recently secured planning permission for a major residential development on the property securing the loan. |
Residential |
21.5 |
21.5 |
Jul 20 |
60.4% |
Quattro |
Three mixed-use assets in and around the London Borough of Kingston. |
Mixed use |
9.0 |
9.0 |
Jan 21 |
80.6% |
Affinity |
Multi-let office property in Bristol, with committed capital expenditure facility. |
Office |
16.7 |
16.7 |
May 22 |
66.0% |
Southport Hotel |
Hotel and leisure complex in Southport, Merseyside, with a business plan focused on investing and improving the asset, renovating the bedrooms and thereafter driving room rates. |
Hotel |
13.6 |
15.0 |
Apr 23 |
64.7% |
RoyaleLife |
Portfolio of 10 assets in the residential bungalow homes sector spread across the country |
Residential |
20.9 |
24.6 |
Oct 22 |
80.0% |
LBS Properties |
Office property in Farringdon, London |
Office |
5.0 |
6.5 |
Oct 23 |
69.3% |
Total |
118.4 |
119.6 |
65.7% |
Source: LBOW, Edison Investment Research. Note: *The BMO loan reached maturity at the end of the period, and the company has offered to extend the loan.
While executing the portfolio transition, the intension of LBOW’s investment manager was to avoid a maturity cliff similar to the one the company faced this year. As illustrated in Exhibit 5, the manager largely succeeded in this respect, with the maturity profile of LBOW’s current portfolio being more balanced now.
|
Exhibit 5: Maturity profile of LBOW's investments* (£m) |
|
|
Source: Company accounts, Edison Investment Research. Note: *Includes the BMO, Halcyon and Carrara loans, which however were recently subject to short-term extensions (concluded post October 2019) |
New deals to be funded with loan repayments and fresh equity
While LBOW still has a relatively full deal pipeline, further investments will be dependent on scheduled loan repayments and proceeds from potential equity issuance, which may also be used to repay the OakNorth credit facility (which is normally deployed for short-term liquidity rather than to permanently gear up the portfolio).
|
Exhibit 6: LBOW's recent portfolio changes and pipeline |
|
|
Source: LBOW, Edison Investment Research |
Post quarter end, LBOW has agreed short-term loan extensions of the £21.5m Meadows loan (following an improved risk profile resulting from revaluation and reclassification to the residential segment), as well as the Halcyon and Carrara ground rents (representing an aggregate investment of £7.0m). The company is also discussing a new investment to replace the £15.8m BMO Partners loan. In this context, we note that management still has permission from the AGM to allot and issue equity securities up to 9.99% of the total share count (on a fully diluted basis), which was granted in July 2019 for a period of 15 months.
Performance: Yet to reflect finalised portfolio transition
Even though LBOW does not follow any particular benchmark, we compare its returns with a broader European debt index (S&P European Leveraged Loan) for reference. A fund return analysis over the past five years shows that LBOW slightly outperformed the selected index, as it recorded a 6.1% annualised total NAV return at end October 2019 against 5.7% returned by the index. Interestingly, LBOW’s share price performance was slightly behind the benchmark at 4.6% pa. LBOW’s short-term returns reflect the realization of its portfolio transition process as both three-year and 12-month annualised NAV total returns at end October 2019 fell short of the five-year results, equalling 4.8% and 4.6% pa respectively. Moreover, both figures are below LBOW’s dividend yield of c 6%, which confirms that coupon income from loan investments was insufficient to cover LBOW’s dividend payments over that period. Having said that, full dividend cover has recently been restored following the completion of portfolio transition and new deals, which should support LBOW’s NAV total return going forward.
|
Exhibit 7: Investment company performance to 31 October 2019 |
|
Price, NAV and index total return performance, one-year rebased |
Price, NAV and index total return performance (%) |
|
|
|
Source: Refinitiv, Edison Investment Research. Note: Three- and five-year performance figures annualised. |
|
Discount: Trading at slight discount to NAV
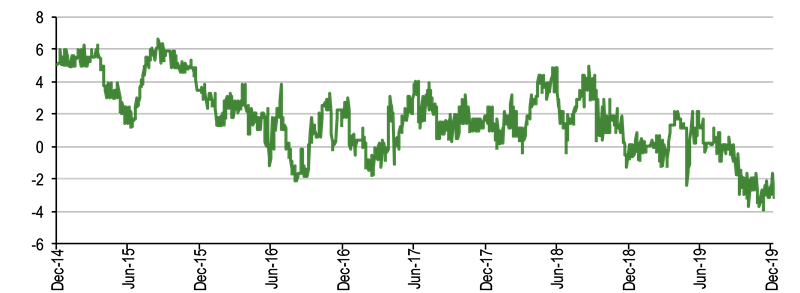
In the initial years since its launch, LBOW’s shares traded at a c 2–6% premium to NAV, which started to diminish amid reduced coupon rates achieved on the portfolio and shareholder discussions around the revision of its investment policy back in 2016/17. As the portfolio transformation continued, LBOW’s shares traded close to NAV. At present, they are trading at a minor 2.9% discount.
|
Exhibit 8: Share price premium/discount to NAV (including income) over five years (%) |
|
|
Source: Refinitiv, Edison Investment Research |
Capital structure and fees
LBOW is charged a management fee by ICM amounting to 1.0% of NAV pa. Additionally, expenses incurred while carrying out portfolio management activities, directly related to LBOW’s business, are reimbursed to the investment manager. These cover legal, accounting, consultancy and other professional fees and expenses. Historically, total ongoing charges, excluding investment advisory fees, stood at c 0.5–0.6% of NAV, but almost doubled in 2017 and 2019 to c 1.0% pa. However, this was predominantly due to non-recurring expenses related to placing programmes and EGMs. We estimate that ongoing charges ratio calculated on a last 12 months (LTM) basis to end July 2019 stood at a more normalised level of c 0.8%. Consequently, the ongoing charges ratio (including management fee) should stand at around 1.75–1.80% pa going forward.
The current investment policy allows for a maximum leverage level of 20% of NAV, used to minimise the return-dilutive effects of uninvested cash without meaningfully increasing LBOW’s risk profile. The fund has some degree of flexibility with respect to the timing of new loan investments and reinvesting proceeds from maturing loans, thanks to the £25m working capital facility with OakNorth Bank (which bears a variable interest rate of three-month Libor + 3.95%), of which £10m was drawn at end-October 2019 (which was subsequently mostly repaid, with the outstanding balance at £1.2m as at the release date of the last factsheet).
Dividend policy and record
LBOW pays dividends to ordinary shareholders on a quarterly basis, usually declaring them in April, June, September and December, with payments being made in the following month. The company has been able to meet the targeted quarterly payments of 1.5p per share since H214, ie approximately since being fully invested. Recently, these payments required utilisation of retained earnings and later LBOW’s capital due to insufficient cover from its loan investment portfolio. However, the investment manager successfully transitioned LBOW’s portfolio by using proceeds from legacy loans to reinvest them in new higher-yielding investments. The process was largely concluded in September 2019, which is within the timeline of three quarters set by LBOW’s management in January.
For the purpose of analysing LBOW’s dividend cover, we assume that (similar to previous periods) its NAV per share should remain broadly stable at c 100p, with the majority of excess profits from arrangement and prepayment/exit fees paid out in special dividends. Together with a constant dividend payout of 6p per share, this would imply a c 6.0% yield. LBOW is charged an advisory fee of 1% of NAV pa, while other ongoing charges should represent around 0.75–0.80% of NAV pa. Comparing LBOW’s NAV at end July 2019 of £119.4m with its total ongoing charges (including advisory fee) over the previous 12 months, we arrive at an expense ratio of 1.79%, which is in line with the above assumptions. This implies that the weighted average IRR to secure full dividend cover stands at c 7.8% pa, which is above the weighted average coupon rate across LBOW’s portfolio at end October 2019 of 7.11% pa. However, LBOW’s investments are subject to significant contractual arrangement and exit fees, which normally stand at 0.5–1.0% per year each. Consequently, as per LBOW’s calculations, the new investments concluded in the current year carry a projected weighted average IRR of 9.4%, which should allow LBOW to fully cover its prospective dividend payments.
Peer group comparison
LBOW operates in the AIC Property – Debt sector, which contains funds focused on commercial and/or residential real estate debt investments in the UK and continental Europe, such as TOC Property Backed Lending, Real Estate Credit Investments and Starwood European Real Estate Finance. To further expand the peer group (Exhibit 10), we have included two funds investing in the broader space of asset-backed loans (Hadrian’s Wall Secured Investments and RM Secured Direct Lending), as well as GCP Asset Backed Income Fund, which invests predominantly in UK-based fixed and floating rate loans secured against cash flows and/or physical assets. Finally, we have added UK Mortgages, which invests in a diversified portfolio of UK residential mortgages. Exhibit 9 presents a comparison of the relevant peers vs LBOW in terms of their investment policies.
Exhibit 9: Comparison of LBOW’s investment policy vs peers
Company |
Investment universe |
Last reported LTV at portfolio level |
LTV range |
Property type |
Typical term |
Return target pa |
Holding company leverage |
ICG-Longbow SSUP |
Predominantly fixed-rate senior secured UK real estate loans |
59.4% |
Up to 85% at loan level, up to 75% at portfolio level |
Commercial, primarily regional |
3–5 years |
6p dividend pa and some capital gains |
Up to 20% of NAV |
TOC Property Backed Lending |
Fixed rate loans secured by first or second charge over UK property. Typical transaction includes a 25.1% free equity stake |
87.9% |
40-100% |
Residential, commercial, sale and leaseback, Primarily regional (target share at 75%) |
1–3 years |
8-9% NAV total return, 7% target yield |
Max 30% of NAV |
Starwood European Real Estate Finance |
Senior loans, subordinated and mezzanine loans, bridge loans, selected loan-to-loan financings and other debt instruments in UK and wider EU markets |
63.2% |
Up to 85% at loan level, up to 75% at portfolio level; typically, 60-80% |
Commercial |
3–7 years |
N/A. Invested loan portfolio unlevered annualised total return at 7.2% as at end-September 2019 |
Up to 30% of NAV, with long-term borrowings limited to 20% of NAV |
Real Estate Credit Investments (RECI) |
Secured debt; listed debt securities and securitised tranches of real estate related debt securities; other direct or indirect opportunities, incl. equity participations in real estate |
66.6% |
Up to 85% for secured debt |
Commercial and residential in UK and Western Europe |
0.5–15 years |
N/A |
Up to 40% of NAV |
UK Mortgages |
UK residential mortgages |
c 66% |
N/A |
Residential |
N/A |
7-10% net total return |
None |
Source: Company filings, Edison Investment Research. Note: *Edison estimate based on company factsheet.
Performance comparison against peers, presented in Exhibit 10 below, is based on one-, three- and five-year results. In all analysed investment horizons, LBOW’s total return was slightly below the peer group average and reached 4.6%, 15.1% and 34.7% respectively. However, it must be noted that there are several peers for which either three- or five-year performance numbers are not available. Moreover, it is worth keeping in mind that while LBOW’s current portfolio is exclusively composed of senior secured loans with no exposure to mezzanine loans, both Starwood and RECI have significant exposure to higher-risk mezzanine investments, which for the former stood at 38.6% of the total portfolio at end-June 2019, while they made up c 34% of the latter’s top 10 investments at end-June 2019 (according to our estimates). Moreover, six of RECI’s top 10 investments are development projects, which also bear a higher risk. LBOW’s ongoing charges ratio (including management fee), calculated on a last 12-month basis, was broadly in line with the peer average at 1.8% pa. Importantly, this figure is already free of non-recurring charges related to publication of the circular and prospectus in conjunction with LBOW’s placement programme incurred previously. In line with most of its peers, LBOW does not charge a performance fee. Its shares now offer a dividend yield of c 6.3% vs the peer average of 7.1%.
Exhibit 10: Selected peer group as at 8 January 2020
% unless stated |
Market cap £m |
NAV TR |
NAV TR |
NAV TR |
Discount (ex-par) |
Ongoing charge (%)* |
Perf. fee |
Net gearing |
Dividend yield (%) |
ICG-Longbow SSUP |
115.5 |
4.6 |
15.1 |
34.7 |
(2.9) |
1.8 |
No |
108 |
6.3 |
GCP Asset Backed Income |
479.1 |
11.1 |
24.1 |
N/A |
6.0 |
1.4 |
No |
100 |
5.9 |
Hadrian's Wall Secured Investments |
84.7 |
4.7 |
15.6 |
N/A |
(26.7) |
1.9 |
No |
100 |
10.2 |
Real Estate Credit Investments |
356.0 |
8.5 |
27.7 |
51.1 |
1.7 |
1.7 |
Yes |
110 |
7.1 |
RM Secured Direct Lending |
121.6 |
7.3 |
N/A |
N/A |
1.1 |
2.2 |
No |
100 |
5.0 |
Starwood European Real Estate Finance |
433.9 |
10.3 |
22.8 |
46.3 |
2.6 |
1.1 |
Yes |
100 |
6.2 |
TOC Property Backed Lending |
27.9 |
4.3 |
N/A |
N/A |
11.8 |
2.2 |
No |
107 |
5.8 |
UK Mortgages |
192.5 |
5.1 |
7.3 |
N/A |
(12.3) |
1.5 |
No |
100 |
5.3 |
Average |
242.2 |
7.3 |
19.5 |
48.7 |
(2.3) |
1.7 |
- |
102.4 |
6.5 |
Trust rank in sector |
6 |
7 |
5 |
3 |
6 |
4 |
- |
2 |
3 |
Source: Morningstar, Edison Investment Research. Note: TR = total return. NAV TR performance as at end-October 2019. Net gearing is total assets less cash and equivalents as a percentage of net assets. Note: *Includes management fee but excludes performance fee.
The board
LBOW’s board of directors includes five non-executive members (including the chairman), who are all independent of the company’s investment adviser. Jack Perry, CBE (chairman) is a portfolio non-executive director, being also chairman of European Assets Trust (an equity fund investing in small- and mid-cap public companies in Europe ex-UK) and a non-executive director of Witan Investment Trust (a global equity fund using an active multi-manager approach). Stuart Beevor is a chartered surveyor and an independent consultant with over 30 years of experience. Currently, he serves as a senior independent director of Metropolitan Housing Trust (one of the UK’s leading providers of affordable housing, as well as care and support services) and a non-executive director of Empiric Student Property (an internally managed UK REIT providing and operating direct-let, nominated or leased student accommodation). Patrick Firth is a non-executive director of several investment funds and management companies, such as Riverstone Energy (a closed-end energy investment company) and JZ Capital Partners (investing in US and EU micro-cap companies and US real estate). Paul Meader acts as an independent director of investment companies, insurers and investment funds with over 30 years of experience in financial markets, holding senior positions in portfolio management and trading. Mark Huntley gained more than 40 years of experience in the fund and fiduciary sector, holding several positions in listed and private funds and property advisory boards. He has been actively involved in real estate investment in the UK and internationally, and has experience in private and listed debt structures.
|
|
Research: TMT
Ebiquity has announced that it has acquired Digital Decisions, strengthening its capabilities in digital media monitoring and consultancy. Digital Decisions is a comparative newcomer, trading for less than three years, during which it has built an impressive client roster. It is headed up (and majority owned) by Ruben Schreurs, who will be staying with the combined group and leading the expansion drive into the US. The initial consideration is €0.7m in cash, with further payments subject to performance criteria through to FY22. Bringing useful additional technical capability, this looks to be a sensible, complementary purchase.