Last close As at 11/08/2026
EUR37.34
▲ 1.84 (5.18%)
Market capitalisation
EUR2,936m
Research: Industrials
Theon International commands a unique position in military night vision systems as a market-leading business focused on man-portable systems (goggles). It has a market-leading position in Europe, an expanding presence globally and is developing adjacent product portfolios, most notably platforms like military vehicle vision systems. Its potential is supported by an addressable market of more than €3bn forecast to grow at double-digit rates. Combining this with a low capital-intensity business model should drive positive financials and strong cash generation.
Theon International |
Clear vision for growth |
Initiation of coverage |
Aerospace and defence |
25 November 2024 |
Share price performance
Business description
Next events
Analyst
Theon International is a research client of Edison Investment Research Limited |
||||||||||||||||||||||||||||||||||||||||||||||||
Theon International commands a unique position in military night vision systems as a market-leading business focused on man-portable systems (goggles). It has a market-leading position in Europe, an expanding presence globally and is developing adjacent product portfolios, most notably platforms like military vehicle vision systems. Its potential is supported by an addressable market of more than €3bn forecast to grow at double-digit rates. Combining this with a low capital-intensity business model should drive positive financials and strong cash generation.
Year end |
Revenue (€m) |
PBT* |
EPS* |
DPS |
P/E |
Yield |
12/22 |
143 |
38 |
N/A |
0 |
N/A |
N/A |
12/23 |
219 |
50 |
N/A |
0 |
N/A |
N/A |
12/24e |
339 |
83 |
93 |
31 |
11.1 |
3.0 |
12/25e |
382 |
96 |
104 |
35 |
9.9 |
3.4 |
Note: *PBT and EPS are normalised, excluding amortisation of acquired intangibles, exceptional items and share-based payments. FY22/23 EPS excluded as pre-IPO structure.
Strong growth profile
Theon reported a 49% CAGR in FY18–23 and growth of 93% in Q1–Q324. The defence optronics market is expected to grow at a CAGR of 11.5% between 2022 and 2027 (source: Renaissance Strategic Advisors), around double that of the overall defence market. This is being driven by macro elements like current conflicts and increasing defence budgets, particularly within NATO, but also sector-specific fundamentals such as the increasing use of drones promoting the importance of night warfare. Theon management aims to outperform these markets through a combination of geographic expansion and product development into adjacent markets, in particular the platform (vehicle-mounted) sector. The order book stood at €400m at the end of September before the recently announced €74m of new orders, surpassing €150m of new orders in Q424.
Efficient and effective business model
Through its in-house engineering capabilities, Theon develops customer-focused and bespoke vision enhancement systems using ‘best-of-breed’ components to meet demanding military specifications. It assembles products using components from an international supply chain, reducing the requirement for major capital investment. This drives a compelling product offering and attractive financials, highlighted by an average operating margin of 22.6% and return on capital employed (ROCE) of 68% in FY19–23, with results for the first nine months of this year supporting our expectation for upside in these metrics in FY24.
Valuation: Discount reflects market caution
After a solid market debut, Theon’s shares have drifted back to around the IPO price of €10 a share, underperforming the aerospace and defence sector, which is up c 15% over the same period. Theon’s shares trade at a c 50% discount to our peer-based valuation of €19.7/share. As the company builds a positive track record on the public market, expands geographically and through new product lines, along with development of the order pipeline, we would expect increased market interest and confidence to feed through to a re-rating of the stock.
Investment summary
Company description: Augmented vision systems specialist
Theon International is a specialist optronics company serving primarily the defence sector. It commands a leading position in the European market for night vision systems for the military man-portable market and a growing presence in other geographies, including North America and the Middle East. The group has a nascent position in thermal-based systems and is developing its presence in the platform (on-vehicle) market. The total addressable market is estimated at more than $3bn and expected to show a CAGR of 11.5% between 2022 and 2027 (source: Renaissance Strategic Advisors, Theon prospectus) or, we estimate, a CAGR of 16.5% weighted to Theon’s current activity profile. The group operates a product development and assembly model, maximising customer focus and limiting capital requirement, driving high margins (FY23 operating margin: 25.5%) and a higher return on capital (FY23 ROCE: 79%). The last reported order book was €400m, including two high-profile military contracts: one with the Organisation for Joint Armament Cooperation (OCCAR) in Europe to supply the Germany and Belgium military (a joint venture with Hensoldt Group) and a contract in association with Elbit Systems in the US to supply the Marine Corps, providing solid visibility
Valuation: Clear upside to peers
Our blended peer-based valuation of €19.7/share is the average of €19.4/share using specialist defence companies and €20.0/share using companies with part of their activity involved in augmented vision systems. Our discounted cash flow (DCF) valuation of €15.8/share is somewhat lower, using a high Greece-orientated cost of capital to reflect Theon’s base, albeit this is arguably harsh given less than 1% of sales originate in Greece. Using a defence company peer-based cost of equity would increase our DCF valuation to €21.7/share. We see the key catalyst as future contract awards to build on the soft order backlog, which has declined through FY23 to date, while continuing to build a solid financial track record.
Financials: High margins/exceptional return on capital
In the five years to FY23, Theon reported a CAGR of 49%, an average operating margin of 22.6% and an average ROCE of 68%. Our expectations are for this performance to continue in FY24, with growth of 55%, an operating margin of 24% and ROCE of around 80%. The company is benefiting from operational gearing delivered by a strong growth profile, alongside its assembly/outsourced model, which limits the capital requirements of the business.
Sensitivities: Defence spend provides key delta
Theon’s key defence market is growing rapidly (NATO member spend is expected to grow by 10.9% in real terms in 2024, according to NATO), with continued growth anticipated given current geopolitical tensions, albeit the impact of the change of administration in the US is currently unclear. Within this, man-portable vision systems are expected to grow faster as the military looks to increase soldier-to-night-vision-equipment ratios to 1:1 in response to new warfare patterns such as the impact of growing drone warfare. The resolution of current conflicts could affect defence spend, having a clear impact on Theon, although a re-equipping cycle post Ukraine and pledges by NATO members combined with Theon’s own expansion plans should also support budgets. Military contracts are key to the group, although in FY23 it reported three customers over 10% of sales (23%,14% and 12%), suggesting that although individual contracts are important, Theon is not reliant on any single customer or contract.
Activity profile
Theon is a Cyprus-registered company with its key operations, including product development and assembly facilities, in Athens. The business was established in 1997 and has become a leading player in the European military optronics market. Theon develops and manufactures night vision and thermal imaging systems for military and specialist non-military markets. It operates an asset-light model as an assembler utilising an extensive supply chain. The key component of a night vision system is the image intensifier tube (IIT) at c 60% of bill of materials, for which Theon has a long-term supply agreement with Photonis Group (a subsidiary of Exosens) and recently acquired 60% of Harder Digital, a small German manufacturer of tubes. The company was listed on the Euronext Amsterdam exchange in February 2024, raising €154m before costs, a combination of €54m in existing shares and €100m in new money.
Technology
Augmented vision systems are based on two different technologies:
■
Night vision: magnifies existing low-level ambient light images along with converting near-infrared (IR) light into visible light, which can then be seen by humans. At the core of the system is an IIT. IITs receive photons from a light source, which strike a photocathode plate, releasing electrons. These are accelerated using a voltage differential, before striking a microchannel plate causing multiple electrons to be released (the magnification stage), which continue to a phosphor plate (green or white) reversing the initial conversion back to photons of visible light that can then be focused and viewed.
■
Thermal: thermal systems provide a visible image of the IR energy or heat emitted, transmitted and reflected by an object. The IR waves are converted into an electronic signal by a sensor (different types of sensors can be used). These pixels can then be interpreted into a viewable format. The ‘picture’ is therefore a representation of the thermal variation.
Night vision operates over shorter distances but provides greater detail and clearer identification of the target. The system intensifies the light available and is therefore, to an extent, dependent on the level of light providing restrictions in certain conditions such as fog or smoke. Thermal systems offer a greater range but, as they only record a ‘thermal signature’, less detail.
The next generation of systems use fused imagery to combine night vision and thermal capabilities into a vision system, offering enhanced vision across a spectrum of conditions. Theon has already developed these products.
|
Exhibit 1: Night vision image |
Exhibit 2: Thermal image |
||
|
|
||
|
Source: Theon |
Source: Buzun Maksimilian (iStock) |
|
Exhibit 1: Night vision image |
||
|
||
|
Source: Theon |
||
|
Exhibit 2: Thermal image |
||
|
||
|
Source: Buzun Maksimilian (iStock) |
Theon’s key strength is as a product development company, designing high quality, rugged and light equipment using best-of-breed components. Key to the design philosophy has been a platform-based approach. This permits ease and speed of customisation for relevant applications, including addressing differing contract specifications, along with interconnectivity of devices.
Current product portfolio
Theon’s offering can be split by technology (night vision versus thermal) and application (man-portable versus platform). Its primary focus has been on the night vision market (c 90% of sales), primarily in the man-portable segment. Theon has two key product end markets:
■
Man-portable (ie soldier/operator hand-held or helmet mounted). Apart from overall performance, magnification and image clarity, the focus is on size, ease of use (particularly for sights that have to be mounted on a weapon), ruggedness and reliability for this critical operational tool. Theon also offers accessories including 3x magnifier, antifogging, laser protection filters and ease of operation on the battlefield using AA batteries. Such products cost €3,000–10,000 per unit.
■
Platform (ie military vehicles, both wheeled and tracked, as well as other situations such as marine). Systems either for driver vision enhancement and/or for 360-degree local situational awareness.
|
Exhibit 3: Key product offerings |
|
|
Source: Theon International |
Product development pipeline
The roadmap looks to fill in the product portfolio, expand into new arenas and incorporate the latest technology developments, including the increasing systems and integration requirements.
■
Man-portable night vision becomes part of an integrated information system. Technology advances are driving the next generation of integrated systems. Goggles offer a blended night vision/thermal image picture, weapon sights can be integrated to enable ‘off-shoulder’ targeting and information can be sent and received from command control, providing instant situational awareness, target analysis and a host of additional information for both parties. Theon has termed this Augmented Reality Modular Ecosystem of Devices (A.R.M.E.D).
■
Platforms. The aim is to develop a range of integrated new products. Again, we expect the key here to be in systems and battlefield communications integration. Note that Theon recently committed to a €10m development programme, including external partners. Prototypes are expected to be ready by the end of 2025, with an anticipated impact on sales starting in 2026.
■
Non-military market. Theon already has exposure to this market through its strategic partnership agreement with EOTECH Systems in the US. The market ranges from security services, fire and rescue through to hunting. Theon is developing high-end products such as thermal/night vision sights and clip-ons. This is being carried out through partnerships, for example with Lightforce Group (Australia) and Nightforce (US).
Aftermarket and service
Theon offers a range of follow-on-services such as training, spares and maintenance and upgrade and customisation. Support is increasingly important as the level of complexity of night vision systems rises. Such support also provides a differentiating factor, enabling Theon to build a longer-term relationship and loyalty with customers. Theon continues to expand its physical geographical presence, highlighted by the recently established business in Denmark, which will support customers in Denmark and the Nordic region. Reliability is key and an IIT lasts 10,000 hours, hence the direct financial opportunity is limited (currently c 1% of group revenue) although such commitment arguably also supports original equipment bids.
Business model
Theon operates a low capital-intensity business model. A specialist core provides critical product development and assembly operations, while a network of suppliers and partners provides the required supply chain and distribution bandwidth.
Product design and development
Theon designs and develops systems using best-of-breed technologies and components from third parties, depending on customer specifications. It does not undertake pure technology research. The group focuses on applications engineering, ensuring product optimisation alongside operational performance in key areas like ruggedness, lifetime and battery consumption. A further focus is on ergonomics, increasingly important as the goggles become an integral part of the communication system leading to increased use. This enables speed and customisation of products required for bidding on multiple military contracts.
Low-cost assembler
Theon does not manufacture parts but assembles bought-in components either manufactured to specification or acquired off the shelf. This reduces the capital investment required and brings greater flexibility, albeit requiring significant attention to supply chain management. This provides flexibility in the cost base and is highlighted by FY23 sales per employee of €785k and employee cost to sales of 4.8% (compared with Hensoldt sales per employee of €276k and cost to sales of 34.4%). The recent acquisition of Harder Digital, a small manufacturer of IITs, brings a degree of vertical integration, albeit of a critical component from both a technical and cost (c 60% of bill of materials) perspective.
The group’s key manufacturing facilities are in Athens, with two assembly facilities (3,500m² and 4,800m²), requisite clean rooms and capacity for c €400m revenue with a single shift operation. Theon also has a smaller facility in Germany (300m²) through its joint venture with Hensoldt and an assembly line in North America through an agreement with EOTECH.
Partnerships
Theon partners with other organisations to ensure compliance with local content/offset requirements and to limit the capital investment required. Key agreements at present are in the following countries:
■
Germany: partnership with Hensoldt for final assembly of night vision goggles for the European OCCAR contract. Theon has a 49.9% stake in the venture based in Wetzlar, Germany, which assembles Theon’s kits.
■
United States: partnership with Elbit Systems for the US Marine Corps contract, won by Elbit and which assembles Elbit tubes with Theon kits.
■
United States: EOTECH assembly agreement targeting non-military (fire, rescue and security markets).
■
Switzerland: partnership with Safran providing final assembly for the Armasuisse contract (now completed).
■
Saudi Arabia: partnership with local technology firm National Company for Mechanical Systems for final assembly of products for the army, which is important given Saudi Arabia’s Vision 2030 plan targeting 50% of defence budget spent locally.
Supply chain and competition
The nationalistic biases in the defence sector, along with the vertical integration of key component (IITs) and systems suppliers in the enhanced vision segment, engender the relationship between suppliers and competitors.
Supply chain
Theon has a broad supply base for the majority of components, which are either manufactured to Theon’s specification or, if standard specification, bought off the shelf. However, for night vision the key element is the IIT, which accounts for c 60% of the bill of materials. There are four key suppliers in the market:
■
Photonis Group: a subsidiary of French group Exosens, which manufactures amplification, detection and imaging technology sensors and subsystems. In September 2024, Theon announced a strategic supply agreement covering 2025 and 2026, with an option for 2027.
■
Elbit Systems: an Israel-based defence electronics company with $6bn of sales. A vertically integrated supplier of tubes and night vision systems. Elbit is Theon’s partner in North America for the five-year $500m indefinite-delivery/indefinite-quantity (IDIQ) contract to supply the US Marine Corps.
■
L3Harris: a US-based group, generating $19.4bn in revenue, specialising in national defence as both a prime (60%) and component/subsystem (40%) supplier operating across a range of technologies and sectors. IIT forms part of the $5bn Communication Systems division. L3Harris also supplies complete night vision systems.
■
Harder Digital: a small Germany-based manufacturer focused on IITs in which Theon has acquired a 60% stake through a cash injection to assist expansion of the business (announced in September 2024).
Competition
Competition ranges from large prime defence companies such as BAE Systems and Safran to more specialist electronics/systems companies such as Hensoldt and Teledyne FLIR. Key competitors are shown in Exhibit 4. There are also a number of smaller companies generally supplying to their domestic military market (eg NightVision Lasers in Spain or PCO in Poland).
|
Exhibit 4: Key competition |
|
|
Source: Theon International |
Market prospects
The defence market is set for a period of continued strong growth with the Electro-optical/infrared (EO/IR) segment which Theon serves set to benefit from additional specific factors.
Defence spend is increasing
The current global geopolitical situations in Ukraine and the Middle East are inevitably leading to security concerns and increased government spend on defence. This is being supplemented by a replacement cycle for equipment that has been gifted to Ukraine and can best be seen in the context of NATO spend. In 2014, NATO members made a commitment to increase spending as a percentage of GDP to 2%. By 2022, only seven member states were achieving these levels. However, with real growth in combined NATO spend of 3.9% in 2023 and 10.8% expected in 2024, the number of countries reaching the 2% target is expected to rise to 23 out of 31 in 2024 (source: NATO). This is highlighted in Exhibit 5, with the US as the dominant (more than 60%) contributor shown separately.
|
Exhibit 5: Growth in spending (2015 constant price) |
|
|
Source: North Atlantic Treaty Organization |
EO/IR additional dynamics
Alongside market growth are several additional factors expected to accelerate EO/IR system growth ahead of the general market. These include the following:
■
A shift to drone warfare is leading to increased infantry night-time activity, requiring enhanced soldier capability, including night vision.
■
Up-equipping ensuring a 1:1 ratio of EO/IR equipment per soldier.
■
Increased use of small arms and operations in built-up areas requiring greater target identification and accuracy.
■
Increased integration of battlefield equipment and IT requiring additional capabilities of systems accelerating an upgrade cycle.
|
Exhibit 6: Defence optronics market by region ($m) |
Exhibit 7: Defence optronics market by application ($m) |
|
|
|
Source: Renaissance Strategic Advisors, Theon prospectus. Note: MENA, Middle East and North Africa. |
Source: Renaissance Strategic Advisors, Theon prospectus |
|
Exhibit 6: Defence optronics market by region ($m) |
|
|
Source: Renaissance Strategic Advisors, Theon prospectus. Note: MENA, Middle East and North Africa. |
|
Exhibit 7: Defence optronics market by application ($m) |
|
|
Source: Renaissance Strategic Advisors, Theon prospectus |
Renaissance Strategic Advisors forecasts 9.5% growth in platform-based systems and 16.8% in dismounted systems between 2022 and 2027, providing an 11.5% increase in Theon’s addressable market. We note that Theon’s activity profile is heavily weighted towards the dismounted segment, hence we calculate activity-based market growth potential for Theon of 16.3%.
|
Exhibit 8: Forecast CAGR (2022–27) |
|
|
Source: Renaissance Strategic Advisors, Theon prospectus, Edison Investment Research |
In addition to market growth, there has been a shift in procurement to larger framework agreements, particularly in Europe, more in line with the US procurement protocol, consisting of multi-year IDIQ contracts with subsequent annual volume agreements or drawdowns. This provides greater certainty and allows improved planning for suppliers.
Growth strategy
Significant focus remains on operational performance and delivering on the current order books. In addition, management aims to execute its growth strategy through a combination of organic growth, acquisitions and partnerships. These include the following:
Product expansion
We discussed the roadmap for developing the current product profile above. Clearly, there is a move to integrate systems and enhance communications. This may require additional capabilities which, given the required speed and technical complexity, Theon may need to find a partner for or acquire. Areas of interest that would complement Theon’s current technologies include day sights, laser targeting systems and fire control systems. New products in non-military applications such as hunting or law enforcement are more likely to fall within the group’s existing capabilities. The key is likely to be the ‘go-to-market’ strategy given the potential for local content in regulated markets or the strength of incumbent suppliers in their brands.
Geographic expansion
In FY23, more than 80% of Theon’s sales were into Europe, suggesting significant under-representation elsewhere in the world. Theon has a network of agents, but significant geographical expansion is likely to require a physical presence, either directly or through a partnership. The recent acquisition of Focus Optech in South Korea provides an example, providing a first presence in the key territory of Asia to support future production.
Consolidation
There are a number of smaller regional or national players in the market. Such acquisitions should provide a relatively low-risk entry into new markets along with synergy opportunities. Such expansion is likely to prove somewhat easier in established regions than winning tenders as an external supplier.
Recent strategy in action
2024 has seen a number of initiatives that fall clearly within the strategic expansion roadmap:
■
Exosens extended supply agreement. Exosens is the primary supplier of IITs to Theon. The recent agreement covers Theon’s requirements for 2025–26, with an option for 2027, providing Theon with security of supply in a tight market, while certainty assists Exosens with its production scheduling.
■
Acquisition of Harder Digital. This vertical integration acquisition brings a supplier of IITs into the group, ensuring certainty of supply for this critical component. The company is owned by its management and has operations in Germany, Latvia and Serbia. Expected FY24 revenues are €17m, with c 50% of production to Theon. Theon will provide a €34m cash injection for a 60% holding in the business, enabling significant expansion with the expectation of trebling sales and achieving an EBITDA margin in the mid-20s by 2028, suggesting attractive financials for Theon as well. Harder will bring additional niche technologies which should assist its product development.
■
Acquisition of Focus Optech, a South Korean precision components supplier. This relatively small investment of €300k reflects the size of the business, which has around 10 employees. This will provide greater control over the group’s expanding Asian supply chain and a local assembly base to support future activity in the region.
■
New service facility in Denmark established. This will support regional territories, most notably throughout Scandinavia, key in Theon’s service orientated support strategy.
Key contracts
Current key contracts:
■
United States Marine Corp: The initial 2019 contract for more than 17,000 units, valued at €249m held by Elbit Systems which assembles and supplies the Theon NYX night vision binocular in the US. The contract is due for completion in 2024. In November 2023, Elbit won a five-year $500m IDIQ contract for Squad Binocular Night Vision Goggles, for which Theon will provide kits of its NYX binoculars for assembly in the US by Elbit.
■
OCCAR: in 2022 in collaboration with Hensoldt Optronics, the joint venture won an initial contract for 29,550 night vision goggles for German and Belgian armed forces valued at €200m. The second phase was signed in 2024 for 3,500 night vision goggles for Belgium, 16,041 night vision goggles and 8,423 Head Mounting Systems for Germany with an option for up to 25,000 additional night vision goggles each for Belgium and Germany.
■
NATO Support and Procurement Agency: contract signed in December 2023 covering thermal weapon sights and thermal monoculars for up to five years (we note these are for thermal systems rather than night vision).
■
Central European armed force: supply of NYX night vision binoculars with a contract value of €23m plus an option for an additional €70m. Deliveries start at the end of 2024, with the bulk of systems to be delivered in 2025.
■
European NATO member state: €8m contract for ARGUS night vision monocular with immediate delivery.
■
Estonian Defence Forces: 8,000 ARGUS night vision monoculars with a value of c €35m, with a potential add-on value of more than €20m.
Potential future significant contracts:
■
US Army: in the short term, there is a replacement requirement for systems donated to Ukraine. A more significant contract to replace 350,000 army soldier systems is due to be awarded in 2025, likely to multiple suppliers.
■
Germany: future soldier systems/new assault rifles. Upgrade soldier digitisation including night vision.
■
Kingdom of Saudi Arabia/ United Arab Emirates: upskilling forces with night vision capabilities and sights.
Financials
Historical performance
Exhibit 9 highlights the strong growth seen in recent years. We note that revenue in the first three quarters has already surpassed FY23, which ensures that FY24 will be another year of strong growth. Exhibit 10 highlights the outperformance of the key end markets, the dismounted optronics sector and the European optronics sector.
|
Exhibit 9: Sales growth |
Exhibit 10: Growth against the market |
|
|
|
Source: Theon International |
|
Exhibit 9: Sales growth |
|
|
Source: Theon International |
|
Exhibit 10: Growth against the market |
|
|
Source: Theon International |
Exhibit 11 highlights Theon’s positive financial returns. FY21 and FY22 clearly benefited from particularly strong gross margins, which have now returned to more normal levels, in line with management’s medium-term expectations. We also note the operational gearing benefits, with central costs (SG&A/R&D) declining as a proportion of sales as the business has grown (18.3% in FY19 to 6.6% in FY23), providing positive operational gearing. The group generates a high return on capital, as shown in Exhibit 12, benefiting from the low capital-intensity assembly model the group employs, along with a healthy operating margin.
|
Exhibit 11: Financial performance |
Exhibit 12: Return on capital (%) |
|
|
|
Source: Theon International |
|
Exhibit 11: Financial performance |
|
|
Source: Theon International |
|
Exhibit 12: Return on capital (%) |
|
|
Source: Theon International |
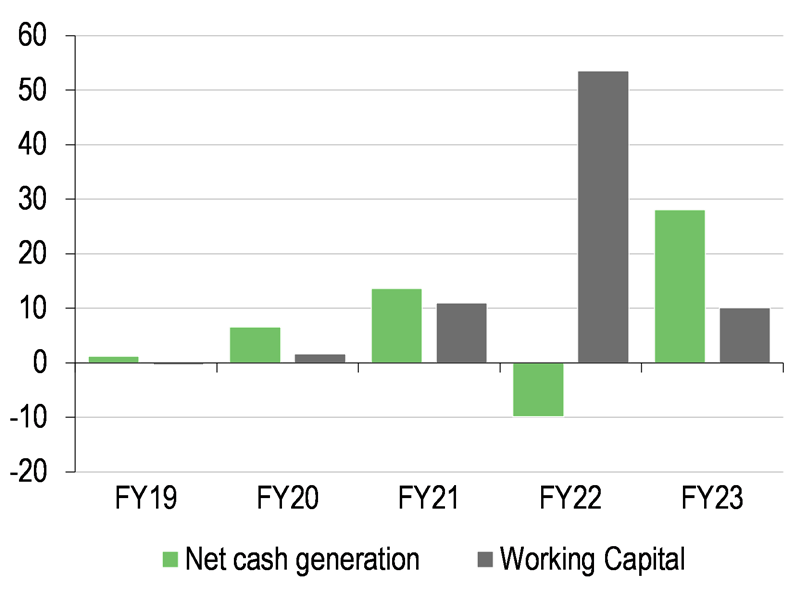
Operational cash flow has also been healthy, with conversion averaging 85% over the last five years and negative cash generation in only one year despite supporting strong growth. There was a clear anomaly in FY22. As Exhibit 13 shows, this was due to working capital requirements reflecting a strong end to FY22 and a strategic decision to acquire additional key components where the supply chain was becoming tight.
|
Exhibit 13: Operational cash conversion |
Exhibit 14: Net cash generation (pre financing), €m |
|
|
|
Source: Theon International |
|
Exhibit 13: Operational cash conversion |
|
|
Source: Theon International |
|
Exhibit 14: Net cash generation (pre financing), €m |
|
|
Source: Theon International |
Peer comparison
Exhibit 15 shows a comparison of peer financials in FY23. For some peers, enhanced vision systems is relatively small. For instance, L3Harris, a key competitor in North America, with Communications Systems division revenue of $5.1bn and group revenue of $19.4bn. Nevertheless, it is worth noting that the relevant divisions of all companies make healthy returns, with Theon clearly at the upper end. Hensoldt is the exception, which might raise some concern given the partnership between Theon and Hensoldt in Europe. As the venture is accounted for as an associate, Theon’s accounts provide more detailed financials of the venture, reporting FY23 revenue of €20.7m and EBIT of €1.7m.
Exhibit 15: Peer key financials
Company |
L3Harris |
Elbit Systems |
Exosens |
Hensoldt |
Teledyne |
Theon |
Division |
Communication Systems |
ISTAR & EW |
Amplification |
Optronics |
Digital Imaging |
Group |
Revenue (€m) |
4,817 |
947 |
210 |
304 |
2,987 |
219 |
Sales growth |
11.6% |
13.0% |
34.7% |
-1.0% |
1.0% |
53% |
Operating margin |
24.2% |
13.5% |
22.7% (group) |
3.6% |
16.5% |
25.5% |
R&D/sales (group) |
2.8% |
7.1% |
5.6% |
5.0% |
c 7% |
1.3% |
Source: Company accounts
FY24 results and guidance
Exhibit 16 shows quarterly performance to date, along with our forecasts for the full year and hence the final quarter. Clearly, we are anticipating a strong close to the year for the group. Such seasonality is normal after the holiday affected Q3 in Europe, supplemented by governments tending to utilise budget surpluses by the end of the period. Exhibit 17 highlights the high level of Q4 contribution in FY22 and FY23, as well as that anticipated in Q424.
Exhibit 16: FY24 quarterly results and forecasts
€m |
Q1 |
Q2 |
Q3 |
Q4e |
FY24e |
Sales |
75.8 |
76.6 |
70.2 |
116.7 |
339.3 |
COGS |
(53.7) |
(52.0) |
(51.7) |
(76.6) |
(234.1) |
Gross profit |
22.0 |
24.6 |
18.5 |
40.0 |
105.2 |
Admin expenses |
(3.7) |
(2.9) |
(3.2) |
(3.8) |
(13.6) |
Sales and distribution |
(0.7) |
(1.0) |
(0.7) |
(1.0) |
(3.4) |
R&D |
(0.8) |
(1.2) |
(1.2) |
(3.5) |
(6.8) |
Other |
(0.0) |
0.1 |
0.0 |
(0.1) |
0.0 |
Operating profit |
16.8 |
19.6 |
13.4 |
31.7 |
81.4 |
Financial income |
(0.6) |
(0.3) |
(1.0) |
0.4 |
(1.5) |
Share of Associates |
0.3 |
0.9 |
0.5 |
1.3 |
3.0 |
PBT |
16.5 |
20.1 |
12.9 |
33.4 |
82.9 |
Gross margin |
29.1% |
32.2% |
26.3% |
34.3% |
31.0% |
Operating profit margin |
22.2% |
25.5% |
19.1% |
27.1% |
24.0% |
Source: Theon International, Edison Investment Research
Exhibit 17: Seasonality – Q4 as a proportion of the full year
FY22 |
FY23 |
FY24e |
|
Sales |
52% |
47% |
34% |
Profit |
55% |
58% |
39% |
Sales growth |
11.6% |
13.0% |
34.7% |
Source: Theon International, Edison Investment Research
Forecasts
Management’s guidance has remained unchanged through the year for revenues of €330–350m along with operating margins in the mid-teens. The company recently stated that management will provide guidance for FY25 before the end of the calendar year. The company is currently participating in tenders with a total value in excess of €500m. Announcements here will clearly be helpful for sentiment and confidence given the decline in the ‘soft backlog’ seen so far over the year. Note that the company has already announced orders over €150m in Q4 (including €74m announced on 20 November) as part of normal business including year-end purchases as annual defence spend budgets conclude.
|
Exhibit 18: Soft backlog (€m) |
|
|
Source: Theon International |
Exhibit 19: P&L
€m |
2021 |
2022 |
2023 |
2024e |
2025e |
2026e |
Organic growth |
|
|
|
|
|
|
Night |
|
|
|
52.5% |
12.0% |
10.0% |
Thermal |
|
|
|
100.0% |
20.0% |
30.0% |
Misc & Other |
|
|
|
50.0% |
10.0% |
10.0% |
Group organic growth |
48.6% |
77.4% |
53.1% |
55.1% |
12.5% |
11.5% |
Operating ratios |
|
|
|
|
|
|
Gross margin |
41.8% |
35.1% |
32.1% |
31.0% |
32.0% |
32.5% |
Distribution costs/sales |
6.6% |
1.4% |
1.3% |
1.0% |
1.1% |
1.2% |
Administrative costs/sales |
1.9% |
5.0% |
4.3% |
4.0% |
4.0% |
4.0% |
R&D/sales |
1.8% |
1.4% |
1.3% |
2.0% |
2.5% |
2.0% |
Other/sales |
0.1% |
0.8% |
0.2% |
0.0% |
0.2% |
0.2% |
Operating margin |
31.5% |
28.2% |
25.5% |
24.0% |
24.2% |
25.1% |
Turnover: |
|
|
|
|
|
|
Night |
|
126.5 |
202.7 |
309.1 |
346.2 |
380.8 |
Thermal |
|
13.0 |
12.2 |
24.5 |
29.4 |
38.2 |
Misc |
|
0.7 |
1.7 |
2.5 |
2.8 |
3.1 |
Other |
|
2.7 |
2.1 |
3.2 |
3.5 |
3.8 |
Group turnover |
80.6 |
142.9 |
218.7 |
339.3 |
381.8 |
425.9 |
Cost of sales |
(46.9) |
(92.7) |
(148.5) |
(234.1) |
(259.6) |
(287.5) |
Gross profit |
33.6 |
50.2 |
70.2 |
105.2 |
122.2 |
138.4 |
Distribution costs |
(5.3) |
(2.0) |
(2.7) |
(3.4) |
(4.2) |
(5.1) |
Administrative costs |
(1.5) |
(7.1) |
(9.3) |
(13.6) |
(15.3) |
(17.0) |
Research & development |
(1.5) |
(2.0) |
(2.8) |
(6.8) |
(9.5) |
(8.5) |
Other |
0.1 |
1.1 |
0.4 |
0.0 |
(0.8) |
(0.9) |
Group operating profit |
25.4 |
40.2 |
55.7 |
81.4 |
92.4 |
106.9 |
Associates (PAT) |
|
0.0 |
0.6 |
3.0 |
3.5 |
4.0 |
Financing charges |
0.0 |
(2.5) |
(6.5) |
(1.5) |
0.0 |
0.0 |
PBT before exceptionals |
25.4 |
37.8 |
49.9 |
82.9 |
95.9 |
110.9 |
Tax reported |
|
(7.8) |
(13.8) |
(18.4) |
(21.3) |
(24.6) |
Tax rate underlying |
0% |
21% |
28% |
23% |
23% |
23% |
Minority interest |
|
|
|
(0.1) |
(2.0) |
(3.0) |
Reported |
25.4 |
30.0 |
36.1 |
64.4 |
72.6 |
83.3 |
EPS adjusted (c) |
N/A |
N/A |
N/A |
92.6 |
103.8 |
119.0 |
EPS adjusted fully diluted (c) |
N/A |
N/A |
N/A |
92.6 |
103.8 |
119.0 |
EPS growth |
|
|
|
54% |
12% |
15% |
Average share count (m) |
|
|
20.0 |
60.0 |
69.6 |
70.0 |
Source: Theon International, Edison Investment Research
Exhibit 20: Cash flow
€m |
2021 |
2022 |
2023 |
2024e |
2025e |
2026e |
Operating profit (pre exceptional/goodwill) |
25.4 |
40.2 |
55.7 |
81.4 |
92.4 |
106.9 |
Depreciation |
1.3 |
1.0 |
1.0 |
1.7 |
4.1 |
4.7 |
Amortisation other intangibles |
|
0.5 |
0.5 |
0.5 |
0.6 |
0.7 |
EBITDA |
26.7 |
41.7 |
57.2 |
83.6 |
97.1 |
112.2 |
Net change in WC |
0.0 |
(44.1) |
(8.6) |
(26.8) |
(7.2) |
(8.6) |
Share of associates |
|
|
|
(3.0) |
(3.5) |
(4.0) |
Other adjusting items |
|
|
0.4 |
(1.0) |
(2.0) |
(3.0) |
Operating cash flow |
26.7 |
(2.4) |
49.0 |
52.8 |
84.3 |
96.6 |
Returns & servicing of finance |
0.0 |
(0.2) |
(2.0) |
0.0 |
1.8 |
2.0 |
Total tax paid |
0.0 |
(3.7) |
(11.3) |
(16.5) |
(19.1) |
(22.1) |
Net capex |
0.0 |
(3.7) |
(7.6) |
(15.0) |
(10.0) |
(12.0) |
Free cash flow |
26.7 |
(9.9) |
28.1 |
21.3 |
57.0 |
64.5 |
Acquisitions & disposals |
0.0 |
(0.3) |
(0.5) |
(20.0) |
(6.0) |
(1.0) |
Equity dividends paid |
|
|
(10.0) |
(14.4) |
(21.6) |
(24.2) |
Shares issued/(repurchased) |
|
|
|
93.0 |
(6.0) |
|
Net cash flow |
26.7 |
(10.3) |
17.6 |
79.9 |
23.4 |
39.3 |
Other non-cash including loans to related parties |
|
(8.7) |
(6.4) |
|||
Net cash/(debt) brought forward |
7.9 |
9.0 |
(10.0) |
0.8 |
80.7 |
104.0 |
Movement in net debt |
26.7 |
(19.0) |
10.8 |
79.9 |
23.4 |
39.3 |
Net cash/(debt) |
34.6 |
(10.0) |
0.8 |
80.7 |
104.0 |
143.3 |
Source: Theon International, Edison Investment Research
Management
Further detailed biographies of key management and board personnel can be found on page 20. Exhibit 21 highlights the stability and experience within the team.
Exhibit 21: Key executive management
Position |
Appointed |
|
Christian Hadjiminas |
Founder/CEO |
1997 |
Vassilios Savvaidis |
Founder/MD |
1997 |
Dimitris Parthenis |
CFO |
2017 |
Philippe Mennicken |
Business development director |
2010 |
Anastasios Lolis |
Production manager |
2020 |
Nikos Malesiotis |
Head of M&A and investor relations |
2022 |
Source: Theon International
Risks and sensitivities
Theon is subject to a range of potential risks and risks. The majority of these we view as relatively standard for a defence-related company.
Reduced global hostilities
Resolution of the current conflicts might suggest a reduction in defence spend and hence a risk to Theon’s revenues. However, there are a number of reasons that support a more positive market. There will be replacement demand, which is likely to be supplemented by increased penetration per soldier; government spend commitments, at least within NATO, are unlikely to reduce; and technology developments, including the need to fully integrate equipment, will fuel an upgrade cycle.
Contract risks
The group’s business is dominated by significant defence contracts. In FY23, the three largest customers accounted for 23%,14% and 12% of sales. We note that the concentration for other defence companies is higher: Avon Technologies US DoD 45%, QinetiQ UK MoD 62% and Cohort UK MoD 34%. The award and timing of such contracts is therefore critical to the fortunes of the group. In addition, the ability to deliver and performance guarantees provide a degree of uncertainty.
Export restrictions and other governmental controls
As a supplier of military equipment, the company must comply with government export regulations. In addition, these are subject to change as geopolitical situations develop, which could affect the group’s ability to win new business or deliver on existing contracts.
Supply chain
As an assembler, the performance of the supply chain is critical for the company to deliver product. The key component of IIT (c 60% of bill of materials) has been in short supply. To overcome this, Theon has signed a long-term supply agreement and acquired a controlling 60% stake in Harder Digital, a smaller German manufacturer of IITs.
Person with significant interest
Founder, CEO and Vice Chair Christian Hadjiminas’s current holding of c 75% gives him significant control over the company.
Valuation
We look at a ‘relative’ valuation compared to listed companies operating in a similar space and an ‘absolute’ valuation using a DCF model.
Relative valuation: Peer comparison
We have valued Theon against two peer groups. The first includes companies involved in enhanced vision systems, albeit this is a relatively small part of some of these companies (eg L3Harris with $19.4bn in revenue). The second covers small to mid-sized defence-orientated companies offering an array of specialist activities. The first cohort suggests a valuation of €20.0/share and the second €19.4/share based on average EV/EBITDA, EV/EBIT and P/E in 2024–26e.
Exhibit 22: Peer-based valuation
Market cap |
EV/EBIT (x) |
EV/EBITDA (x) |
P/E (x) |
|||||||
€m |
2024e |
2025e |
2026e |
2024e |
2025e |
2026e |
2024e |
2025e |
2026e |
|
Theon |
611 |
7.4 |
6.4 |
5.6 |
7.2 |
6.2 |
5.4 |
9.5 |
8.1 |
7.3 |
Enhanced vision systems |
||||||||||
Elbit Systems |
10,405 |
78.7 |
72.5 |
66.8 |
63.2 |
56.4 |
52.1 |
120.0 |
115.5 |
100.1 |
Hensoldt |
4,089 |
15.6 |
12.8 |
11.0 |
11.2 |
9.5 |
8.3 |
23.2 |
18.7 |
16.0 |
L3Harris |
43,233 |
16.3 |
15.1 |
14.1 |
12.8 |
12.0 |
11.4 |
18.7 |
17.0 |
15.4 |
Exosens |
964 |
14.2 |
12.0 |
11.2 |
10.6 |
9.4 |
8.8 |
18.2 |
13.6 |
12.2 |
Teledyne |
20,451 |
22.2 |
20.2 |
19.0 |
18.6 |
17.2 |
16.0 |
24.2 |
21.9 |
20.1 |
Median |
16.3 |
15.1 |
14.1 |
12.8 |
12.0 |
11.4 |
23.2 |
18.7 |
16.0 |
|
THEON EBIT/EBITDA |
81 |
92 |
107 |
84 |
97 |
112 |
92.6 |
103.8 |
||
Enterprise valuation |
1,327 |
1,395 |
1,507 |
1,071 |
1,165 |
1,279 |
||||
Cash/(debt)* |
81 |
104 |
143 |
81 |
104 |
143 |
||||
THEON equity valuation |
1,408 |
1,499 |
1,651 |
1,151 |
1,269 |
1,423 |
||||
THEON valuation (per share) |
20.1 |
21.4 |
23.6 |
16.4 |
18.1 |
20.3 |
21.5 |
19.4 |
19.0 |
|
Specialist defence |
||||||||||
Avon Technologies |
486 |
14.7 |
11.3 |
9.7 |
10.4 |
8.8 |
8.3 |
19.4 |
13.9 |
11.8 |
Cadre Holdings |
1,228 |
21.1 |
16.7 |
14.8 |
13.7 |
12.3 |
11.2 |
30.9 |
24.3 |
21.1 |
Chemring |
1,142 |
14.7 |
12.8 |
11.3 |
10.5 |
9.7 |
8.6 |
18.3 |
17.6 |
15.6 |
Cohort |
453 |
15.3 |
13.8 |
12.2 |
12.5 |
11.4 |
10.1 |
20.6 |
18.9 |
16.4 |
DroneShield |
384 |
174.4 |
28.7 |
15.7 |
113.7 |
25.3 |
14.5 |
38.2 |
27.9 |
18.6 |
Electro Optic Systems |
124 |
328.7 |
15.1 |
14.4 |
22.3 |
9.6 |
10.0 |
-10.8 |
23.1 |
13.3 |
Invisio |
1,035 |
36.5 |
28.9 |
23.0 |
31.1 |
25.1 |
20.4 |
50.6 |
38.8 |
31.0 |
QinetiQ |
2,799 |
10.8 |
9.8 |
9.1 |
7.9 |
7.3 |
6.9 |
13.2 |
11.8 |
10.8 |
RENK |
2,017 |
14.9 |
11.8 |
10.1 |
11.8 |
9.6 |
8.2 |
21.0 |
15.5 |
13.0 |
Median |
18.2 |
14.5 |
12.8 |
13.1 |
10.6 |
10.1 |
20.8 |
20.1 |
16.0 |
|
THEON EBIT/EBITDA |
81 |
92 |
107 |
84 |
97 |
112 |
92.6 |
103.8 |
119.0 |
|
Enterprise valuation |
1,482 |
1,335 |
1,366 |
1,096 |
1,024 |
1,128 |
||||
Cash/(debt)* |
81 |
104 |
143 |
81 |
104 |
143 |
||||
THEON equity valuation |
1,563 |
1,439 |
1,510 |
1,176 |
1,128 |
1,271 |
||||
THEON valuation (per share) |
22.3 |
20.6 |
21.6 |
16.8 |
16.1 |
18.2 |
19.3 |
20.9 |
19.0 |
|
Source: LSEG Data & Analytics, Edison Investment Research. Note: *Includes €50m of fixed-term deposits over three months. Prices as at 21 November 2024.
Discounted cash flow
Our DCF uses five-year forecasts followed by a terminal value. Defence budgets are set for the medium term, as are contracts with suppliers, even if only IDIQ in nature. Combining this with independent forecasters’ views of the next four years provides a degree of confidence for this forecasting period. We then flex the terminal value depending on grow rates.
The second key element is the discount rate. The Greek bond yield is currently 3.6% and market risk premium 8.3%. We use a Beta valuation of 0.75 derived from the peer group of defence companies, suggesting an overall cost of capital of 10%. Assuming a long-term growth rate of 2%, Exhibit 23 suggests a valuation of €15.8/share. Theon has less than 1% of sales to Greece, with the majority to state governments, which might suggest that using a Greek cost of equity is somewhat harsh. We note that using a cost of equity similar to other defence stocks with an average of 7.7% would translate to a valuation of c €21.7 per share.
Exhibit 23: DCF valuation (€/share)
Long-term growth rate |
|||||||
1.0% |
2.0% |
3.0% |
4.0% |
||||
WACC |
13.0% |
11.1 |
11.8 |
12.6 |
13.6 |
||
12.0% |
12.0 |
12.9 |
13.9 |
15.1 |
|||
11.0% |
13.1 |
14.2 |
15.5 |
17.1 |
|||
10.0% |
14.5 |
15.8 |
17.5 |
19.8 |
|||
9.0% |
16.2 |
17.9 |
20.3 |
23.5 |
|||
8.0% |
18.4 |
20.8 |
24.1 |
29.1 |
|||
7.0% |
21.3 |
24.7 |
29.9 |
38.5 |
|||
Source: Edison Investment Research
Overall valuation
Our DCF valuation of €15.8/share is below our peer-based relative valuation of €19.4–20.0/share. This gap reflects the higher cost of capital used. With our valuation assuming a similar cost of capital to other defence stocks, our DCF increases to €21.7, above our peer-based valuation. Hence, overall, we believe that €19.7/share, the average of the two peer groups, provides a fair valuation.
Exhibit 24: Financial summary
€m |
2022 |
2023 |
2024e |
2025e |
2026e |
||
Year to 31 December |
IFRS |
IFRS |
IFRS |
IFRS |
IFRS |
||
INCOME STATEMENT |
|||||||
Revenue |
|
|
142.9 |
218.7 |
339.3 |
381.8 |
425.9 |
Cost of Sales |
(92.7) |
(148.5) |
(234.1) |
(259.6) |
(287.5) |
||
Gross Profit |
50.2 |
70.2 |
105.2 |
122.2 |
138.4 |
||
EBITDA |
|
|
41.7 |
57.2 |
83.6 |
96.3 |
112.8 |
Normalised operating profit |
|
|
40.2 |
55.7 |
81.4 |
92.4 |
106.9 |
Reported operating profit |
40.2 |
55.7 |
81.4 |
92.4 |
106.9 |
||
Joint ventures & associates (post tax) |
0.0 |
0.6 |
3.0 |
3.5 |
4.0 |
||
Net Interest |
(2.5) |
(6.5) |
(1.5) |
0.0 |
0.0 |
||
Profit Before Tax (norm) |
|
|
37.8 |
49.9 |
82.9 |
95.9 |
110.9 |
Profit Before Tax (reported) |
|
|
37.8 |
49.9 |
82.9 |
95.9 |
110.9 |
Reported tax |
(7.8) |
(13.8) |
(18.4) |
(21.3) |
(24.6) |
||
Profit After Tax (norm) |
30.0 |
36.1 |
64.5 |
74.6 |
86.3 |
||
Profit After Tax (reported) |
30.0 |
36.1 |
64.5 |
74.6 |
86.3 |
||
Minority interests |
0.0 |
0.0 |
(0.1) |
(2.0) |
(3.0) |
||
Net income (normalised) |
30.0 |
36.1 |
64.4 |
72.6 |
83.3 |
||
Net income (reported) |
30.0 |
36.1 |
64.4 |
72.6 |
83.3 |
||
Basic average number of shares outstanding (m) |
N/A |
20 |
60 |
70 |
70 |
||
EPS - basic normalised (c) |
|
|
N/A |
N/A |
93 |
104 |
119 |
EPS - diluted normalised (c) |
|
|
N/A |
N/A |
93 |
104 |
119 |
EPS - basic reported (c) |
|
|
N/A |
N/A |
93 |
104 |
119 |
Dividend (c) |
0 |
0 |
31 |
35 |
40 |
||
Revenue growth (%) |
77.4 |
53.1 |
55.1 |
12.5 |
11.5 |
||
Gross Margin (%) |
35.1 |
32.1 |
31.0 |
32.0 |
32.5 |
||
EBITDA Margin (%) |
29.2 |
26.1 |
24.7 |
25.4 |
26.3 |
||
Normalised Operating Margin (%) |
28.2 |
25.5 |
24.0 |
24.2 |
25.1 |
||
BALANCE SHEET |
|||||||
Fixed Assets |
|
|
22.0 |
21.7 |
61.2 |
52.5 |
60.2 |
Intangible Assets |
0.8 |
1.5 |
16.9 |
2.0 |
2.1 |
||
Tangible Assets |
10.6 |
17.4 |
40.6 |
46.6 |
53.9 |
||
Investments & other |
10.6 |
2.9 |
3.7 |
3.9 |
4.2 |
||
Current Assets |
|
|
135.4 |
188.8 |
315.2 |
359.9 |
421.3 |
Stocks |
34.0 |
63.6 |
98.7 |
111.0 |
123.9 |
||
Debtors |
68.0 |
46.1 |
71.5 |
80.5 |
89.7 |
||
Cash & short term deposits |
24.0 |
65.6 |
131.6 |
155.0 |
194.2 |
||
Other |
9.3 |
13.4 |
13.4 |
13.4 |
13.4 |
||
Current Liabilities |
|
|
(89.1) |
(100.1) |
(115.7) |
(127.7) |
(140.3) |
Creditors |
(24.0) |
(41.8) |
(64.9) |
(73.0) |
(81.4) |
||
Tax and social security |
(6.1) |
(8.0) |
(9.8) |
(11.9) |
(14.4) |
||
Short term borrowings |
(31.0) |
(32.4) |
(28.9) |
(25.4) |
(25.4) |
||
Other |
(28.1) |
(17.9) |
(12.1) |
(17.3) |
(19.1) |
||
Long Term Liabilities |
|
|
(4.0) |
(33.0) |
(47.5) |
(29.1) |
(30.0) |
Long term borrowings |
(3.1) |
(32.1) |
(25.5) |
(25.5) |
(25.5) |
||
Other long term liabilities |
(0.9) |
(0.9) |
(22.0) |
(3.6) |
(4.4) |
||
Net Assets |
|
|
64.3 |
77.5 |
213.2 |
255.6 |
311.2 |
Minority interests |
0.0 |
0.0 |
10.0 |
10.0 |
10.0 |
||
Shareholders' equity |
|
|
64.3 |
77.5 |
223.2 |
265.6 |
321.2 |
CASH FLOW |
|||||||
Op Cash Flow before WC and tax |
41.7 |
57.2 |
83.6 |
97.1 |
112.2 |
||
Working capital |
(44.1) |
(8.6) |
(26.8) |
(7.2) |
(8.6) |
||
Exceptional & other |
0.0 |
0.4 |
(4.0) |
(5.5) |
(7.0) |
||
Tax |
(3.7) |
(11.3) |
(16.5) |
(19.1) |
(22.1) |
||
Net operating cash flow |
|
|
(6.1) |
37.7 |
36.3 |
65.2 |
74.5 |
Capex |
(3.7) |
(7.6) |
(15.0) |
(10.0) |
(12.0) |
||
Acquisitions/disposals |
(0.3) |
(0.5) |
(20.0) |
(6.0) |
(1.0) |
||
Net interest |
(0.2) |
(2.0) |
0.0 |
1.8 |
2.0 |
||
Equity financing |
0.0 |
0.0 |
93.0 |
(6.0) |
0.0 |
||
Dividends |
0.0 |
(10.0) |
(14.4) |
(21.6) |
(24.2) |
||
Net Cash Flow |
(10.3) |
17.6 |
79.9 |
23.4 |
39.3 |
||
Opening net debt/(cash) |
|
|
(9.0) |
10.0 |
(0.8) |
(80.7) |
(104.0) |
FX |
0.0 |
(0.4) |
0.0 |
0.0 |
0.0 |
||
Other non-cash movements |
(8.7) |
(6.4) |
0.0 |
0.0 |
0.0 |
||
Closing net debt/(cash) |
|
|
10.0 |
(0.8) |
(80.7) |
(104.0) |
(143.3) |
Source: Company accounts, Edison Investment Research
|
|||||||||||||||||||||||||||||||||||||||||||
|
|
Research: Real Estate
Care REIT (Care), formerly Impact Healthcare REIT, and its tenants continued to perform strongly in Q324. The quarterly EPRA net tangible assets (NTA) return of 2.1% took the year-to-date total to 7.8%, while rent cover increased to 2.3x. Care is well on track to meet its FY24 DPS target of 6.95p (+2.7%), fully covered by adjusted ‘cash’ earnings, with a yield of 8.3%. The company has also announced two new investments, including forward funding the development of a new, high-quality home, at an accretive blended yield in excess of 8% with strong valuation potential.