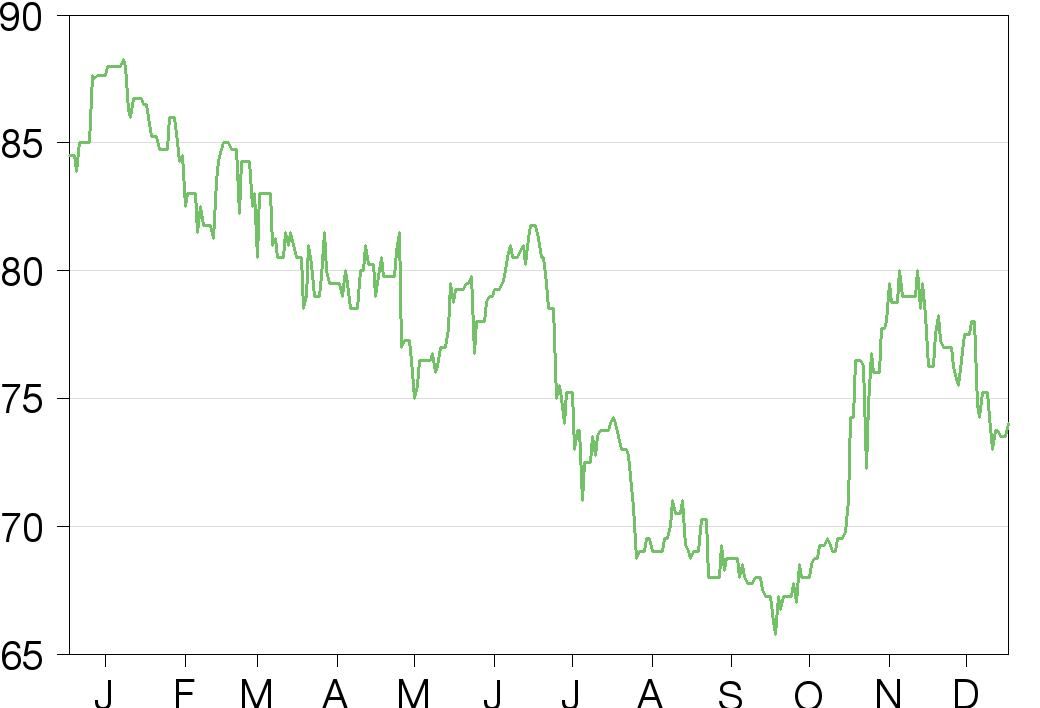
Last close As at 05/08/2026
—
— 0.00 (0.00%)
Market capitalisation
—
Research: Financials
Park Group continued to trade well in H119, with order books in line with expectations, a reduced seasonal loss, strong cash flow and the dividend increased. Early results from the strategic review undertaken by the new senior management team indicate a further push towards full digital enablement, harnessing market trends to further grow the core multi-retailer redemption offering in existing markets and tap new areas with strong potential.
Park Group |
Building on strengths |
Interims and strategy update |
Financial services |
18 December 2018 |
Share price performance
Business description
Next event
Analysts
Park Group is a research client of Edison Investment Research Limited |
|||||||||||||||||||||||||||||||||||||||||||||||
Park Group continued to trade well in H119, with order books in line with expectations, a reduced seasonal loss, strong cash flow and the dividend increased. Early results from the strategic review undertaken by the new senior management team indicate a further push towards full digital enablement, harnessing market trends to further grow the core multi-retailer redemption offering in existing markets and tap new areas with strong potential.
Year end |
Billings* |
Revenue |
PBT** |
EPS** |
DPS |
P/E |
Yield |
03/17 |
404.5 |
119.6 |
11.9 |
5.1 |
2.90 |
14.6 |
3.9 |
03/18 |
412.8 |
111.1 |
12.6 |
5.5 |
3.05 |
13.5 |
4.1 |
03/19e |
422.3 |
114.3 |
12.8 |
5.6 |
3.20 |
13.3 |
4.3 |
03/20e |
449.5 |
119.5 |
14.3 |
6.2 |
3.35 |
11.9 |
4.5 |
Note: *Billings is a non-statutory measure of sales defined as the face value of voucher sales and the amount of value loaded onto prepaid cards, less any discount given to customers. **PBT and EPS (fully diluted) are on a statutory basis.
Good H1: Minimal IFRS 15 impact
Park’s business is highly seasonal, with c 75% of annual revenues and all of the profits falling into the second half of the year, including the key Christmas trading period. Importantly, for the current (FY19) year, the H119 results to 30 September show underlying trading and order books in line with expectations. The seasonal pre-tax loss reduced to £1.5m (H118: £1.9m), mainly due to timing factors, cash flow was strong and the interim dividend was increased by 5%. The anticipated IFRS 15 restatements show a relatively modest annual profit deferral of c 3%, with no impact on billings, ultimate profitability, cash flow or dividend-paying capacity. Our FY19 PBT estimate falls c 6% due to this profit deferral, and also as a result of expenses related to the strategic review undertaken by the new senior management team.
Focus, efficiency and growth
The strategic review highlights the good growth potential in multi-retailer redemption products and the strengths of Park’s existing offering. It also highlights opportunities for growth and efficiency through streamlining, simplification and an acceleration in the digital enablement that has driven growth over the past 10 years. Card and digital formats are leading growth in existing markets and will be given yet more focus. Park also plans to use that same technological and product capability to further penetrate the consumer market, a £2bn+ market opportunity where its current penetration is minimal compared with its dominant position in the Christmas savings market and strong position in the business sector.
Valuation: Upside to 87p fair value
Our fair value estimate is unchanged at 87p. This is derived from our modified DCF valuation (unchanged at 90p) and a P/E relative comparison with a broad range of companies that share similar characteristics of 84p (14x FY20e calendar earnings). This comparison highlights the scope for accelerated growth from digital enablement to support valuation.
A UK leader in multi-redemption cards and vouchers
Park Group, a UK-based, specialised financial services business, is one of the leading UK providers of prepaid gift cards, multi-retailer gift vouchers and digital rewards services, a fragmented market that the UK Gift Card & Voucher Association estimates to be worth c £6bn per year. These products and services are distributed by Park through its corporate and consumer businesses. In the corporate business they are used to supply more than 30k businesses with a range of incentive and reward products, often tailor made. In the consumer business they are purchased by more than 400k individual customers, most using prepayment plans that provide an effective, disciplined and convenient way to budget for Christmas. For the group as a whole, the majority of sales are generated online, which complements and supports traditional distribution through a direct salesforce and agents. Income is generated from the service fees paid to Park by partner retailers, leisure and other service providers, based on the face value of money spent via Park’s cards and vouchers. Interest is earned on all prepaid cash until the obligation to the redeemers has been settled.
New management team looking to build on strengths
Park has a good track record of growth in earnings, cash flow and dividends, over a number of years, and has a debt free balance sheet. A constant investment in digital capabilities and product innovation has been a hallmark of this performance. The charts below show the recent record on the newly restated IFRS 15 basis.
|
Exhibit 1: Upward trend in EPS... |
Exhibit 2: …and DPS, with strong cover |
|
|
|
Source: Park Group |
|
Exhibit 1: Upward trend in EPS... |
|
|
Source: Park Group |
|
Exhibit 2: …and DPS, with strong cover |
|
|
Source: Park Group |
This is a very positive starting point for the new senior management team that has been assembled over the past year which, as may be expected, has undertaken a comprehensive review of the business with a view to ensuring that the group has the right strategy in place to strengthen its existing position, as well as taking advantage of the opportunities that exist to accelerate growth. As discussed in detail below, the review provided a generally positive message about the prospects for multi-redemption products, and Park’s existing products and services but also highlights opportunities for their improvement, allowing the group to accelerate growth and tap new areas of demand, while enhancing efficiency.
The new management team is led by chief executive Ian O’Doherty, who joined Park in January 2018. He brings a strong background in financial services, specifically in banking, payments and card services, which appears well suited to leading the continued development of the business. Prior to joining Park, his experience includes 25 years at MBNA, most recently as chairman and CEO of MBNA in the UK, where he oversaw the reorganisation of the business and the re-engineering of its digital capabilities. The new CFO, Tim Clancy, took up his post in August, joining Park from Assurant Europe, the European subsidiary of Assurant, the US-listed global insurance provider, where he had held the role of chief financial officer since 2013. That role has included overseeing a number of acquisitions in the UK and Europe and their integration into the group. Other important appointments have been made in the areas of operation and technology.
Interim results
Park has a highly seasonal business, with around three-quarters of annual revenues, and all of the profits, recorded in the second half of the year, which includes the important Christmas trading period. For the current year (FY19), the interim results for the six months ended 30 September 2018 (H119) showed a reduced seasonal pre-tax loss of £1.5m (H118: £1.9m), good cash flow and a further increase in DPS.
Exhibit 3: Summary of interim results
£m unless stated otherwise |
H119 |
H118 |
FY18 |
|
Consumer billings |
34.3 |
31.4 |
9% |
224.5 |
Corporate billings |
74.7 |
74.0 |
1% |
188.2 |
Total billings |
109.0 |
105.4 |
3% |
412.8 |
Revenue |
27.4 |
30.6 |
-10% |
111.1 |
Cost of sales |
(21.1) |
(24.6) |
-14% |
(79.6) |
Gross profit |
6.3 |
5.9 |
6% |
31.4 |
Distribution costs |
(0.6) |
(0.6) |
3% |
(3.0) |
Admin costs |
(8.0) |
(7.9) |
1% |
(17.1) |
Operating profit |
(2.3) |
(2.6) |
-11% |
11.3 |
Net finance income |
0.8 |
0.7 |
17% |
1.3 |
Profit before tax |
(1.5) |
(1.9) |
-21% |
12.6 |
Tax |
0.3 |
0.4 |
(2.4) |
|
Net profit after tax |
(1.2) |
(1.6) |
-21% |
10.2 |
Basic EPS (p) |
(0.67) |
(0.84) |
5.50 |
|
Diluted EPS (p) |
(0.67) |
(0.84) |
5.48 |
|
DPS (P) |
1.05 |
1.00 |
5% |
3.05 |
‘Peak cash’ - including held in trust |
235.8 |
229.0 |
229.0 |
|
Period-end group cash (exc overdraft) |
32.5 |
5.4 |
34.2 |
Source: Park Group
The key financial highlights for the period were:
■
Group billings increased by just over 3%. Billings in the Consumer business increased c 9%, benefiting from accelerated shipments. Corporate billings were up by c 1%, held back by the discontinuance of some low-margin business, and would otherwise have been ahead by c 8%. Park multi-retailer redemption billings for cards and vouchers increased c 9%, with card billings up c 15%, continuing to increase share, and paper billings down c 1%.
■
Revenues were similarly affected by the discontinuance of the low-margin Corporate sales, but gross profit was ahead by c 6%.
■
Administrative expenses were little changed compared with H118, despite c £300k of expenses related to the strategic review undertaken by the new management team and, we estimate, some costs incurred as a result of senior management hiring. The main offset was a significant reduction in share-based payment expenses of more than £600k.
■
Net finance income benefited from an increase in average cash balances (both the shareholder balance and the segregated customer balances on which Park earns interest) and a pick-up in interest margin, reflecting firmer short-term bank deposit rates. The seasonal ‘peak’ cash balance for the year, a good barometer of underlying customer order progress, reached £235.8m (FY18: £229.0m) with average cash balances in the half year of £212.4m compared with £199.6m in FY18.
■
The seasonal pre-tax loss reduced to £1.5m from £1.9m a year earlier, continuing the downward trend of recent years. The interim dividend per share was increased 5% compared with the prior half-year to 1.05p.
Key operational developments included:
■
The accelerated shipments in the Consumer business had a positive impact on H119 billings (+9%) and revenues (+18%), leading to a reduction in the seasonal operating loss from £3.4m in H118 to £3.1m. A better guide to the full-year performance is the order book, which is broadly stable, in line with the expectation expressed by management at the time of the full year results in June.
■
The order book in the Corporate business is ahead of this time last year, in line with the underlying H119 billings performance before the impact of the discontinuance of the low-margin business. This affected billings to ‘intermediary’ customers (typically re-sellers) by £6.3m, with a similar impact on revenues (third-party product, reported gross). All other categories of billings grew, with employee benefits up c 19%, staff rewards up c 15% and customer incentives up c 24%. The operating profit increased from £2.1m to £2.4m.
■
The number of retailers accepting Park’s gift vouchers has increased to 175 (20k high street stores across the UK), including the addition of Arcadia Group (Topshop, Topman and Miss Selfridge), Office Outlet, Jaeger, Austin Reed, DJM Music, Fat Face, TK Maxx and The Entertainer.
Focusing on multi-redemption cards and vouchers
The strategic review included a wide-ranging survey of the market, and an in-depth analysis of the group’s existing operations and platform, as well as the further requirements to support the business plan. Park gathered views from non-customers as well as customers, defining the latter broadly to include consumers of its products, businesses customers, and retail/redemption partners.
Feedback from this customer review showed that there is a strong appetite for the multi-retailer product in the market. Management will focus on enhancing and growing this part of its offering, where it has strong products and capabilities, representing 84% of current billings. Park is well regarded by its customers, but there is much opportunity to increase demand from existing customer groups and to tap new market segments, by improving and simplifying the product range, as well as how the products can be bought and used.
An analysis of the marketplace highlights a particular opportunity to address the broader consumer market for a multi-redemption product, alongside Park’s existing dominant position in the Christmas savings consumer segment and strong positions in the corporate market segments (Exhibit 4). Park believes that enhancements to its product offering are also likely to strengthen its appeal to business customers.
Exhibit 4: Park’s existing market position
£m |
Market size |
Park share |
Consumer |
||
Christmas savings |
300 |
71.0% |
Other Consumer |
2,600 |
0.2% |
Total consumer |
2,900 |
7.5% |
Business |
||
Incentives |
800 |
6.5% |
Employee benefits |
700 |
5.0% |
Staff rewards |
1,400 |
6.6% |
Total business |
2,900 |
6.2% |
Source: Park group, UK Gift Card & Voucher Association
The other significant trend that will continue to shape strategy is that while the market as a whole continues to show good growth, with the UK Gift Card & Voucher Association estimating 8.7% growth in the first half of 2018, there is considerable variation in growth rates between different formats. The card format, and to an even greater extent digital, continues to grow strongly and increase share at the expense of paper vouchers. This trend is not new, and Park has been investing in its card and digital capabilities over a number of years. In FY18, card billings represented 42% of Park’s in-house, multi-redemption billings, with digital at 4% and paper vouchers the balance. We expect paper vouchers to be less than half of the total in the current year as card and digital formats continue to grow faster. However, management intends to push this transformation harder to support growth in existing markets, open new markets and improve efficiency.
|
Exhibit 5: Changing format usage |
|
|
Source: Park Group, UK Gift Card & Voucher Association |
Bringing together the business review and market analysis, Park’s strategic business plan has four key pillars, with initial action being undertaken on each.
The four strategic pillars, and announced early actions in support of these are:
■
A focus on the multi-retailer redemption proposition.
•
Park plans to separate hamper production from the core business as a first step towards simplifying the product range and providing focus within the multi-redemption activities. Future actions will see a consolidation in the number of products, a more disciplined approach to new product development, and redefinition and rationalisation of the brands.
■
Making it easier for all customers (consumers, businesses, and the retailer partners) to work with Park.
•
The immediate goal is to further enhance the IT capabilities of the group so as to reach a point where Park is able to offer full digital enablement across the product range, integrated to support contactless and mobile wallets for consumers. With digital products as the default, paper vouchers and cards would then support the digital offering as demanded by consumers, rather than representing separate product lines. If achieved, the ease of use for the consumer would be greatly enhanced. With the technology in place, it should also be possible to develop a common list of retailers/redeemers across payment methods, and also to provide valuable analytical feedback to the retailers.
■
Improving efficiency and effectiveness.
•
The group will move the majority of its core operations to new offices in Liverpool city centre (fulfilment and redemption activities will remain at the current site, along with separated hamper production). The move is intended to provide the core activities with access to a wider talent pool, benefiting from an existing hub of like-minded fintech businesses in central Liverpool. Management anticipates that productivity improvements and the potential sale or subletting of vacated space should substantially mitigate the cost of the move and accelerate the pay-back period.
■
Broadening the customer appeal to drive growth.
•
The group is working on the details of a new product targeting a substantial share of the £2bn+ consumer market for multi-redemption cards and vouchers in which it is currently only modestly represented. This is at an early stage now and is yet to get to a prototype, but the intention is to build on the existing strengths while targeting a broader demographic than the current Christmas savings business. The concept is to offer a discrete savings pot, similar to Christmas savings, which can be managed in real time but be spendable all year round on products or experiences through Park’s multi-retailer redemption proposition. We would expect weddings and holidays to be considered potential targets for these savings pots. It seems likely that the profitability of the product will continue to be driven by retailer service fees and interest earned on customer balances, although compared with Christmas savings these balances may be of shorter duration and potentially more variable.
Financials
These interim results were the first to be reported by Park under IFRS 15 which, as has been well flagged, has a significant impact on reported revenues and defers some profit recognition into future periods, but has no impact on billings, profitability or cash flow. We explain the changes and impact on the financial statements in a separate section towards the end of this note. The historical financial statements are summarised on page 11, and our forecasts are stated on a fully adjusted basis.
|
Exhibit 6: No change to billings growth trend… |
Exhibit 7: …but revenues restated |
|
|
|
Source: Park Group |
|
Exhibit 6: No change to billings growth trend… |
|
|
Source: Park Group |
|
Exhibit 7: …but revenues restated |
|
|
Source: Park Group |
In underlying terms, the interim results appear substantially in line with our previous estimates. Our lower PBT forecast for the current year (FY19) is predominantly the result of the c £0.3m H119 strategic review costs and the full-year impact of IFRS 15 profit deferral. The latter impact follows through into FY20. Our forecast DPS growth remains unchanged. There is no IFRS 15 impact on our cash flow forecasts.
Exhibit 8: Estimate revisions
Billings (£m) |
Revenue (£m) |
PBT (£m) |
Diluted EPS (p) |
DPS (p) |
|||||||||||
New |
Old |
Change |
New |
Old |
Change |
New |
Old |
Change |
New |
Old |
Change |
New |
Old |
Change |
|
03/19e |
422.3 |
435.7 |
-3% |
114.3 |
N/A |
N/A |
12.8 |
13.6 |
-6% |
5.6 |
5.9 |
-5% |
3.20 |
3.20 |
0% |
03/20e |
449.5 |
461.4 |
-3% |
119.5 |
N/A |
N/A |
14.3 |
14.5 |
-2% |
6.2 |
6.2 |
-1% |
3.35 |
3.36 |
0% |
Source: Edison Investment Research
The key forecasting assumptions that we have made include:
■
Billings growth of 2.3% in FY19 and 6.5% in FY20, comprising Consumer billings +0.7%/+5.0% and Corporate +4.2%/+8.1%. At this early stage, we have made no attempt to forecast the impact of the strategic plan in terms of potential new products and/or the rationalisation/re-engineering of the existing product range.
■
Revenues and cost of goods sold are determined by the assumed product mix, with an implicit assumption that there is no material change in redemption patterns from year to year. We expect gross profit as a percentage of billings in the year to continue to drift slightly higher (7.7% in FY20 versus 7.6% in FY18).
■
Assumed administrative expense remains broadly stable as a proportion of billings. At this stage we have not made any allowance for the planned office move and we note that a new, five-year senior employee incentive scheme is planned before year end, for which details are not yet agreed. It also seems likely that management may step up IT investment, although no details are available yet. Although capitalised, it is possible that amortisation charges may increase as a result, when compared with the broadly flat level that we currently assume. Management indicates that investment in new enterprise resource planning (ERP) and cloud technology should greatly enhance capabilities and capacity, and reduce operating expense, with a relatively short payback period.
■
We have not assumed any significant change in the c 90 basis points of interest earnings on cash balances reported for H119, although increasing cash balances lead to higher overall net interest income.
Valuation
Our approach to valuing Park is to consider a potential absolute valuation, based on a modified DCF analysis, alongside a relative value based on a comparison with a selected group of listed stocks that are engaged in activities which provide some overlap with Park. We would not go so far as to call this a peer group comparison because no such listed group exists. Park’s competitor employee benefits and service providers are either private companies or relatively small parts of larger groups, complicating any attempt at a relative valuation approach.
The average of these two measures points to an unchanged valuation objective of 87p per share.
Our modified DCF valuation is unchanged at 90p. It is modified in the sense that we include the interest earned by Park on segregated customer cash balances (but not on the group cash balance), as this is an integral part of the returns that the company generates. The customer cash itself is excluded from the overall valuation, and also the voucher provisions balance as this will eventually flow out in settlement of vouchers that have been issued but not yet redeemed. For now, our forecasts go out to March 2020, and beyond this we grow free cash flow at 5% pa until year 10 (FY28), enhanced by an assumed normalisation of interest rates to 3% from FY21. The terminal cash flow is valued at 10x, and we use a discount rate of 10%. The terminal value represents 47% of the total 90p value.
A 1% increase in the assumed discount rate, leads to a reduction in the terminal multiple to 9.0x, or a 1% reduction in the long-term growth rate reduces the value by c 6%, 5% or 5% respectively. Holding all of the other assumptions constant, the current share price could be said to be assuming a long-term growth in free cash flow of just below 2% pa.
Turning to the relative value comparison, in incentive and rewards products, Sodexo and Edenred are both much larger and more international than Park, and the overlap with Sodexo is limited; Sodexo Benefits and Rewards Services is only a minor part of Sodexo Group.
We have added data for two providers of payments services, Euronet Worldwide and Wirecard. Neither provides a direct overlap with Park, but we include them to provide an insight into the potential for Park’s plans for further digital enablement. Euronet Worldwide is a global provider of electronic payment and transaction processing solutions including, in its e-pay segment (c one-third of revenues) the provision of electronic processing of prepaid mobile airtime ‘top-up’ services and other non-mobile content through a network of point-of-sale (POS) terminals. It also provides vouchers and physical gift fulfilment services, gift card distribution and processing services, and digital code distribution. Wirecard develops a full range of products for mobile payments systems for customers in retail, services and banking sectors. It also provides systems to support merchant loyalty programmes and the analysis of point of sale data.
Finally, because there has historically been some demographic/socioeconomic overlap between the traditional customer bases of Park’s Christmas prepayments business (c 50% of Park) and the UK-based home collected credit lenders (HCC), we have included data for the latter in the table below. We readily accept that the read-across is somewhat limited, and recognise the difference between the savings nature of Park’s Christmas prepayments business and the lending nature of HCC. Given that Park has no credit risk and we believe it has less regulatory risk, we would expect a higher valuation.
Taking the data as a whole, and exercising our judgement, we continue to believe that c 14x prospective calendar earnings represents a reasonable valuation objective. This would indicate a value of 84p per share.
In addition, we note that the table highlights the potential upside to valuation from faster growth, increasing scale, and a greater focus on digital payments services.
Exhibit 9: Listed comparator data
Share price (local) |
Market cap |
P/E (x) |
P/E (x) |
EV/EBITDA (x) |
EV/EBITDA (x) |
Yield |
|
Incentive |
|||||||
Edenred |
31.9 |
6,827 |
28.8 |
25.3 |
16.7 |
14.8 |
2.7% |
Sodexo |
90.3 |
11,920 |
18.0 |
17.0 |
10.7 |
10.1 |
3.0% |
Incentive average |
23.4 |
21.2 |
13.7 |
12.4 |
2.9% |
||
Payment services |
|||||||
Euronet Worldwide |
101.0 |
4,123 |
18.4 |
14.7 |
10.0 |
8.1 |
0.0% |
Wirecard |
134.6 |
14,896 |
45.1 |
32.4 |
27.5 |
20.2 |
0.2% |
Payment services average |
31.7 |
23.5 |
18.8 |
14.2 |
0.1% |
||
HCC/consumer finance |
|||||||
Morses Club |
1.4 |
175.9 |
0.1 |
0.1 |
7.8 |
6.7 |
5.7% |
Non-standard Finance |
0.7 |
211.2 |
0.2 |
0.1 |
11.9 |
8.5 |
3.5% |
Provident Financial |
6.0 |
1517.7 |
0.1 |
0.1 |
18.3 |
13.9 |
1.8% |
HCC/consumer finance average |
0.1 |
0.1 |
12.7 |
9.7 |
3.7% |
||
Whole group average |
15.8 |
12.8 |
14.7 |
11.8 |
2.4% |
||
Park Group |
74.0 |
138 |
13.4 |
12.3 |
8.3 |
7.6 |
4.3 |
Source: Thomson Reuters. Note: Prices at 17 December 2018. Edison estimates for Park Group. Earnings data on a calendar year (CY) basis.
IFRS 15 changes and impacts
IFRS 15 (‘Revenue from contracts with customers’) is a new accounting standard in respect of revenue recognition that applies to businesses across all industries. It was endorsed by the EU in September 2016 and became effective for annual reporting periods beginning on or after 1 January 2018. The main aim of the standard is to remove previous inconsistencies in revenue recognition and improve comparability. We discuss the main changes and the effects on the financial statements below. For readers requiring further details on this complex subject, Park has made a presentation available.
The main effect of the introduction of IFRS 15 is to bring the accounting treatment for prepaid cards and in-house vouchers into line with each other, as summarised in Exhibit 10.
Exhibit 10: Summary of IFRS 15 accounting changes
Vouchers |
Previous treatment |
IFRS 15 treatment |
Revenues |
Face value on despatch |
Service fee on redemption |
Discounts |
Netted against revenue on despatch |
Netted against revenue on redemption |
Agent commissions |
Cost of sales as incurred |
Cost of sales as redemption |
Breakage |
Cost of sales on despatch |
Revenue on redemption |
Cards |
Previous treatment |
IFRS 15 treatment |
Service fee revenue |
Service fee on redemption |
Card fee revenue |
Card fees as levied |
Discount |
Netted against revenue on redemption |
Agent commissions |
Cost of sales as incurred |
Cost of sales on redemption |
Breakage (cards with no right of redemption) |
Revenue on load |
Revenue on redemption |
Breakage (cards with right of redemption) |
Fees recognised on and after expiry |
Source: Park Group
It is worth remembering that it is the IFRS 15 impact on revenue recognition that drives the income statement changes and that:
■
orders received from customers are not revenues, and where accompanied by cash prepayments are initially shown on the balance sheet as customer liabilities and segregated customer cash but have no P&L impact; and
■
billings is a non-statutory measure of customer activity representing the value of vouchers, cards, and other goods and services shipped and invoiced to customers. Billings is unaffected by IFRS 15.
What has changed under IFRS 15 is the way that some of the revenues, in respect of Park’s in-house vouchers are reported, and when:
■
All voucher revenues (in-house and third-party provided) were previously recorded when the vouchers were despatched to the customer (at the point of billing) and were recorded ‘gross’, generating revenues that were equal to face value less any discounts.
■
Under IFRS 15 in-house voucher revenues are not recorded until the vouchers are redeemed and it is recognised on a ‘net’ basis, representing the service fees receivable from the retailers/ redemption partners. This aligns the revenue recognition for in-house vouchers with that of cards. Voucher revenues are materially reduced, and along with profit recognition, slightly deferred, but profitability (the profits recognised at the point of redemption) is unaffected.
■
Revenue recognition for third-party cards (as well as other goods and services) remains unchanged, on a gross basis.
■
Revenue recognition for cards remains unchanged, on a net basis.
There are other, less significant changes in the timing of the recognition of ‘breakage’, which itself arises from the fact that a certain proportion of the vouchers and cards sold by and distributed by Park will never be redeemed. In the case of in-house vouchers and cards (but not third-party products), this is a source of additional earnings. Under IFRS 15, breakage for in-house vouchers is slightly deferred, being recognised in proportion to the rate of redemption rather than at the point of despatch, as done previously. Breakage is only recognised on those cards that have no right of redemption (ie where the customer cannot request a refund of the value loaded), representing approximately two-thirds (c £44m) of card billings through the Corporate business in FY18. This is slightly deferred under IFRS 15, from recognition at the point of loading to recognition in proportion to the rate of redemption, as with in-house vouchers.
Complex as all of this sounds, it is worth making the point that the impact on historically reported profits is relatively small and is only a timing effect, with ultimate profitability (and cash flow) unaffected. In order to provide investors with a clearer insight into its impacts, Park has adopted the ‘full retrospective method’ of IFRS 15 application, providing restated financial statements from the beginning of FY15. Exhibit 11 shows the significant main impact on revenue in those prior years, substantially offset by changes to reported cost of sales, leaving a relatively modest impact on PBT. The extent of the impact varies from year to year depending on changes in the product mix as well as the timing and profile of customer redemption activity. Assuming unchanged redemption patterns, an increased share of in-house vouchers would be expected to increase the impact on revenues and the amount of profitability deferred to later periods.
Exhibit 11: Summary of key restatements
£m |
FY15 |
FY16 |
FY17 |
FY18 |
Revenue |
||||
Revenue - as reported |
293.3 |
302.5 |
310.9 |
296.2 |
IFRS 15 adjustment |
(207.6) |
(202.0) |
(191.3) |
(185.1) |
Revenue - restated |
85.8 |
100.6 |
119.6 |
111.1 |
Cost sales |
||||
Cost of sales - as reported |
(266.0) |
(274.1) |
(280.8) |
(264.5) |
IFRS 15 adjustment |
206.8 |
202.0 |
190.8 |
184.9 |
Cost of sales - restated |
(59.2) |
(72.0) |
(89.9) |
(79.6) |
Profit before tax (PBT) |
||||
PBT- as reported |
10.9 |
11.9 |
12.4 |
12.9 |
IFRS 15 adjustment |
(0.8) |
0.0 |
(0.5) |
(0.3) |
PBT - restated |
10.1 |
11.9 |
11.9 |
12.6 |
Source: Park Group
The average impact on previously reported PBT over the four-year period was to lower reported PBT by c 3%, which represents the net impact of income deferred in the period less the recognition of income deferred from previous periods. Re-stated deferred income at the end of FY18 was £6.7m, an increase from the originally reported £1.9m, and with an adjustment for tax this was reflected in a restatement of the FY18 net assets from £17.9m to £14.0m. The majority of the deferred income balance is expected to be recognised over a two-year period, although it should be replaced by new deferrals with the amount dependent on the growth of the business, and the product mix.
Exhibit 12: Financial summary
Year end 31 March |
£'000s |
2015 |
2016 |
2017 |
2018 |
2019e |
2020e |
PROFIT & LOSS |
IFRS |
IFRS |
IFRS |
IFRS |
IFRS |
IFRS |
|
Restated |
Restated |
Restated |
Restated |
||||
Consumer billings |
196,796 |
208,352 |
216,771 |
224,542 |
226,129 |
237,436 |
|
Corporate billings |
176,091 |
176,679 |
187,741 |
188,244 |
196,136 |
212,102 |
|
Total Billings |
|
372,887 |
385,031 |
404,512 |
412,786 |
422,266 |
449,537 |
Revenue |
|
85,769 |
100,556 |
119,637 |
111,054 |
114,322 |
119,531 |
Cost of sales |
(59,193) |
(72,030) |
(89,944) |
(79,628) |
(82,031) |
(85,074) |
|
Gross profit |
26,576 |
28,526 |
29,693 |
31,426 |
32,292 |
34,457 |
|
Gross margin as % billings |
7.1% |
7.4% |
7.3% |
7.6% |
7.6% |
7.7% |
|
Distribution costs |
(2,761) |
(2,909) |
(2,940) |
(3,002) |
(2,956) |
(3,147) |
|
Administrative expenses |
(14,914) |
(15,176) |
(16,348) |
(15,702) |
(16,572) |
(17,162) |
|
EBITDA |
|
8,901 |
10,441 |
10,405 |
12,722 |
12,764 |
14,148 |
Depreciation & amortisation |
0 |
0 |
0 |
(1,405) |
(1,428) |
(1,365) |
|
Operating profit |
|
8,901 |
10,441 |
10,405 |
11,317 |
11,336 |
12,783 |
Net Interest |
1,245 |
1,457 |
1,470 |
1,270 |
1,507 |
1,537 |
|
Profit Before Tax |
|
10,146 |
11,898 |
11,875 |
12,587 |
12,843 |
14,320 |
Tax |
(2,284) |
(2,177) |
(2,361) |
(2,398) |
(2,440) |
(2,721) |
|
Profit after tax (IFRS) |
|
7,862 |
9,721 |
9,514 |
10,189 |
10,403 |
11,599 |
Average number of shares (m) |
182.5 |
183.7 |
183.9 |
185.3 |
185.9 |
186.2 |
|
Fully diluted average number of shares (m) |
184.7 |
187.2 |
187.2 |
185.9 |
187.0 |
187.2 |
|
Basic EPS - IFRS (p) |
|
4.3 |
5.3 |
5.2 |
5.5 |
5.6 |
6.2 |
Fully diluted EPS - IFRS (p) |
|
4.3 |
5.2 |
5.1 |
5.5 |
5.6 |
6.2 |
Dividend per share (p) |
2.40 |
2.75 |
2.90 |
3.05 |
3.20 |
3.35 |
|
Pay-out ratio |
55.7% |
52.0% |
56.1% |
55.4% |
57.2% |
53.8% |
|
BALANCE SHEET |
|||||||
Non-current assets |
|
13,932 |
13,749 |
14,399 |
14,868 |
15,071 |
15,071 |
Goodwill |
1,320 |
1,320 |
2,202 |
2,185 |
2,185 |
2,185 |
|
Other intangible assets |
3,168 |
3,036 |
2,682 |
2,278 |
2,158 |
2,158 |
|
Property, plant, & equipment |
8,143 |
8,003 |
7,688 |
7,684 |
7,607 |
7,607 |
|
Retirement benefit asset |
1,293 |
1,390 |
1,827 |
2,721 |
3,121 |
3,121 |
|
Other non-current assets |
8 |
0 |
0 |
0 |
0 |
0 |
|
Current assets |
|
107,095 |
119,496 |
129,322 |
142,423 |
141,033 |
154,382 |
Inventories |
3,186 |
2,182 |
2,632 |
3,808 |
3,882 |
4,133 |
|
Trade & other receivables |
11,309 |
8,860 |
9,236 |
10,917 |
10,557 |
11,238 |
|
Monies held in trust |
65,728 |
75,219 |
83,018 |
86,992 |
90,346 |
97,346 |
|
Cash & equivalents |
26,333 |
32,735 |
34,236 |
40,311 |
34,977 |
40,393 |
|
Other current assets |
539 |
500 |
200 |
395 |
1,271 |
1,271 |
|
Current liabilities |
|
(121,545) |
(128,164) |
(133,789) |
(142,604) |
(136,485) |
(143,937) |
Trade & other payables |
(77,688) |
(83,135) |
(87,201) |
(94,592) |
(89,916) |
(95,524) |
|
Tax payable |
(671) |
(262) |
(424) |
0 |
0 |
0 |
|
Provisions |
(43,186) |
(44,767) |
(46,164) |
(48,012) |
(46,569) |
(48,413) |
|
Non-current liabilities |
|
(2,907) |
(1,881) |
(1,118) |
(662) |
(662) |
(662) |
Deferred tax liability |
(273) |
(181) |
(194) |
(662) |
(662) |
(662) |
|
Retirement benefit obligation |
(2,634) |
(1,700) |
(924) |
0 |
0 |
0 |
|
Net assets |
|
(3,425) |
3,200 |
8,814 |
14,025 |
18,957 |
24,855 |
Minorities |
0 |
0 |
0 |
0 |
0 |
0 |
|
Shareholders' equity |
|
(3,425) |
3,200 |
8,814 |
14,025 |
18,957 |
24,855 |
CASH FLOW |
|||||||
Operating Cash Flow |
14,106 |
12,184 |
9,903 |
10,540 |
9,388 |
13,912 |
|
Net interest |
1,176 |
1,339 |
1,539 |
1,267 |
1,298 |
1,537 |
|
Tax paid |
(2,132) |
(2,490) |
(2,258) |
(2,537) |
(3,516) |
(2,721) |
|
Capex |
(597) |
(1,126) |
(717) |
(1,020) |
(1,167) |
(1,260) |
|
Acquisitions/disposals |
41 |
52 |
(875) |
1 |
0 |
0 |
|
Dividends paid |
(4,198) |
(4,380) |
(5,052) |
(5,370) |
(5,759) |
(6,052) |
|
Other |
0 |
0 |
5 |
0 |
490 |
0 |
|
Net cash flow |
8,396 |
5,579 |
2,545 |
2,881 |
734 |
5,416 |
|
Opening net (debt)/cash |
14,842 |
23,238 |
28,817 |
31,362 |
34,243 |
34,977 |
|
Closing net (debt)/cash |
|
23,238 |
28,817 |
31,362 |
34,243 |
34,977 |
40,393 |
Overdraft |
3,095 |
3,918 |
2,874 |
6,068 |
0 |
0 |
|
Closing net (debt)/cash as per balance sheet |
|
26,333 |
32,735 |
34,236 |
40,311 |
34,977 |
40,393 |
Source: Company accounts, Edison Investment Research
|
|
Research: Metals & Mining
On 13 December, Wheaton Precious Metals (WPM) announced it had reached a ‘principled settlement’ for its tax dispute with the Canada Revenue Agency (CRA). Whereas the CRA had been seeking at least US$265m from WPM in taxes, penalties and interest in relation to its reassessment for the 2005–10 tax years with subsequent years left open to similar re-assessment, under the terms of the settlement WPM will actually pay the CRA cash taxes of US$5m for the 2011–17 tax years, US$15m in deferred tax and US$3–4m in interest. More importantly, the settlement creates a framework for both WPM and the CRA to assess tax in future years whereby foreign income on earnings generated by WPM’s international subsidiaries will not be subject to tax in Canada.