Last close As at 05/08/2026
—
— 0.00 (0.00%)
Market capitalisation
—
Research: Financials
Ahead of results for the year to 31 March 2021 (FY21) due in June, a trading update for Appreciate Group (APP) indicates underlying results in line with market expectations, supported by the continuing positive trend in billings and despite an increase in profit deferral. In this note we provide an update on our forecasts and a detailed review of our fair valuation (60p per share), which looks through the near-term suppression of earnings by the pandemic and the cash flow effects of business mix changes.
Appreciate Group |
FY21 meets consensus as recovery continues |
Trading update |
Financial services |
5 May 2021 |
Share price performance
Business description
Next events
Analyst
Appreciate Group is a research client of Edison Investment Research Limited |
|||||||||||||||||||||||||||||||||||||||||||||
Ahead of results for the year to 31 March 2021 (FY21) due in June, a trading update for Appreciate Group (APP) indicates underlying results in line with market expectations, supported by the continuing positive trend in billings and despite an increase in profit deferral. In this note we provide an update on our forecasts and a detailed review of our fair valuation (60p per share), which looks through the near-term suppression of earnings by the pandemic and the cash flow effects of business mix changes.
Year end |
Billings* |
Revenue |
Adjusted PBT** (£m) |
Adjusted EPS*** (p) |
DPS |
P/E |
Yield |
03/19 |
426.9 |
110.4 |
12.5 |
5.4 |
3.20 |
7.4 |
8.0 |
03/20 |
419.9 |
112.7 |
11.4 |
4.9 |
0.00 |
8.1 |
N/A |
03/21e |
406.5 |
93.9 |
4.5 |
2.3 |
1.20 |
17.6 |
3.0 |
03/22e |
400.6 |
103.4 |
7.2 |
3.1 |
1.50 |
12.8 |
3.8 |
Note: *Billings is a non-statutory measure of sales defined as the face value of voucher sales and the net amount of value loaded on prepaid cards/digital products. **PBT is adjusted for non-recurring & exceptional items. ***Adjusted EPS is fully diluted.
Meeting consensus despite earnings deferral
APP expects FY21 adjusted PBT in line with expectations. This excludes c £3.0m of non-recurring restructuring costs relating to the accelerated repositioning of the business during the pandemic but includes a similar amount of profit deferral due to slower customer redemptions. We have increased our below consensus (£4.2m) FY21 adjusted PBT forecast to £4.5m, with smaller increases in future years including stronger corporate billings sufficient to offset a c 11% decline in the current year Christmas savings order book. Underlying billings increased 5.7% year-on-year in H221 following a 28.8% H121 decline and group billings, including lower Christmas savings billings and the one-off, low-margin free school meals initiative, were £406.5m (FY20: £419.9m). Better margin digital product sales continue to strengthen (+286% y-o-y) with the transition away from paper accelerated by the pandemic (-46% y-o-y).
Positioning for growth despite the pandemic
APP has continued to progress its strategic business plan, aimed at building a more robust and scalable business model capable of capitalising on growth opportunities in the large and fragmented market in which the group operates. The progress made to date, enhancing operating systems and processes, and putting a greater focus on digital products and services, mitigated the pandemic’s effects in FY21, delivered growth in H221, and better positions the group to exploit existing industry trends and deliver sustainable growth. Having disposed of, or withdrawn from, FMI, hamper production, third-party contract packaging and the small operation in the Republic of Ireland, APP is now fully focused on growing its more profitable core business of own branded multi-retailer product.
Valuation: Recovery and growth not discounted
Our modified DCF valuation is unchanged at 60p/share. It implies a calendar year 2021 P/E of c 21x, reasonable in a ‘peer group’ context and in view of the expected post-pandemic recovery and APP’s growth ambitions.
Return to H2 profitability
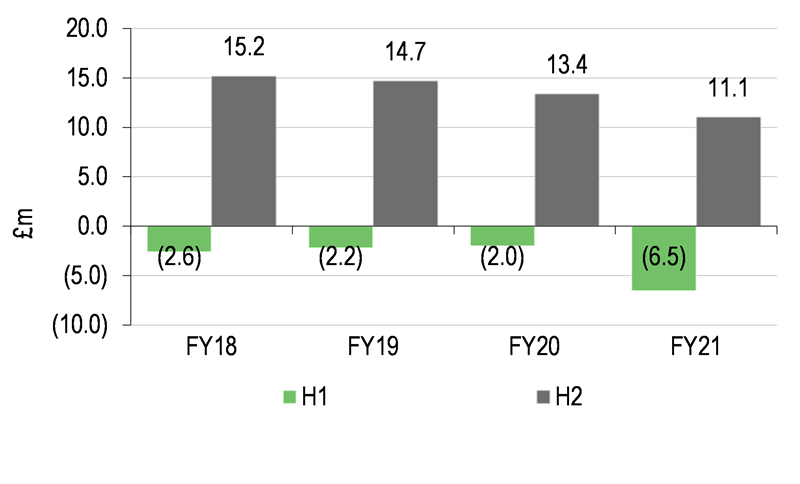
APP’s business is highly seasonal with most billings generated in the second half of the year, including the important Christmas trading period. With costs spread more evenly across the year, H1 is typically loss-making with all profits generated in the second half of the year. There has been a trend towards the softening of the seasonality, driven by the growth in the corporate business (slightly less seasonal than Christmas savings) and faster despatch of Christmas orders (in part made possible by the growth in card and digital product) but this was reversed in FY21 by the pandemic. The H121 loss was magnified by the sharp fall in billings at the beginning of the financial year and, although H221 adjusted PBT remained below H220, the swing from loss to profit in H221 was actually larger than in the previous year.
|
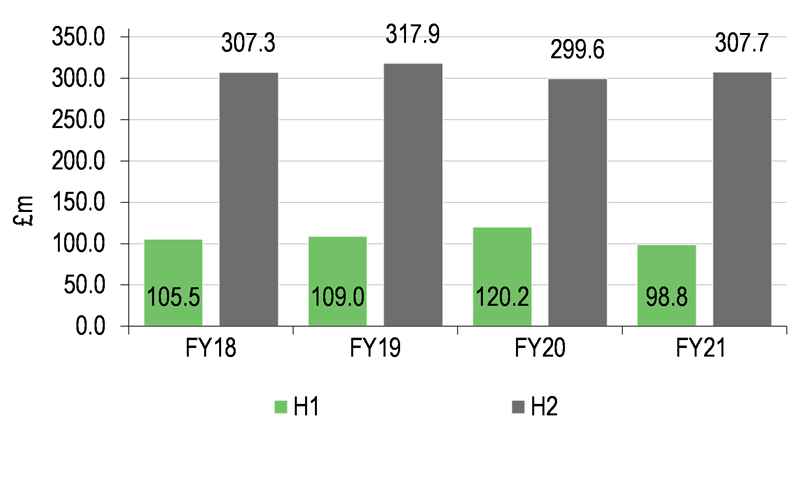
Exhibit 1: H1/H2 total billings trend* |
Exhibit 2: H1/H2 adjusted PBT trend* |
|
|
|
Source: Appreciate Group data. Note: *Total group including free school meals initiative in FY21. |
Source: Appreciate Group data. Note: *Adjusted PBT excludes exceptional and non-recurring items as shown in Exhibit 7. |
|
Exhibit 1: H1/H2 total billings trend* |
|
|
Source: Appreciate Group data. Note: *Total group including free school meals initiative in FY21. |
|
Exhibit 2: H1/H2 adjusted PBT trend* |
|
|
Source: Appreciate Group data. Note: *Adjusted PBT excludes exceptional and non-recurring items as shown in Exhibit 7. |
Billings continued to recover despite the second lockdown
Underlying billings1 fell sharply following the introduction of the first lockdown (down 64% y-o-y in April 2020) but have steadily recovered since. Q3 is the busiest quarter of the year (74% of total annual underlying billings in FY21 and 69% in FY20) and was ahead by c 13%, with December 2020 representing APP’s busiest ever month, with corporate customers seeking ways to reward employees as an alternative to Christmas parties. The post-Christmas Q4 period is typically the quietest quarter of the year (although it was stronger than Q1 during FY21 due to the pandemic); it showed a small (c £4m) year-on-year decline in underlying billings but coming after the strong Q3, and amid the second lockdown, we think the H2 trend versus H1 is a better guide to what we believe is an ongoing recovery in billings, with H221 growth of 5.7% y-o-y.
To provide a clearer picture of trading performance, underlying billings does not include Christmas savings where billings are driven by the timing of order despatch, primarily in the second half of the year.
Exhibit 3: Steady recovery in underlying billings*
Year ending 31 March |
Q1 |
Q2 |
Q3 |
Q4 |
H1 |
H2 |
Corporate and HSV billings (£m) |
||||||
FY21 |
21.0 |
36.9 |
96.3 |
33.3 |
57.9 |
129.6 |
FY20 |
41.5 |
39.8 |
85.1 |
37.5 |
81.3 |
122.6 |
Year-on-year change |
-49.4% |
-7.3% |
13.2% |
-11.2% |
-28.8% |
5.7% |
Source: Appreciate Group data. Note: Underlying billings includes corporate billings and Highstreetvouchers.com (HSV) and excludes the free school meal initiative.
Total H221 group billings of £307.7m (Exhibit 1) include the H221 impact of the free school initiative (c £12.7m following c £10.3m in H121) and excluding this would have been c £5m lower than H220. This primarily reflects the previously reported c 8% decline in Christmas orders for FY21. As we discuss in the financial section of this note, the recovery in underlying billings in FY21 was much stronger than we had expected and provides a stronger base for further growth in FY22. As a result, our FY22 group billings forecast is increased despite APP indicating a c 11% further decline in the Christmas savings order book in the current year (Christmas 2021). This is disappointing as Christmas savings represents a significant share of group billings (we estimate c 46% in FY21) and performance has clearly been held back by the impact of COVID-19 restrictions on face-to-face agent activity. The restricted options for redeeming products during the lockdown may also have had a negative impact on the order book, which has normally been put in place by end-March. APP says that a number of initiatives are underway to accelerate the recruitment of Christmas savings customers, particularly those who come directly to the group, and to improve agent incentivisation.
Repositioning accelerated during the pandemic
Decisive action was taken to adapt to the new environment, with a further acceleration in digitalisation, in step with market developments, mitigating the worst impacts of the pandemic and leaving the group in a better position to capitalise on market recovery and exploit growth opportunities.
Digital billings increased by 286% during FY21 (from £17.7m to £68.4m) with the trend accelerating during the year. Market trends have also supported further progress in the move away from paper vouchers, with FY21 billings down 46%.
Having disposed of, or withdrawn from, FMI, hamper production, third-party contract packaging and the small operation in the Republic of Ireland, APP is now fully focused on growing its more profitable core business of own branded multi-retailer product.
The next stage of the new enterprise resource planning system, the cornerstone of APP’s plans to build a robust and scalable business platform, remains on track to be delivered in the summer of 2021, with the following phase to be delivered in the second half of the year.
Financials
APP expects FY21 adjusted PBT to be within the range of expectations before the statement (£4.1–4.8m) and ahead of our £4.2m forecast, now increased to £4.5m. The billings recovery in FY21, driven by the corporate business, was stronger than we had forecast and, despite the lockdown measures continuing to delay redemptions (‘spending by customers in stores’), the trigger for recognising revenues and profits, the underlying profit indicated by management is also above our forecast. Profits deferred (until redemption) increased to £3m (FY20: c £0.4m). The easing of lockdown restrictions should support the emergence of this profitability, which provides a strong underpinning to future profitability. Although at a more normal rate, some of the profits on the further growth that we expect will likely be deferred into future time periods.
Underlying profits exclude c £3m of non-recurring restructuring costs, including the wind down of hamper production and the Republic of Ireland business. APP expects c £0.6m of this to be classified as exceptional. Our FY21 adjusted PBT forecasts include adjustment for the following items as reported in H121 and our estimate for H221:
Exhibit 4: Edison adjustments to PBT
£m |
H121 |
H221 |
FY21 |
Redundancy costs |
(0.6) |
0.0 |
(0.6) |
Hamper business trading losses |
(0.6) |
(1.4) |
(2.0) |
Impairment of obsolete stock |
(0.4) |
0.0 |
(0.4) |
Gain on disposal |
0.0 |
0.0 |
0.0 |
Total exceptional & non-recurring items |
(1.6) |
(1.4) |
(3.0) |
Source: Appreciate group data, Edison Investment Research
For FY22, our billings forecast for the consumer business is reduced by c 7% (to c £180m) but for corporate it is increased by c 10% (to c £220m). Our forecasts for FY22 and FY23 adjusted PBT are similarly slightly increased.
Our 1.2p FY21 DPS forecast (H121: 0.4p) is covered by forecast adjusted PBT but not by forecast statutory PBT, including exceptional/non-recurring items, of c £1.5m. Having suspended payment of DPS for FY20 due to the pandemic, APP has previously spoken of its ambition to return to a more normal pattern of dividend payments, although it has not yet reviewed the final H221 DPS. We continue to expect significant DPS growth through FY22 and FY23.
Exhibit 5: Forecast changes
Billings (£m) |
Revenues (£m) |
Adjusted PBT (£m)* |
Adjusted EPS (p) |
DPS (p) |
|||||||||||
New |
Old |
Change |
New |
Old |
Change |
New |
Old |
Change |
New |
Old |
Change |
New |
Old |
Change |
|
03/21e |
406.5 |
360.9 |
12.6% |
93.9 |
93.5 |
0.5% |
4.5 |
4.2 |
8.7% |
2.3 |
1.9 |
18.0% |
1.20 |
1.20 |
0.0% |
03/22e |
400.6 |
392.3 |
2.1% |
103.4 |
101.0 |
2.4% |
7.2 |
7.1 |
0.7% |
3.1 |
3.1 |
0.7% |
1.50 |
1.50 |
0.0% |
03/23e |
425.0 |
417.2 |
1.9% |
108.0 |
107.4 |
0.5% |
9.4 |
9.4 |
0.3% |
4.1 |
4.1 |
0.3% |
2.10 |
2.10 |
0.0% |
Source: Edison Investment Research. Note:*Adjusted PBT excludes exceptional and non-recurring items.
Although the planned reduction in billings of paper vouchers accelerated in FY21 due to the pandemic, free cash flow increased due to redemptions falling at a faster pace. At £32.9m, end-FY21 net cash (excluding lease liabilities) was above the end-FY20 level (£29.6m), including a £6.4m benefit from an increased voucher provision balance (see below). As redemption patterns normalise, we expect the voucher provision balance to decline and in the following sections we explain this in more detail, as well as its impact on our valuation of APP shares.
Vouchers distort underlying cash flow
APP has historically been a highly cash-generative business, operating for many years with negative net equity and no debt while funding the growth of the business through ‘negative working capital’. With the strategic acceleration into digital products, this is changing, better positioning APP in the faster, more profitable segments of the market, and better aligning it with customer trends and preferences. Assuming normal redemption patterns, we forecast this product shift to reduce near-term operational cash flow as the balance sheet adjusts – not because card/digital products consume cash to any significant extent but because the lower-margin voucher products are cash generative so long as sales are rising and cash negative when sales are falling. We think that this transformation is much more likely to maximise the creation of shareholder value over time and that to properly assess this potential value creation it is important to understand the near-term distortions to underlying cash flow.
Voucher run-off depresses near-term reported cash flow
Historically strong group cash flow significantly reflected the ‘float’ of cash available to the company resulting from previously growing sales of multi-retailer vouchers and the timing difference between the billing of those vouchers and their redemption (‘spending in the shops’) by customers. Vouchers are an ‘unregulated product’ (unlike card and digital products regulated by the Bank of England as emoney) and although the customer cash is segregated, it transfers to the company, becoming ‘free cash’, at the point of billing (when the vouchers are despatched). While some of this cash, representing the profit margin, remains with the company, most of it is ultimately paid to APP’s retail partners in lieu of the redeemed vouchers. However, this process may take many months and meanwhile the cash is available to APP. There is no distortion of profits as the cash that is expected to be paid away is matched by a provision in the balance sheet. The FY21 increase in the voucher provision reflects the additional cash that is expected to be paid out once redemption patterns normalise. At the group level, our forecast free cash balance declines in FY22 and FY23 because we expect the voucher provision balance to reduce. We also believe that it is important to fully understand the distorting, negative effect of the shift from paper vouchers to digital/card product, so that an appropriate value may be placed on the underlying strength of cash flows. Our DCF valuation discussed in the following section is based on underlying cash flows and fully excludes the cash, and the cash flow, represented by the voucher provision balance and changes in it.
Valuation
Based on the return to more normal trading conditions reflected in our near-term forecasts and longer-term growth prospects, enhanced by the strategic refocusing on card and digital products, the drivers of industry growth, we continue to see significant value in APP shares. Although the share price discount to our fair value of 60p has narrowed in recent months, it is still more than 30%. Evidence of continued improvement in trading, as the economy begins to open and is enhanced by the business transformation programme, should act as a catalyst to closing the gap further.
DCF valuation supported by ‘peer’ comparison
A satisfactory direct valuation comparison of APP with quoted competitors is not possible. There are no direct quoted comparators for the Christmas savings business, and competitor employee benefits and service providers are either private companies or relatively small parts of larger groups, complicating any attempt at a relative valuation approach. In incentive and rewards products, Sodexo and Edenred are both much larger and more international, and the overlap between APP and Sodexo is limited (Sodexo Benefits and Rewards Services is only a minor part of Sodexo Group). We nevertheless include these in our quoted comparator group along with a selection of prepaid card and payments service providers (Euronet Worldwide, FleetCor Technologies, Green Dot Corp and EML Payments).
Our DCF value is unchanged at 60p with the effect of slightly lower FY21 reported earnings (including the impact of one-off items) and underlying cash flow (ie excluding movement in the voucher provision balance) offset by the unwinding of the discount rate. The DCF valuation of 60p implies a ‘target’ P/E multiple of c 21x for both calendar year 2020 and 2021 (CY20 and CY21) adjusted EPS and c 15x CY22. Although relatively high due to near-term earnings pressures, we believe these multiples are reasonable in the context of the comparator stocks, despite the comparatively low market capitalisation and implied lower liquidity.
Exhibit 6: Peer comparison
|
Share price (local) |
Market cap (£m) |
P/E (x) |
P/E (x) |
EV/EBITDA (x) CY20 |
EV/EBITDA (x) CY21 |
Dividend yield (%) |
Incentive |
|
|
|
|
|
|
|
Edenred |
46 |
9,853 |
42.4 |
36.7 |
21.8 |
19.6 |
1.7 |
Sodexo |
84 |
10,584 |
46.9 |
30.6 |
16.2 |
13.6 |
0.0 |
Incentive average |
|
|
44.7 |
33.7 |
19.0 |
16.6 |
0.8 |
FleetCor Technologies |
293 |
17,584 |
26.4 |
23.4 |
21.8 |
18.5 |
N/A |
Green Dot Corp |
45 |
1,760 |
22.4 |
21.1 |
18.4 |
17.1 |
N/A |
EML Payments |
6 |
1,130 |
66.8 |
51.4 |
26.4 |
17.3 |
N/A |
Euronet Worldwide |
142 |
5,393 |
57.3 |
N/A |
28.2 |
16.8 |
N/A |
Prepaid card and payment services average |
|
|
43.3 |
32.0 |
23.7 |
17.4 |
N/A |
Total group average |
|
|
43.7 |
32.6 |
22.2 |
17.2 |
0.8 |
Appreciate Group |
40 |
75 |
13.7 |
13.9 |
10.2 |
9.2 |
3.0 |
Source: Refinitiv, Edison Investment Research estimates for Appreciate Group. Note: Earnings data on a calendar year basis, using adjusted EPS. Appreciate’s enterprise value (EV) excludes voucher provision balance from cash. Prices at 5 May 2021.
DCF value unchanged at 60p
Our modified DCF valuation differs from a standard DCF in that we include the interest earned on segregated customer cash balances (but not on group cash balances), recognising this is an integral part of the returns the company generates (although the contribution is greatly reduced at current low interest rates). The customer cash itself is excluded from the overall valuation and we also exclude the voucher provisions balance, as this will eventually flow out in settlement of vouchers that have been issued but not yet redeemed. Our key assumptions have been held constant for an extended period, including an assumed 10% discount rate and 10x terminal multiple. Beyond the forecast period (to end-FY23), we use a two-stage growth assumption to allow for the potential medium-term benefits of the strategic business plan investment. For the first two years beyond the forecast period (years four and five), we assume 10% growth in underlying free cash flows, followed by a reversion to a long-term growth rate of 5% up until year 10. We continue to assume an eventual ‘normalisation’ in interest rates and assume a stepped increase in market deposit rates to 1.5% in FY24 and 3% from FY25 and, as noted above, we deduct upfront from the DCF valuation the amount of voucher provisions (an estimated £36.6m at end-FY21) on the basis that the matching cash is only temporarily available to the group, albeit on a revolving basis. As a result of this methodology, the DCF value is not enhanced by the current voucher provision balance, nor does the expected future decline in the voucher provision balance have any impact.
Exhibit 7: Financial summary
Year end 31 March (£m) |
2015 |
2016 |
2017 |
2018 |
2019 |
2020 |
2021e |
2022e |
2023e |
PROFIT & LOSS |
|||||||||
Consumer billings |
196.8 |
208.4 |
216.8 |
232.6 |
232.1 |
222.2 |
199.4 |
179.7 |
182.1 |
Corporate billings |
176.1 |
176.7 |
187.7 |
180.2 |
194.8 |
197.7 |
207.1 |
220.9 |
243.0 |
Total Billings |
372.9 |
385.0 |
404.5 |
412.8 |
426.9 |
419.9 |
406.5 |
400.6 |
425.0 |
Revenue |
85.8 |
100.6 |
119.6 |
111.1 |
110.4 |
112.7 |
93.9 |
103.4 |
108.0 |
Cost of sales |
(59.2) |
(72.0) |
(89.9) |
(79.6) |
(79.1) |
(79.8) |
(68.6) |
(74.5) |
(76.6) |
Gross profit |
26.6 |
28.5 |
29.7 |
31.4 |
31.3 |
32.9 |
25.4 |
29.0 |
31.3 |
Gross margin as % billings |
7.1% |
7.4% |
7.3% |
7.6% |
7.3% |
7.8% |
6.2% |
7.2% |
7.4% |
Distribution costs |
(2.8) |
(2.9) |
(2.9) |
(3.0) |
(2.9) |
(2.8) |
(2.1) |
(1.8) |
(1.7) |
Administrative expenses excluding depreciation & amortisation |
(14.9) |
(15.2) |
(14.9) |
(15.7) |
(16.0) |
(18.4) |
(18.9) |
(18.0) |
(18.2) |
Add back non-recurring items within EBITDA |
0.0 |
0.0 |
0.0 |
0.0 |
0.0 |
0.0 |
2.0 |
0.0 |
0.0 |
Adjusted EBITDA |
8.9 |
10.4 |
11.8 |
12.7 |
12.3 |
11.7 |
6.4 |
9.2 |
11.5 |
Depreciation & amortisation |
0.0 |
0.0 |
(1.4) |
(1.4) |
(1.4) |
(1.7) |
(2.1) |
(2.4) |
(2.4) |
Exceptional items |
0.0 |
0.0 |
0.0 |
0.0 |
(1.2) |
(3.7) |
(0.6) |
0.0 |
0.0 |
Non-recurring items |
0.0 |
0.0 |
0.0 |
0.0 |
0.0 |
0.0 |
(2.4) |
0.0 |
0.0 |
Operating profit |
8.9 |
10.4 |
10.4 |
11.3 |
9.7 |
6.4 |
1.2 |
6.9 |
9.1 |
Net Interest |
1.2 |
1.5 |
1.5 |
1.3 |
1.6 |
1.3 |
0.2 |
0.3 |
0.3 |
Profit before tax |
10.1 |
11.9 |
11.9 |
12.6 |
11.3 |
7.7 |
1.5 |
7.2 |
9.4 |
Adjust for: |
|||||||||
Exceptional items |
0.0 |
0.0 |
0.0 |
0.0 |
1.2 |
3.7 |
0.6 |
0.0 |
0.0 |
Other non-recurring items |
0.0 |
0.0 |
0.0 |
0.0 |
0.0 |
0.0 |
2.4 |
0.0 |
0.0 |
Adjusted Profit Before Tax |
10.1 |
11.9 |
11.9 |
12.6 |
12.5 |
11.4 |
4.5 |
7.2 |
9.4 |
Tax |
(2.3) |
(2.2) |
(2.4) |
(2.4) |
(2.4) |
(2.2) |
(0.3) |
(1.4) |
(1.8) |
Profit after tax (IFRS) |
7.9 |
9.7 |
9.5 |
10.2 |
8.9 |
5.5 |
1.2 |
5.8 |
7.6 |
Adjusted profit after tax |
7.9 |
9.7 |
9.5 |
10.2 |
10.1 |
9.2 |
4.2 |
5.8 |
7.6 |
Average number of shares (m) |
182.5 |
183.7 |
183.9 |
185.3 |
186.0 |
186.3 |
186.3 |
186.3 |
186.3 |
Fully diluted average number of shares (m) |
184.7 |
187.2 |
187.2 |
185.9 |
186.1 |
186.3 |
186.3 |
186.3 |
186.3 |
Basic EPS - IFRS (p) |
4.3 |
5.3 |
5.2 |
5.5 |
4.8 |
3.0 |
0.6 |
3.1 |
4.1 |
Fully diluted EPS - IFRS (p) |
4.3 |
5.2 |
5.1 |
5.5 |
4.8 |
3.0 |
0.6 |
3.1 |
4.1 |
Adjusted EPS (excludes exceptional/nonrecurring items) |
4.3 |
5.2 |
5.1 |
5.5 |
5.4 |
4.9 |
2.3 |
3.1 |
4.1 |
Dividend per share (p) |
2.40 |
2.75 |
2.90 |
3.05 |
3.20 |
0.00 |
1.20 |
1.50 |
2.10 |
Payout ratio (adjusted earnings) |
56.4% |
53.0% |
57.1% |
55.5% |
59.0% |
0.0% |
52.7% |
48.2% |
51.2% |
BALANCE SHEET |
|||||||||
Non-current assets |
13.9 |
13.7 |
14.4 |
14.9 |
12.6 |
16.2 |
19.0 |
19.9 |
20.9 |
Goodwill |
1.3 |
1.3 |
2.2 |
2.2 |
2.2 |
0.8 |
0.8 |
0.8 |
0.8 |
Other intangible assets |
3.2 |
3.0 |
2.7 |
2.3 |
2.3 |
4.8 |
7.0 |
7.8 |
8.5 |
Property, plant, & equipment |
8.1 |
8.0 |
7.7 |
7.7 |
6.2 |
2.7 |
2.9 |
3.1 |
3.3 |
Retirement benefit asset |
1.3 |
1.4 |
1.8 |
2.7 |
1.9 |
4.2 |
4.2 |
4.2 |
4.2 |
Other non-current assets |
0.0 |
0.0 |
0.0 |
0.0 |
0.0 |
3.8 |
4.0 |
4.0 |
4.0 |
Current assets |
107.1 |
119.5 |
129.3 |
142.4 |
153.5 |
148.0 |
157.9 |
140.6 |
148.4 |
Inventories |
31.9 |
21.8 |
26.3 |
38.1 |
45.7 |
2.8 |
2.0 |
2.5 |
25.0 |
Trade & other receivables |
11.3 |
8.9 |
9.2 |
10.9 |
12.6 |
9.5 |
12.5 |
10.0 |
10.6 |
Monies held in trust |
65.7 |
75.2 |
83.0 |
87.0 |
99.3 |
102.7 |
108.7 |
107.6 |
116.2 |
Cash & equivalents |
26.3 |
32.7 |
34.2 |
40.3 |
36.9 |
29.6 |
32.9 |
18.7 |
17.2 |
Other current assets |
(28.1) |
(19.1) |
(23.5) |
(33.9) |
(41.0) |
3.4 |
1.8 |
1.8 |
(20.7) |
Current liabilities |
(121.5) |
(128.2) |
(133.8) |
(142.6) |
(148.8) |
(140.7) |
(152.0) |
(132.1) |
(135.6) |
Trade & other payables |
(776.9) |
(831.4) |
(872.0) |
(945.9) |
(611.9) |
(57.2) |
(56.5) |
(56.1) |
(60.4) |
Tax payable |
(0.7) |
(0.3) |
(0.4) |
0.0 |
(0.6) |
0.0 |
0.0 |
0.0 |
0.0 |
Provisions |
(43.2) |
(44.8) |
(46.2) |
(48.0) |
(58.3) |
(53.8) |
(65.7) |
(47.9) |
(46.2) |
Non-current liabilities |
(2.9) |
(1.9) |
(1.1) |
(0.7) |
(0.6) |
(5.3) |
(5.5) |
(5.5) |
(5.5) |
Deferred tax liability |
(.3) |
(.2) |
(.2) |
(.7) |
(.6) |
(1.1) |
(1.0) |
(1.0) |
(1.0) |
Retirement benefit obligation |
(2.6) |
(1.7) |
(.9) |
0.0 |
0.0 |
0.0 |
0.0 |
0.0 |
0.0 |
Lease liabilities |
0.0 |
0.0 |
0.0 |
0.0 |
0.0 |
(4.1) |
(4.4) |
(4.4) |
(4.4) |
Net assets |
(3.4) |
3.2 |
8.8 |
14.0 |
16.7 |
18.3 |
19.5 |
23.0 |
28.2 |
CASH FLOW |
|||||||||
Operating Cash Flow |
14.1 |
12.2 |
9.6 |
10.5 |
6.9 |
6.9 |
6.5 |
(7.6) |
5.6 |
Net interest |
1.2 |
1.3 |
1.5 |
1.3 |
1.5 |
1.6 |
0.3 |
0.3 |
0.3 |
Tax paid |
(2.1) |
(2.5) |
(2.3) |
(2.5) |
(1.6) |
(2.9) |
(1.9) |
(1.4) |
(1.8) |
Capex |
(0.6) |
(1.1) |
(0.7) |
(1.0) |
(1.2) |
(5.0) |
(4.6) |
(3.3) |
(3.3) |
Acquisitions/disposals |
0.0 |
0.1 |
(0.9) |
0.0 |
0.0 |
0.0 |
3.0 |
0.0 |
0.0 |
Dividends paid |
(4.2) |
(4.4) |
(5.1) |
(5.4) |
(5.7) |
(6.0) |
0.0 |
(2.2) |
(2.4) |
Other |
0.0 |
0.0 |
0.3 |
0.0 |
0.3 |
0.4 |
(0.1) |
0.0 |
0.0 |
Net cash flow |
8.4 |
5.6 |
2.5 |
2.9 |
0.3 |
(4.9) |
3.3 |
(14.2) |
(1.5) |
Opening net (debt)/cash |
14.8 |
23.2 |
28.8 |
31.4 |
34.2 |
34.6 |
29.6 |
32.9 |
18.7 |
Closing net (debt)/cash |
23.2 |
28.8 |
31.4 |
34.2 |
34.6 |
29.6 |
32.9 |
18.7 |
17.2 |
Overdraft |
3.1 |
3.9 |
2.9 |
6.1 |
2.3 |
0.0 |
0.0 |
0.0 |
0.0 |
Closing net (debt)/cash as per balance sheet |
26.3 |
32.7 |
34.2 |
40.3 |
36.9 |
29.6 |
32.9 |
18.7 |
17.2 |
Source: Appreciate Group historical data, Edison Investment Research forecasts
|
|
Research: Investment Companies
Baillie Gifford China Growth (BGCG) is a recent entrant to Ballie Gifford’s (BG) house philosophy of investing alongside current trendsetters and future large-scale potential winners. It emerged in September 2020 as BG took over management of the trust, changing the strategy from broader Asia Pacific equities to a mandate of pure Chinese equities (see our initiation note on BGCG). Despite negative newsflow on China over the past few months clouding last year’s euphoria around investing in Chinese equities, the investment case stands firm. Amid heightened risks, for the time being China appears to welcome foreign investors, as it remains in expansion mode within the global financial markets.