Last close As at 05/08/2026
EUR13.29
▲ −0.16 (−1.15%)
Market capitalisation
EUR10,848m
Research: Consumer
OPAP’s FY18 results were in line with our forecasts, with gross gaming revenue (GGR) growth of 6.3% to €1.55bn and a 22.9% EBITDA margin. The recently installed video lottery terminals (VLTs) contributed €208.7m to GGR (vs €57.6m in FY17) and new Kino features led to a strong Q418 within the core Lottery division. OPAP’s investment phase is nearing completion, cost containment is in place and the business model is highly cash generative. The €0.70 FY18 dividend was over 100% of free cash flow and notably higher than our 90% estimate. This was an encouraging set of results and our core OPAP forecasts are broadly unchanged. OPAP trades at 14.6x P/E and 8.2x EV/EBITDA, with an 8.4% dividend yield for FY19e.
OPAP |
A record quarter; continued high dividends |
FY18 results |
Travel & leisure |
29 March 2019 |
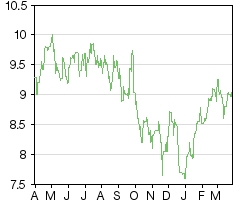
Share price performance
Business description
Next events
Analysts
OPAP is a research client of Edison Investment Research Limited |
|||||||||||||||||||||||||||||||||||||||||||||||
OPAP’s FY18 results were in line with our forecasts, with gross gaming revenue (GGR) growth of 6.3% to €1.55bn and a 22.9% EBITDA margin. The recently installed video lottery terminals (VLTs) contributed €208.7m to GGR (vs €57.6m in FY17) and new Kino features led to a strong Q418 within the core Lottery division. OPAP’s investment phase is nearing completion, cost containment is in place and the business model is highly cash generative. The €0.70 FY18 dividend was over 100% of free cash flow and notably higher than our 90% estimate. This was an encouraging set of results and our core OPAP forecasts are broadly unchanged. OPAP trades at 14.6x P/E and 8.2x EV/EBITDA, with an 8.4% dividend yield for FY19e.
Year end |
GGR |
PBT* |
EPS* |
DPS |
P/E |
Yield |
12/17 |
1,455.5 |
197.5 |
0.42 |
1.10 |
21.3 |
12.2 |
12/18 |
1,547.0 |
234.9 |
0.52 |
0.70 |
17.4 |
7.8 |
12/19e |
1,704.2 |
283.2 |
0.62 |
0.75 |
14.6 |
8.4 |
12/20e |
1,867.2 |
324.2 |
0.70 |
0.86 |
12.9 |
9.6 |
Note: *PBT and EPS are normalised, excluding amortisation of acquired intangibles, exceptional items and share-based payments.
VLTs drive revenues, core lottery up 3.7% in Q418
FY18 GGR increased by 6.3% to €1,547.0m and EBITDA was €353.6m, (vs our estimates of €1,557.6m and €350.9m). Growth was driven by a 263% increase in VLT GGR, which was partially offset by a 4% decline in Betting and a 5% decline in the core Lottery business. Importantly Q418 showed a 3.7% uptick in Lottery, largely due to better Joker revenues and new Kino side features. We expect 10% GGR growth in FY19, with stable Lottery GGR, boosted by a 45% increase in VLT GGR, as well as a six-month contribution from Stoiximan. Please see our initiation report for a full discussion of these divisions.
Paying out the bulk of free cash flow as dividends
OPAP reported FY18 net debt of €459.0m vs €436.2m in FY17. This includes the first €50m payment for a stake in Stoiximan (online gaming) and equates to 1.3x net debt/EBITDA, which is comfortably within the company’s long-term targets. OPAP has historically paid the bulk (or more) of free cash flow (FCF) as dividends and the FY18 total dividend of €0.7 per share is over 100% of FCF. This compares to our more conservative forecast of a 90% payout ratio for FY19 and FY20. Our core OPAP forecasts remain broadly unchanged.
Valuation: 8.4% FY19e dividend yield
OPAP’s shares trade at 14.6x P/E and 8.2x EV/EBITDA for FY19e, which is towards the top of the peer group, but its 8.4% FY19e dividend yield is very attractive. Our DCF remains unchanged at €10.0/share (16.2x FY19 P/E), with the €1.8bn pre-paid tax asset potentially worth an additional €2/share. Top-line growth has historically been linked to Greek GDP and further upside could come from faster than expected GDP growth (the IMF projects 2.4% in 2019).
A stable core business, with high cash flow
Results summary
Gross gaming revenues: Increased by 6.3%, driven by 263% growth in VLTs
FY18 GGR increased 6.3% to €1,547.0m vs our estimate of €1,557.6m, with GGR in Q418 up by 7.6% to €440.7m. For the full year, weakness in traditional games (Lottery, Betting, Scratch) was more than offset by the growth in new products such as VLTs. Importantly, the core Lottery business returned to 3.7% growth in Q418, due to the Joker jackpot and a positive contribution from new Kino features.
Strengthening the network with new, larger stores
During FY18, the number of OPAP stores in Greece declined from 4,367 to 3,910, with 505 new stores constructed during the year, partially offsetting store closures that resulted from renegotiations with agents. Overall, the average store size increased by 20% and average agent commissions grew by 5.4% in FY18.
EBITDA and EPS: Cost containment in place, in line with estimates
EBITDA increased from €306.5m in FY17 to €353.6m in FY18 and was in line with our estimate of €350.9m, with improvement driven by effective cost containment measures. We note that the technology transformation is now complete and headcount is approaching target levels, suggesting stable fixed costs going forward (excluding the impact of consolidating Stoiximan from H219). Adjusted EPS of €0.52 was also in line with our forecast and excludes a one-off €17.5m goodwill impairment of Neurosoft.
Dividends: Paying out the ‘bulk’ of free cash flow
OPAP’s dividend policy is to pay out the ‘bulk’ of FCF as dividends and the company has announced a final dividend of €0.6 per share, bringing the total to €0.70 for FY18. This equates to over 100% of FY18 FCF and compares to our estimate of a 90% payout.
Forecasts: Core OPAP broadly unchanged
Management has stated that it is well placed to deliver another positive year in FY19 and we are leaving our core OPAP forecasts broadly unchanged. Note that we have lowered our Stoiximan revenue forecasts after further conversations with management, which has the impact of reducing headline revenues by 2.5% in FY19 and 3.9% in FY20. Within the core OPAP revenue mix, a slightly lower Betting forecast is offset by stability in Instants and Passives as well as in the core Lottery business. As we discuss in our initiation report, our forecasts assume that the Stoiximan acquisition (which is still pending regulatory approval) is fully consolidated from H219 onwards. We note that the Stoiximan forecasts are clearly subject to change depending on completion date.
Exhibit 1: Estimate changes
Revenue (GGR) (€m) |
EBITDA (€m) |
Adjusted EPS (€) |
|||||||
Old |
New |
% chg. |
Old |
New |
% chg. |
Old |
New |
% chg. |
|
2018 |
1,557.6 |
1,547.0 |
(0.7) |
350.9 |
353.6 |
(0.8) |
0.52 |
0.52 |
0.0 |
2019e |
1,748.5 |
1,704.2 |
(2.5) |
407.8 |
407.8 |
0.0 |
0.63 |
0.62 |
(1.5) |
2020e |
1,944.5 |
1,867.2 |
(3.9) |
459.8 |
451.6 |
(1.8) |
0.73 |
0.70 |
(4.1) |
Source: OPAP accounts, Edison Investment Research. Note: For 2018 ‘old’ figures are Edison estimates and ‘new’ actual.
Lottery (50.4% of GGR): 3.7% increase in Q418
Lottery GGR decreased by 4.7% to €779.9m in FY18 (vs our estimate of €785.3m). The decline is largely due to VLT substitution as well as the negative impact of shop closures. But encouragingly, Q418 increased by 3.7%, which was due to a favourable Joker jackpot, as well as a positive impact from the new Kino features introduced in the quarter.
Looking ahead, the introduction of online products (Joker was launched in March 2019, Lotto should follow later in FY19, and Kino is subject to regulatory approval) should help to mitigate the retail decline and we forecast broadly stable revenues in this division in FY19 and FY20.
Betting (26.3% of GGR): 11.4% decline in Q418
Betting GGR declined by 3.5% to €406.2m in FY18 (vs our €429.5m estimate), with an 11.4% decline in Q4, as a result of tough year-on-year comparisons and a maturing Virtuals business. OPAP has taken a number of measures to stabilise this division, with results expected to materialise in FY19. These include the recent relaunch of the online business as well as an increased number of self-service betting terminals (SSBTs) installed (5,370 at YE18). Management has stated that Q119 has shown positive trends, including strong margins in February. Nonetheless, there are no major competitions in 2019 and we therefore forecast a 3% revenue decline in FY19, returning to 5% growth in FY20, as the online offering begins to gain traction.
Instant & Passives (9.8% of GGR): Bouncing back in Q418
FY18 GGR in this division declined by 4.2% to €152.2m (due to weakness in Scratch) but this was encouragingly above our estimate of €141.4m, due to a 1% improvement in Q418 (after positive Christmas Scratch promotions). The company has announced some product innovations, which have helped stabilise revenues, and we forecast broadly flat GGR for FY19 and FY20.
VLTs (13.5% of GGR): On track for 25,000 machines in 2019
At FY18, OPAP operated 18,944 VLTs in 351 Play Gaming Halls and 1,915 agencies and the company has stated that it is on track to install all 25,000 VLTs by the end of FY19. The dedicated gaming halls currently contribute approximately two-thirds of VLT GGR. New initiatives include the launch of a VLT jackpot in Q219, which management hopes will counteract the ongoing competition from the illegal market.
VLT GGR increased from €57.6m in FY17 to €208.7m in FY18 (vs our €201.4m estimate). Over the course of 2018, GGR/VLT/day has been declining with the addition of new machines, although Q418 GGR/VLT/day of €47 was sequentially higher than Q318 (partly seasonal). For FY18 as a whole, GGR/VLT/day was €41, which we forecast will remain stable in the near term. Overall we continue to expect strong GGR growth (45% growth in FY19 and 15% in FY20).
Cash flow and balance sheet
The business model is very cash generative, given the franchise model, the limited working capital risk and the fact that all licence payments have been made.
■
Capex: the 2017–19 investment programme (technology, slot machines, SSBTs) is coming to an end. FY18 capex of €51.9m compares to a peak of €75m (excluding licence payments) in FY17 and management has guided to capex of c €30m in FY19 and €15-25m in FY20.
■
Net debt: FY18 net debt of €459.0m was lower than our estimate of €473.0m, largely due to a lower than forecast cash income tax payment. This equates to 1.3x net debt/EBITDA and 15.1x interest cover – comfortably within the company’s long-term targets. For FY19, our forecasts include an additional €100m debt for the Stoiximan acquisition (after a €48m net payment in December 2018) and, assuming no special dividends, the net debt level goes to €510.2m in FY19.
■
Dividend: management has committed to return the majority of free cash flow to shareholders and has announced a final dividend of €0.60, bringing the total to €0.70, which equates to over 100% of FCF (vs our 90% assumption). We conservatively continue to forecast a 90% payout, which equates to €0.75/share in FY19. Note that although OPAP has historically distributed special dividends, we have not assumed any further specials in our forecasts.
Exhibit 2: Divisional summary
2014 |
2015 |
2016 |
2017 |
2018 |
2019e |
2020e |
|
Lotteries |
817.3 |
829.9 |
841.3 |
818.0 |
779.9 |
795.5 |
803.5 |
Sports Betting |
456.3 |
411.9 |
397.2 |
421.1 |
406.2 |
394.1 |
413.8 |
Instant and Passives |
104.1 |
157.9 |
159.1 |
158.9 |
152.2 |
152.1 |
152.0 |
VLTS |
0.0 |
0.0 |
0.0 |
57.6 |
208.7 |
302.6 |
347.9 |
Stoiximan |
0.0 |
0.0 |
0.0 |
0.0 |
0.0 |
60.0 |
150.0 |
Gross Gaming Revenues |
1,377.7 |
1,399.7 |
1,397.6 |
1,455.5 |
1,547.0 |
1,704.2 |
1,867.2 |
GGR Contribution and other levies |
(404.5) |
(412.0) |
(466.7) |
(482.6) |
(507.1) |
(553.9) |
(609.8) |
% GGR |
-29% |
-29% |
-33% |
-33% |
-33% |
-33% |
-33% |
NGR |
973.1 |
987.7 |
930.8 |
972.9 |
1,039.9 |
1,150.3 |
1,257.4 |
Agents Commission |
(359.7) |
(362.4) |
(358.4) |
(369.9) |
(381.1) |
(403.8) |
(420.3) |
% of NGR |
-37% |
-37% |
-39% |
-38% |
-37% |
-35% |
-33% |
Other NGR related commission |
0.0 |
0.0 |
(26.3) |
(38.3) |
(53.0) |
(65.4) |
(71.8) |
% of NGR |
0% |
0% |
-3% |
-4% |
-5% |
-6% |
-6% |
Lottery |
375.3 |
380.7 |
345.7 |
337.7 |
330.3 |
337.6 |
341.8 |
Sports Betting |
193.3 |
176.5 |
147.1 |
155.2 |
159.2 |
157.1 |
165.2 |
Instant and Passives |
46.7 |
69.5 |
54.7 |
54.8 |
51.5 |
51.4 |
51.6 |
VLTs |
0.0 |
0.0 |
0.0 |
18.4 |
66.2 |
97.4 |
112.0 |
Other |
(1.8) |
(1.4) |
(1.4) |
(1.4) |
(1.4) |
(1.4) |
(1.4) |
Stoiximan |
0.0 |
0.0 |
0.0 |
0.0 |
0.0 |
39.0 |
96.0 |
Gross profit from gaming operations |
613.5 |
625.3 |
546.2 |
564.7 |
605.9 |
681.2 |
765.3 |
Total gross profit |
613.5 |
625.3 |
570.1 |
592.6 |
642.7 |
719.8 |
805.8 |
Payroll |
(58.6) |
(46.1) |
(56.2) |
(63.8) |
(76.1) |
(79.9) |
(91.8) |
% NGR |
-6% |
-5% |
-6% |
-7% |
-7% |
-7% |
-7% |
Marketing |
(78.9) |
(69.5) |
(65.9) |
(67.4) |
(65.8) |
(79.0) |
(90.9) |
% of NGR |
-8% |
-7% |
-7% |
-7% |
-6% |
-7% |
-7% |
Other operating expenses |
(129.5) |
(132.7) |
(140.4) |
(155.0) |
(147.2) |
(153.1) |
(171.5) |
% NGR |
-13% |
-13% |
-15% |
-16% |
-14% |
-13% |
-14% |
EBITDA |
346.5 |
377.1 |
307.5 |
306.5 |
353.6 |
407.8 |
451.6 |
EBITDA margin |
25% |
27% |
22% |
21% |
23% |
24% |
24% |
Source: OPAP, Edison Investment Research
Exhibit 3: Financial summary
€m |
2014 |
2015 |
2016 |
2017 |
2018 |
2019e |
2020e |
||
31-December |
ISA |
ISA |
ISA |
ISA |
ISA |
ISA |
ISA |
||
INCOME STATEMENT |
|||||||||
GGR |
|
|
1,377.7 |
1,399.7 |
1,397.6 |
1,455.5 |
1,547.0 |
1,704.2 |
1,867.2 |
NGR |
|
|
973.1 |
987.7 |
930.8 |
972.9 |
1,039.9 |
1,150.3 |
1,257.4 |
Cost of Sales |
(764.2) |
(774.3) |
(827.5) |
(862.9) |
(904.3) |
(984.5) |
(1,061.4) |
||
Gross Profit |
613.5 |
625.3 |
570.1 |
592.6 |
642.7 |
719.8 |
805.8 |
||
EBITDA |
|
|
346.5 |
377.1 |
307.5 |
306.5 |
353.6 |
407.8 |
451.6 |
Normalised operating profit |
|
|
289.6 |
318.1 |
252.4 |
218.8 |
258.4 |
304.9 |
347.0 |
Impairments |
7.5 |
(14.1) |
0.0 |
(2.7) |
(17.5) |
0.0 |
0.0 |
||
Exceptionals |
0.0 |
0.0 |
0.0 |
0.0 |
0.0 |
0.0 |
0.0 |
||
Share-based payments |
(0.9) |
(1.2) |
(3.1) |
(1.5) |
(1.6) |
(1.6) |
(1.6) |
||
Reported operating profit |
296.2 |
302.8 |
249.3 |
214.6 |
239.3 |
303.3 |
345.5 |
||
Net Interest |
1.6 |
(4.7) |
(13.3) |
(21.1) |
(23.5) |
(21.7) |
(22.8) |
||
Joint ventures & associates (post tax) |
0.0 |
0.0 |
0.0 |
0.0 |
0.0 |
0.0 |
0.0 |
||
Other |
7.8 |
1.5 |
1.0 |
(0.3) |
0.0 |
0.0 |
0.0 |
||
Profit Before Tax (norm) |
|
|
299.0 |
314.9 |
240.0 |
197.5 |
234.9 |
283.2 |
324.2 |
Profit Before Tax (reported) |
|
|
305.6 |
299.6 |
236.9 |
193.2 |
215.9 |
281.7 |
322.7 |
Reported tax |
(106.4) |
(89.7) |
(64.1) |
(61.6) |
(70.6) |
(81.7) |
(93.6) |
||
Profit After Tax (norm) |
212.3 |
223.6 |
170.4 |
140.2 |
166.8 |
201.1 |
230.2 |
||
Profit After Tax (reported) |
199.2 |
209.9 |
172.9 |
131.6 |
145.3 |
200.0 |
229.1 |
||
Minority interests |
(4.2) |
0.8 |
(2.6) |
(5.4) |
(2.0) |
(4.8) |
(7.3) |
||
Discontinued operations |
0.0 |
0.0 |
0.0 |
0.0 |
0.0 |
0.0 |
0.0 |
||
Net income (normalised) |
208.1 |
224.4 |
167.8 |
134.8 |
164.8 |
196.3 |
222.9 |
||
Net income (reported) |
195.0 |
210.7 |
170.2 |
126.2 |
143.3 |
195.2 |
221.8 |
||
Basic average number of shares outstanding (m) |
319 |
319 |
319 |
318 |
318 |
318 |
318 |
||
EPS - basic normalised (€) |
|
|
0.65 |
0.70 |
0.53 |
0.42 |
0.52 |
0.62 |
0.70 |
EPS - diluted normalised (€) |
|
|
0.65 |
0.70 |
0.53 |
0.42 |
0.52 |
0.62 |
0.70 |
EPS - basic reported (€) |
|
|
0.61 |
0.66 |
0.53 |
0.40 |
0.45 |
0.61 |
0.70 |
Dividend (€) |
0.70 |
0.40 |
1.29 |
1.10 |
0.70 |
0.75 |
0.86 |
||
Revenue growth (%) |
1.6 |
(-0.2) |
4.1 |
6.3 |
10.2 |
9.6 |
|||
Gross Margin (%) |
44.5 |
44.7 |
40.8 |
40.7 |
41.5 |
42.2 |
43.2 |
||
EBITDA Margin (%) |
25.2 |
26.9 |
22.0 |
21.1 |
22.9 |
23.9 |
24.2 |
||
Normalised Operating Margin |
21.0 |
22.7 |
18.1 |
15.0 |
16.7 |
17.9 |
18.6 |
||
BALANCE SHEET |
|||||||||
Fixed Assets |
|
|
1,343.4 |
1,318.9 |
1,330.3 |
1,356.5 |
1,368.7 |
1,444.2 |
1,358.1 |
Intangible Assets |
1,284.2 |
1,237.2 |
1,231.0 |
1,218.5 |
1,157.2 |
1,207.5 |
1,131.2 |
||
Tangible Assets |
44.2 |
56.2 |
67.6 |
109.3 |
111.5 |
136.7 |
126.9 |
||
Investments & other |
15.0 |
25.5 |
31.7 |
28.7 |
100.0 |
100.0 |
100.0 |
||
Current Assets |
|
|
409.4 |
389.9 |
437.4 |
440.4 |
381.2 |
435.0 |
504.7 |
Stocks |
3.0 |
4.2 |
12.5 |
7.9 |
10.7 |
10.7 |
10.7 |
||
Debtors |
92.3 |
55.2 |
80.6 |
127.8 |
137.4 |
142.4 |
147.4 |
||
Cash & cash equivalents |
297.4 |
301.7 |
273.5 |
246.1 |
191.5 |
240.2 |
304.9 |
||
Other |
16.7 |
28.8 |
70.8 |
58.5 |
41.7 |
41.7 |
41.7 |
||
Current Liabilities |
|
|
(457.9) |
(325.0) |
(390.2) |
(482.0) |
(295.0) |
(285.0) |
(275.0) |
Creditors |
(170.4) |
(127.1) |
(149.3) |
(173.9) |
(176.7) |
(166.7) |
(156.7) |
||
Tax and social security |
(178.2) |
(129.9) |
(55.5) |
(89.8) |
(73.1) |
(73.1) |
(73.1) |
||
Short term borrowings |
(0.0) |
(32.1) |
(118.7) |
(169.2) |
(0.2) |
(0.2) |
(0.2) |
||
Other |
(109.3) |
(35.9) |
(66.7) |
(49.2) |
(45.0) |
(45.0) |
(45.0) |
||
Long Term Liabilities |
|
|
(59.8) |
(181.0) |
(305.3) |
(556.7) |
(695.4) |
(795.4) |
(795.4) |
Long term borrowings |
0.0 |
(115.0) |
(263.0) |
(513.1) |
(650.3) |
(750.3) |
(750.3) |
||
Other long term liabilities |
(59.8) |
(66.0) |
(42.3) |
(43.6) |
(45.1) |
(45.1) |
(45.1) |
||
Net Assets |
|
|
1,235.1 |
1,202.8 |
1,072.2 |
758.2 |
759.5 |
798.8 |
792.4 |
Minority interests |
(67.4) |
(41.0) |
(37.0) |
(43.4) |
(36.8) |
(38.0) |
(42.0) |
||
Shareholders' equity |
|
|
1,167.7 |
1,161.8 |
1,035.3 |
714.8 |
722.8 |
760.8 |
750.4 |
CASH FLOW |
|||||||||
Op Cash Flow before WC and tax |
347.4 |
378.3 |
310.7 |
308.0 |
355.2 |
409.4 |
453.2 |
||
Working capital |
7.0 |
(41.0) |
(71.9) |
(9.2) |
(25.0) |
(15.0) |
(15.0) |
||
Exceptional & other |
1.0 |
9.1 |
(12.4) |
(0.4) |
1.1 |
0.0 |
0.0 |
||
Tax |
(68.8) |
(142.5) |
(116.9) |
(31.4) |
(51.7) |
(71.7) |
(83.6) |
||
Net operating cash flow |
|
|
286.6 |
203.9 |
109.4 |
266.9 |
279.6 |
322.7 |
354.6 |
Capex |
(18.6) |
(39.6) |
(42.9) |
(96.3) |
(51.9) |
(30.0) |
(20.0) |
||
Acquisitions/disposals |
(18.6) |
(0.8) |
(0.0) |
(31.5) |
(47.9) |
(94.9) |
0.0 |
||
Net interest |
1.6 |
(4.2) |
(11.9) |
(19.6) |
(24.6) |
(21.7) |
(22.8) |
||
Equity financing |
(8.3) |
(24.2) |
(11.9) |
(1.8) |
(5.5) |
0.0 |
0.0 |
||
Dividends |
(79.8) |
(277.3) |
(292.8) |
(446.1) |
(154.0) |
(222.6) |
(239.9) |
||
Other |
48.1 |
(0.7) |
(12.7) |
0.3 |
(18.6) |
(4.8) |
(7.3) |
||
Net Cash Flow |
211.0 |
(142.9) |
(262.8) |
(328.0) |
(22.8) |
(51.3) |
64.7 |
||
Opening net debt/(cash) |
|
|
(86.4) |
(297.4) |
(154.5) |
108.3 |
436.2 |
459.0 |
510.2 |
FX |
0.0 |
0.0 |
0.0 |
0.0 |
0.0 |
0.0 |
0.0 |
||
Other non-cash movements |
0.0 |
0.0 |
0.0 |
0.0 |
0.0 |
0.0 |
0.0 |
||
Closing net debt/(cash) |
|
|
(297.4) |
(154.5) |
108.3 |
436.2 |
459.0 |
510.2 |
445.6 |
Source: OPAP, Edison Investment Research
|
|
Research: Healthcare
Kazia Therapeutics presented encouraging data from the Cantrixil Phase I study in a poster at American Association for Cancer Research (AACR) this week. Five of the nine evaluable patients (56%) showed stable disease at the completion of monotherapy treatment and one patient achieved an ongoing partial response to Cantrixil plus paclitaxel therapy. The extension cohort has already recruited nine of 12 subjects; data likely H219. Kazia’s primary focus is on GDC-0084, which is in three clinical studies in brain cancers. Initial data from the Phase IIa study in glioblastoma are expected in Q219. We increase our valuation range to between A$84m and A$146m.