Last close As at 05/08/2026
GBP3.78
▲ 4.00 (1.07%)
Market capitalisation
GBP1,342m
Research: Investment Companies
Worldwide Healthcare Trust
Worldwide Healthcare Trust |
Finding investment opportunities in healthcare |
Investment trusts |
23 November 2016 |
Share price/discount performance
Three-year performance vs index
Gearing
Analysts
|
|||||||||||||||||||||||||||||||||||||||||||||||||||||||||||||||||||||||||||||||||||||
Worldwide Healthcare Trust (WWH) aims to generate long-term capital growth from investing in a portfolio of global healthcare stocks; a differentiating feature is the trust’s c 15% exposure to emerging markets. Following a change in mandate in 2010, WWH now invests in all sectors of the healthcare industry. Performance versus its benchmarks is particularly strong over three, five and 10 years. Sam Isaly has been lead manager since launch in 1995; he is co-founder of the world’s largest specialist healthcare investment company, OrbiMed Capital.
12 months ending |
Share price |
NAV |
MSCI World Health Care (%) |
DS World Pharma |
FTSE All- |
31/10/12 |
28.4 |
23.6 |
20.3 |
21.5 |
9.8 |
31/10/13 |
42.3 |
38.7 |
32.6 |
32.7 |
22.8 |
31/10/14 |
40.3 |
38.5 |
24.3 |
24.5 |
1.0 |
31/10/15 |
11.0 |
13.3 |
10.6 |
9.3 |
3.0 |
31/10/16 |
12.6 |
15.3 |
17.6 |
13.2 |
12.2 |
Source: Thomson Datastream. Note: All % on a total return basis in pounds sterling.
Investment strategy: Global healthcare investment
Manager Sam Isaly is part of a team of c 100 healthcare investment professionals at OrbiMed Capital; many have backgrounds in life sciences. From a potential universe of c 1,000 companies, a portfolio of c 70 stocks is selected following thorough fundamental research, focusing on a company’s product pipeline, financial strength and quality of management. Normally at least 60% of the portfolio will be invested in companies with a market cap greater than $5bn, with 20% in companies with a market cap of less than $5bn. Gearing of up to 20% of net assets is permitted and derivatives may be used to enhance returns and mitigate risk.
Market outlook: Valuations are attractive
Following negative sentiment towards US pharma and biotech stocks in the run-up to the US election based on the perception of inflated drug prices, their valuations are looking particularly attractive, trading at forward price/earnings discounts to the broader US market. Healthcare industry fundamentals remain intact: volumes are rising due to ageing populations, pharma companies are launching innovative products and the regulatory environment is benign. For investors wanting exposure to the healthcare sector, a fund investing across the geographic, industry and market-cap spectrum may hold appeal.
Valuation: Narrower discount following US election
Following the recent US election with a win for Trump rather than Clinton, who was very vocal on drug pricing, WWH’s share price has rallied (more strongly than the US healthcare sector). The current discount to cum-income NAV of 1.9% compares to a range of a 0.7% premium to a 13.0% discount over the last 12 months (average of 6.2%). It is also narrower than the average discounts of the last three, five and 10 years (range of 4.8% to 6.5%). Given WWH’s focus on capital growth rather than income, it has a modest dividend yield, currently 0.8%.
Worldwide Healthcare Trust is a research client of Edison Investment Research Limited
Exhibit 1: Trust at a glance
Investment objective and fund background |
Recent developments |
||||||||||||||||||||||||||||||||||||||||||||||||||||||||||||||||||||||
Worldwide Healthcare Trust’s investment objective is to invest worldwide in pharmaceutical, biotechnology and related securities in the healthcare sector to achieve a high level of capital growth. Gearing and derivative transactions are used to mitigate risk and enhance capital returns. In 2010 the mandate was broadened to include healthcare equipment and services and healthcare technology. |
■ 16 November 2016: Announcement of first interim dividend of 6.5p per share. ■ 21 September 2016: Jo Dixon retired as non-executive director. Humphrey van der Klugt is now chairman of the audit committee and David Holbrook is now senior independent director. ■ 14 June 2016: Annual results for 12 months ending 31 March 2016. NAV TR |
||||||||||||||||||||||||||||||||||||||||||||||||||||||||||||||||||||||
Forthcoming |
Capital structure |
Fund details |
|||||||||||||||||||||||||||||||||||||||||||||||||||||||||||||||||||||
AGM |
September 2017 |
Ongoing charges |
0.9% |
Group |
Frostrow Capital LLP |
||||||||||||||||||||||||||||||||||||||||||||||||||||||||||||||||||
Interim results |
November 2016 |
Net gearing |
6.8% |
Manager |
OrbiMed Capital LLC (Samuel Isaly) |
||||||||||||||||||||||||||||||||||||||||||||||||||||||||||||||||||
Year end |
31 March |
Annual mgmt fee |
See page 7 |
Address |
25 Southampton Buildings, London, WC2A 1AL, UK |
||||||||||||||||||||||||||||||||||||||||||||||||||||||||||||||||||
Dividend paid |
January, July |
Performance fee |
See page 7 |
||||||||||||||||||||||||||||||||||||||||||||||||||||||||||||||||||||
Launch date |
April 1995 |
Trust life |
Indefinite |
Phone |
+44 (0)20 3008 4910 |
||||||||||||||||||||||||||||||||||||||||||||||||||||||||||||||||||
Continuation vote |
Five-yearly, next in 2019 |
Loan facilities |
Up to 20% of net assets |
Website |
|||||||||||||||||||||||||||||||||||||||||||||||||||||||||||||||||||
Dividend policy and history |
Share buyback policy and history |
||||||||||||||||||||||||||||||||||||||||||||||||||||||||||||||||||||||
In line with the requirement for investment trusts to pay out 85% of their income net of expenses, two interim dividends a year are paid in January and July. |
The trust has authority to purchase up to 14.99% and allot up to 10% of issued share capital. Allotments in the chart include exercise of subscription shares. Chart includes exercise of warrants. Financial years shown. |
||||||||||||||||||||||||||||||||||||||||||||||||||||||||||||||||||||||
|
|
||||||||||||||||||||||||||||||||||||||||||||||||||||||||||||||||||||||
Shareholder base (as at 31 October 2016) |
Portfolio exposure by geography (as at 31 October 2016) |
||||||||||||||||||||||||||||||||||||||||||||||||||||||||||||||||||||||
|
|
||||||||||||||||||||||||||||||||||||||||||||||||||||||||||||||||||||||
Top 10 holdings (as at 31 October 2016) |
|||||||||||||||||||||||||||||||||||||||||||||||||||||||||||||||||||||||
|
|||||||||||||||||||||||||||||||||||||||||||||||||||||||||||||||||||||||
Source: Worldwide Healthcare Trust, Edison Investment Research, Bloomberg, Morningstar, Thomson Reuters. Note: *N/A where not in October 2015 top 10.
Market outlook: Attractive pharma/biotech valuations
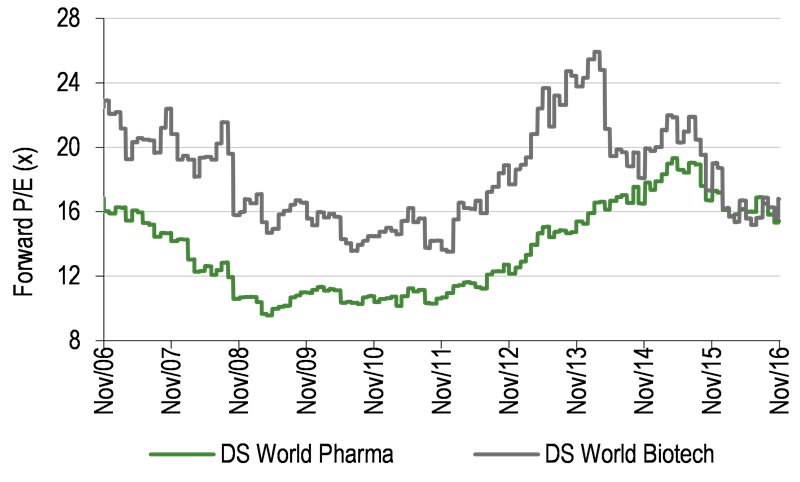
As shown in Exhibit 2 (left-hand side), the last two years have been volatile for healthcare stocks, especially in the biotech sector. In the second half of September 2015, the NASDAQ Biotech index fell by 20% following Turing Pharmaceutical’s 5,000% price increase on a 60-year old generic drug, which led to allegations of industry price gouging. In the run-up to the US election, there were continuous comments about perceived high drug pricing and politicians threatening to remove drug patents. Negative sentiment towards the healthcare industry increased following an investigation into Mylan Labs, which had increased the price of its life-saving anti-allergy EpiPen medication by nearly fivefold since acquiring the product in 2007. Against this backdrop, valuations of both the world pharma and world biotech stocks have come down (Exhibit 2, right-hand side), despite solid industry fundamentals. World pharma stocks are trading roughly in line with the average of the last five years, while world biotech stocks are trading meaningfully below their five-year average. Both sectors are currently trading below the valuation of US equities (Datastream US index). Over the last 20 years, world pharma stocks have seldom traded at a discount to US equities and until 2016 world biotech stocks had never been cheaper than US equities.
|
Exhibit 2: Market performance and valuation |
|
NASDAQ Biotech and MSCI World Health Care index total returns in £ |
12m forward P/E valuation for DS World Pharma and Biotech indices |
|
|
|
Source: Thomson Datastream, Edison Investment Research |
|
Fund profile: Global investment in healthcare stocks
WWH has been managed by OrbiMed Capital since launch in 1995; it has a premium listing on the London Stock Exchange. OrbiMed was founded in 1989 and has grown to become the largest dedicated healthcare investment company in the world. WWH manager Sam Isaly is an OrbiMed co-founder and has been active in healthcare investing and analysis since 1968. He has managed WWH since launch, aiming to generate capital growth from investment in all sectors of the healthcare industry. WWH’s benchmark was the Datastream World Pharma & Biotech index until 30 September 2010 and the broader MSCI World Health Care index thereafter.
There are investment limits in place. At the time of acquisition, no more than 15% of the portfolio can be in an individual stock. At least 60% will normally be invested in larger companies with a market cap at or above $5bn and 20% in smaller companies (less than $5bn market cap). Up to 10% may be in unquoted securities. A maximum of 20% may be invested in each of the following subsectors: healthcare equipment and supplies; healthcare technology; and healthcare providers and services. Gearing of up to 20% of net assets is permitted. Derivatives may be used to enhance returns and mitigate risk; net exposure to derivatives (ex-swaps) of up to 5% is permitted and counterparty exposure via swaps is allowed up to 12% of the portfolio at time of acquisition.
The fund manager: Sam Isaly
The manager’s view: Stock price weakness creates opportunity
The manager suggests that fundamental stock picking has not paid off in 2016, with large industry price moves having been driven by news headlines, predominantly around drug pricing. As a result, generalist investors moved from a significant overweight to an underweight position in healthcare ahead of the US election and any policy changes. Despite the rhetoric, the manager says that over the last 50 years drug costs have remained at around 10% of total US Federal healthcare spending as a result of branded drugs becoming generic, which can lead to price declines of 95%. In the US, 90% of all prescriptions written are for generic drugs, which means the remaining 10% has to fund the industry’s research and development spend. Major pharma company Pfizer spent $7.6bn in 2015 on research and development and it may cost billions of dollars to bring a single drug to the market. In an environment of universal low drug prices, there would be no innovative therapies to treat major illnesses such as Alzheimer’s or cancer. The manager suggests there will not be drug price controls, but there will continue to be public shaming for companies with egregious pricing policies.
The manager believes that industry share price weakness in the run up to the US election has created a real valuation opportunity. Even though healthcare stocks in aggregate have rallied following the election, large-cap US pharma and biotech company valuations remain attractive: both sectors are trading at lower forward earnings multiples than the broader S&P 500 index (14.4x and 11.9x versus 16.6x respectively). This is an unusual situation; there were two significant periods in the past when pharma and biotech stocks became similarly attractively valued – during the Clinton healthcare reform in 1991-94 and the Obamacare discussions in 2008-09. These two periods provided very favourable entry points for healthcare investors. The manager comments that the current low valuations of some specialty pharma and commercial healthcare insurers would be expected for companies headed for bankruptcy. Within the specialty pharma sector, the opportunity to pay a multiple of 4-5x earnings for a company generating 15-20% earnings growth is “a deal of an investor’s lifetime”.
The manager suggests that M&A will set a floor for share prices; if they fall far enough, then these companies will be acquired. During the summer of 2016, healthcare stocks rallied on the back of M&A; the large companies have a lot of cash on their balance sheets, which they are keen to put to work. The sweet spot is seen as a $5-10bn market cap, single-product company, with billion-dollar revenue potential. A recent industry example is Medivation; its stock was down by 60% between summer 2015 and March 2016 when Senator Bernie Sanders was talking about revoking patents. This is in spite of Medivation’s Xtandi drug being revolutionary for prostate cancer sufferers. Sanofi launched a hostile bid for Medivation, which led to a six-way bidding war for the company. In the end, Pfizer paid three times Medivation’s trough valuation, but the deal is still expected to be accretive in year one. After its merger with Pfizer was scuppered, Allergan spent $40bn in two weeks to acquire five companies – three private and two public – showing that there are valuable assets available that large healthcare companies are eager to acquire.
Asset allocation
Investment process: Clinical and financial assessments
The OrbiMed team selects stocks based on thorough fundamental research focusing on companies with underappreciated products or pipelines, strong financials and quality management teams. Manager Sam Isaly works in a team of c 100 healthcare investment professionals, including 10 ex-biotech CEOs. There is a global focus and the investible universe of c 1,000 stocks covers all subsectors of the healthcare industry, which means that investment can be shifted to a region or subsector when required. Investments cover the whole spectrum from pre-clinical assets to major biopharmaceutical companies. Meeting with company managements is a key part of the investment process; investee company managements are met at least once a year.
Looking at two of the major sectors in the healthcare industry, within large-cap pharma, WWH selects companies with deep pipelines, which have the potential to transform either through a major product launch or operationally, and managements that have a deep understanding of the industry. Within large-cap biotech, WWH is attracted by the sector’s low valuation and double-digit earnings growth. Industry fundamentals remain robust, led by product innovation and a favourable regulatory environment; M&A is expected to remain a key feature within the sector.
Current portfolio positioning
At end-October 2016, WWH’s portfolio was split 71.5% in large caps and 28.5% in small caps. This compares with 67.4% and 32.6% at end-October 2015. There has been a modest decrease in concentration as the top 10 holdings accounted for 34.6% of the portfolio at end- October 2016 versus 37.1% a year before.
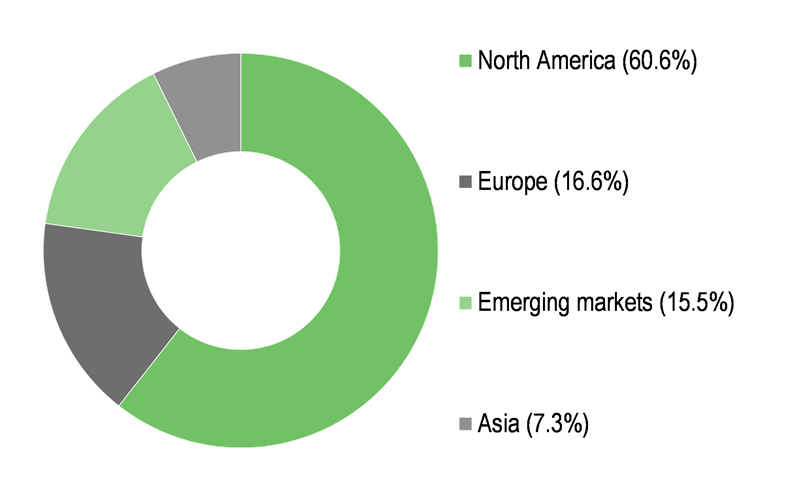
Exhibit 3: Portfolio geographic exposure (% unless stated)*
Portfolio end-October 2016 |
Portfolio end-October 2015 |
Change (pp) |
|
North America |
60.6 |
64.4 |
-3.8 |
Europe |
16.6 |
13.6 |
3.0 |
Emerging markets |
15.5 |
13.4 |
2.1 |
Asia |
7.3 |
8.6 |
-1.3 |
100.0 |
100.0 |
Source: Worldwide Healthcare Trust, Edison Investment Research. Note: *Based on country of incorporation.
As shown in Exhibit 3, there have been marginal changes to WWH’s geographic exposure over the last 12 months. A key feature in the portfolio is the significant exposure to emerging markets, which has a zero weighting in the benchmark. Notable holdings here include Chinese pharmaceutical manufacturer and distributor Jiangsu Hengrui Medicine Co and Indian generic formulation manufacturer Aurobindo Pharma.
Exhibit 4: Portfolio sector exposure vs benchmark (% unless stated)*
Portfolio end-September 2016 |
Index weight |
Difference (pp) |
|
Large-cap pharma |
17.5 |
43.4 |
-25.9 |
Medtech/devices |
14.8 |
15.0 |
-0.2 |
Emerging markets |
13.8 |
0.0 |
13.8 |
Large-cap biotech |
13.8 |
11.7 |
2.1 |
Emerging biotech |
13.3 |
2.4 |
10.9 |
Specialty pharma |
11.2 |
7.8 |
3.4 |
Healthcare services |
10.6 |
14.0 |
-3.4 |
Life science tools |
4.9 |
5.6 |
-0.7 |
100.0 |
100.0 |
Source: Worldwide Healthcare Trust, Edison Investment Research. Note: *Rebased to exclude gearing and structured finance.
In terms of sector exposure, as shown in Exhibit 4, WWH’s largest deviations versus the benchmark at end-September 2016 were an underweight position in large-cap pharma and overweights in emerging markets and emerging biotech. The manager is also focused on low valuations in areas such as specialty pharma, generics and biotech, which have higher growth rates than large-cap pharma; in this sector US companies are preferred to European companies, which have older product portfolios and are more growth challenged.
At end-October 2016, WWH’s second largest holding was in interventional equipment manufacturer Boston Scientific. The medical device sector has been a relatively safe haven in recent months due to the lack of drug pricing overhang. The manager believes that Boston Scientific is recovering from years of sub-optimal management. In June 2016, it announced a global restructuring programme aiming to reduce pre-tax operating expenses by $115m-150m by 2020. In addition, sales growth is accelerating and cash flow is improving. Recent Q316 earnings results came in above consensus expectations, and management raised sales guidance for 2016.
Performance: Mid- and long-term outperformance
WWH has solid outperformance versus the blended benchmark over the long term. Since inception in 1995 to end-FY16 (March 2016), its NAV total return of 2,094.6% (CAGR of 15.9%) compares to a cumulative blended benchmark return of 924.9% (CAGR of 11.8%).
|
Exhibit 5: Investment trust performance to 31 October 2016 |
|
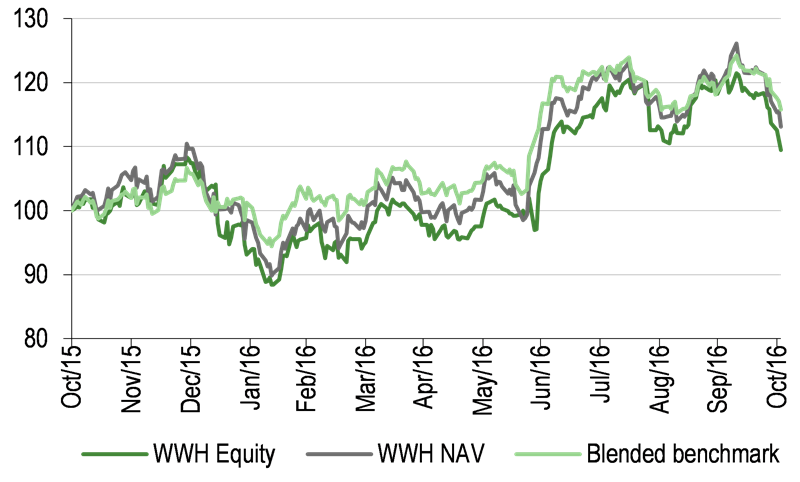
Price, NAV and benchmark total return performance, one-year rebased |
Price, NAV and benchmark total return performance (%) |
|
|
|
Source: Thomson Datastream, Edison Investment Research. Note: Three, five and 10-year performance figures annualised. Benchmark is DS World Pharma & Biotech index until 30 September 2010 and MSCI World Health Care index thereafter. |
|
Absolute returns shown in Exhibit 5 (right-hand side) have been boosted in recent months by weakness in sterling. Over the last six months, WWH’s share price and NAV total returns of 15.1% and 15.6%, respectively, are ahead of the benchmark total return of 14.5%. Looking at Exhibit 6, WWH has a solid record of outperformance over three, five and 10 years (versus the Datastream World Pharma & Biotech index until 30 September 2010 and MSCI World Health Care index thereafter). Of interest to sterling-based investors, WWH’s share price and NAV total return have outperformed the FTSE All-Share over one, three, five and 10 years, significantly so over three, five and 10 years.
Exhibit 6: Share price and NAV total return performance, relative to indices (%)
|
One month |
Three months |
Six months |
One year |
Three years |
Five years |
10 years |
Price relative to MSCI World Health Care |
(3.9) |
(0.3) |
0.5 |
(4.2) |
8.4 |
24.2 |
29.9 |
NAV relative to MSCI World Health Care |
(2.3) |
(1.2) |
1.0 |
(1.9) |
11.9 |
20.3 |
36.7 |
Price relative to WORLD-DS Pharm & Bio |
(3.7) |
0.7 |
1.4 |
(0.6) |
13.7 |
29.0 |
29.9 |
NAV relative to WORLD-DS Pharm & Bio |
(2.1) |
(0.3) |
1.9 |
1.9 |
17.4 |
24.9 |
36.6 |
Price relative to FTSE All-Share |
(5.3) |
(7.2) |
2.6 |
0.3 |
50.1 |
103.5 |
153.9 |
NAV relative to FTSE All-Share |
(3.8) |
(8.1) |
3.0 |
2.8 |
55.0 |
97.1 |
167.1 |
Source: Thomson Datastream, Edison Investment Research. Note: Data to end-October 2016.Geometric calculation.
|
Exhibit 7: NAV performance relative to blended benchmark over five years |
|
|
Source: Thomson Datastream, Edison Investment Research |
Discount: Narrower than historical averages
Following a period of volatility in the healthcare sector, culminating in a Republican win in the US election, WWH’s current 1.9% share price discount to cum-income NAV is narrower than the averages of the last one, three, five and 10 years (range of 4.8% to 6.5%). The discount is significantly lower than the five-year high discount of 13.0% reached on 28 June 2016. WWH’s board aims to keep the discount below 6%; it has been actively repurchasing stock – in the 10 months to end-October 2016, 1.65m shares were repurchased, at a cost of £31.6m.
|
Exhibit 8: Share price premium/discount to NAV (including income) over three years (%) |
|
|
Source: Thomson Datastream, Edison Investment Research |
Capital structure and fees
WWH is a conventional investment trust with one class of share in issue. There are currently 46.3m ordinary shares outstanding. The trust may borrow up to 20% of net assets via an overdraft facility with J.P. Morgan Chase; at end-October 2016, net gearing was 6.8%.
OrbiMed, the fund manager, is paid a base fee of 0.65% of NAV. The Alternative Investment Fund Manager is Frostrow Capital; it is paid £57,500 per annum plus 0.30% of WWH’s market cap up to £150m, 0.20% between £150m and £500m and 0.125% above £500m. A performance fee of 16.5% is payable; split 15%:1.5% between OrbiMed and Frostrow, respectively, if WWH outperforms the blended benchmark. It is only payable when incremental outperformance since launch has been achieved and maintained for a 12-month period. For more information on the performance fee, please see our note of July 2015. Ongoing charges for FY16 were 0.9% versus 1.0% in the prior year (2.1% versus 2.2% including performance fees).
Dividend policy and record
WWH aims to achieve long-term capital growth; it has no specific income target. Dividends are paid twice a year in January and July amounting to 85% of income (after tax and expenses charged to income) in order to maintain investment trust status. The FY16 dividend of 16.5p per share is a 32% increase on the prior year, although FY15 was a 17% decline versus the year before. The revenue reserve at the end of FY16 of £11.1m covers the latest annual dividend by c 1.4x; WWH’s current dividend yield is 0.8%.
Peer group comparison
WWH is a member of the AIC specialist Biotech & Healthcare sector, which contains two biotech and two broader healthcare trusts in the UK. In Exhibit 9 we have also included Swiss investment companies BB Biotech and HBM Healthcare Investments, which are available to UK investors. WWH’s NAV total returns rank third, fourth and fifth out of six funds over one, three and five years, and ranks third out of four funds over 10 years. In terms of risk-adjusted returns, as measured by the Sharpe ratio, WWH is ahead of the peer group weighted average of six trusts, ranking second over both one and three years. Its discount is the second lowest in the group and its ongoing charge is the lowest; in line with the majority of trusts in the sector, a performance fee is payable. Net gearing is the second highest in the group. WWH’s dividend yield is lower than the sector average, but the average is skewed by the two Swiss funds, which distribute c 5% of capital per annum as ‘income’, and International Biotechnology Trust, which has recently adopted a similar 4% policy.
Exhibit 9: Selected peer group as at 15 November 2016
% unless stated |
Market cap £m |
NAV TR 1 Year |
NAV TR 3 Year |
NAV TR 5 Year |
NAV TR 10 Year |
Sharpe 1y (NAV) |
Sharpe 3y (NAV) |
Discount (ex-par) |
Ongoing charge |
Perf. fee |
Net gearing |
Dividend yield (%) |
Worldwide Healthcare Trust |
979.1 |
16.5 |
79.2 |
206.9 |
357.5 |
(0.5) |
0.8 |
(2.5) |
0.9 |
Yes |
109 |
0.8 |
BB Biotech |
3,155.1 |
1.3 |
96.7 |
415.8 |
546.3 |
(1.2) |
0.6 |
(8.7) |
1.1 |
No |
101 |
5.5 |
Biotech Growth Trust |
407.1 |
9.6 |
73.3 |
323.0 |
539.7 |
(0.9) |
0.4 |
(7.6) |
1.0 |
Yes |
111 |
0.0 |
HBM Healthcare Investments |
764.6 |
24.6 |
90.1 |
214.0 |
0.1 |
0.8 |
(26.2) |
1.7 |
Yes |
100 |
5.5 |
|
International Biotechnology |
209.7 |
13.7 |
100.3 |
274.9 |
309.9 |
(0.8) |
0.6 |
(12.6) |
1.5 |
Yes |
100 |
4.1* |
Polar Capital Global Healthcare |
238.2 |
17.5 |
45.8 |
118.6 |
(0.6) |
0.4 |
(2.1) |
1.0 |
Yes |
100 |
2.1 |
|
Group weighted average |
8.7 |
89.2 |
329.4 |
496.4 |
(0.9) |
0.6 |
(9.8) |
1.2 |
103 |
4.4 |
||
WWH rank in peer group |
2 |
3 |
4 |
5 |
3 |
2 |
2 |
2 |
6 |
2 |
5 |
Source: Morningstar, Edison Investment Research. Note: *Prospective yield – dividend not yet declared. TR=total return. Sharpe ratio is a measure of risk-adjusted return. The ratios shown are calculated by Morningstar for the past 12- and 36-month periods by dividing a fund’s annualised excess returns over the risk-free rate by its annualised standard deviation. Net gearing is total assets less cash and equivalents as a percentage of net assets.BB Biotech and HBM Healthcare Investments returns have been translated from CHF to GBP.
The board
There are six directors on the WWH board, of whom five are non-executive and independent of the manager. Chairman Sir Martin Smith was appointed in 2007 and assumed his current role in 2008. Following the recent resignation of Jo Dixon, Dr David Holbrook is now the senior independent director; he joined the board in 2007. Doug McCutcheon was appointed in 2012, Sarah Bates in 2013 and Humphrey van der Klugt in 2016. WWH’s lead fund manager Sam Isaly is non-independent; he has been on the board since the trust’s launch in 1995. The board members have a variety of financial and healthcare/medical experience.
|
|