Last close As at 05/08/2026
—
— 0.00 (0.00%)
Market capitalisation
—
Research: Industrials
Having delivered management expectations in FY18 and despite tempering our forecasts modestly for FY19, guidance is still indicating strong growth, especially at Voltabox. Q119 results do nothing to deflect the expectations and growth should accelerate as the year progresses, primarily as Voltabox increasingly delivers against its €1.1bn backlog. The continued investment in the auto operations should also start to be reflected in improved earnings this year. On our new lower estimates, the rating fails to reflect the growth potential.
Written by
paragon |
Strong growth set to continue |
Q119 results |
Automobiles & parts |
21 May 2019 |
Share price performance
Business description
Next events
Analyst
paragon is a research client of Edison Investment Research Limited |
|||||||||||||||||||||||||||||||||||||||||||||
Having delivered management expectations in FY18 and despite tempering our forecasts modestly for FY19, guidance is still indicating strong growth, especially at Voltabox. Q119 results do nothing to deflect the expectations and growth should accelerate as the year progresses, primarily as Voltabox increasingly delivers against its €1.1bn backlog. The continued investment in the auto operations should also start to be reflected in improved earnings this year. On our new lower estimates, the rating fails to reflect the growth potential.
Year end |
Revenue (€m) |
PBT* |
EPS* |
DPS |
P/E |
Yield |
12/17** |
124.8 |
5.9 |
(0.09) |
0.25 |
N/M |
0.01 |
12/18 |
187.4 |
14.8 |
1.45 |
0.25 |
16.6 |
0.01 |
12/19e |
240.2 |
18.8 |
2.41 |
0.25 |
10.0 |
0.01 |
12/20e |
295.3 |
24.3 |
2.99 |
0.25 |
8.0 |
0.01 |
Note: *PBT and EPS are normalised, excluding amortisation of acquired intangibles, exceptional items and share-based payments. **FY17 restated.
FY18 delivered, positive start to FY19
paragon’s operations modestly exceeded management expectations in FY18 as sales grew by 50% and generated a reported group EBIT margin of 7.9%. Voltabox (VBX) clearly exceeded expectations, with revenues growing 171% to €66.9m and operating leverage helping EBIT margin expand to a better than expected 8.3% (guidance was reduced to 7% in mid-2018). The EBIT performance of Electronics largely offset disappointingly lower profits at Mechanics. Despite a more challenging environment for these automotive-facing operations, Q119 saw revenues grow by 25% as Voltabox once again more than doubled revenues.
Estimates reduced to reflect current guidance
Guidance has been set for the group at revenues of €230–240m, with an EBIT margin of c 8%. Revenue growth is still a strong c 25%, with most of the shortfall against our previous expectation coming from a €10m reduction in Voltabox, where management still expects FY19 growth to be 60%, with a modest margin increase. As Voltabox seeks to deliver against its five-year order backlog of €1.1bn and new automotive products are introduced in both Electronics and Mechanics, we expect high rates of growth to continue, and flow into earnings and cash flows.
Valuation: Rating does not reflect growth prospects
As earnings are now turning positive, we can see that ratings look inappropriate for a dynamically growing company, The FY20e P/E multiple of just 8.0x fails to do justice to the group, even if much of the current performance is being delivered by Voltabox. Applying an auto components multiple to the FY19e EBITDA of the other operations implies a value of €43.7 per share for the group, including the 60% share of Voltabox at current market values. Despite our lower growth trajectory, our capped DCF returns a value of €85 per share (vs €95 in August 2018).
FY17 Voltabox results corrected and restated
Before considering paragon’s FY18 results, it should be noted that the FY17 report from Voltabox was subject to several restatements due to inappropriate or incorrect use of accounting treatments, as well as a few disclosure errors. These restatements were reflected in the consolidated report for Voltabox for FY18, as well as the consolidated report for paragon for FY18 at group level.
None of these in our view alters the ongoing financial prospects for estimation, although the market took fright when a required regulatory announcement (under Section 109 (2)(1) of the German Securities Trading Act (WpHG)) of the report by the German Financial Reporting Enforcement Panel (FREP) was issued on 6 May 2019 without comment. As the corrections had essentially been included in the Voltabox and paragon accounts released in early April, this secondary reaction seems unwarranted. The accounts were also restated to reflect the application of IAS 9 and first-time adoption of IFRS, the impacts of which were minimal. Voltabox has not appealed the findings and the BaFin decision on the paragon restatement will be published shortly, with a similar required release expected at that point.
Exhibit 1: Restatement of Voltabox and paragon’s consolidated FY17 accounts – key effects
FY17 (€m) |
Before |
Amendment |
After |
Nature |
For Voltabox |
||||
EBIT |
0.6 |
(3.4) |
(2.8) |
Inclusion of reallocated operating expense from IPO |
Tax |
(0.1) |
(2.9) |
(3.0) |
Disallowance of deferred tax losses at Voltabox of Texas |
Reallocation |
9.9 |
(9.9) |
0.0 |
Profit from paragon transfer agreement recognised directly in equity |
Net income |
9.7 |
(16.2) |
(6.5) |
The above effects |
Number of shares (m) |
11.3 |
4.7 |
Weighted average calculation corrected for timing of debt conversion |
|
EPS (c) |
0.86 |
(2.25) |
(1.39) |
|
Net assets |
3.3 |
(3.0) |
0.4 |
Deferred tax assets disallowed |
For paragon |
||||
EBIT |
7.6 |
(2.2) |
5.4 |
Other operating expenses increase |
Ta |
(3.9) |
(1,1) |
(5.0) |
Includes deferred tax changes |
Net income |
(0.7) |
(3.3) |
(4.0) |
Lower adjustment as profit/loss transfer has no effect at group level |
EPS (€) |
(0.15) |
(0.30) |
Reflects change to minority calculation |
|
Net assets |
311.8 |
(3.9) |
308.0 |
Deferred tax balances and net income reallocations |
Source: Company reports
The restatements were included by paragon in its consolidated group FY18 Annual Report and Accounts, as indicated on page 94. It should be noted that no comment was addressed towards the FY18 report, which forms the basis for our comment, estimates and valuation.
FY18 results beat guidance modestly
Exhibit 2: paragon FY18 results summary
Year to December (€m) |
FY17 |
FY18 |
% change |
Divisional revenue |
|||
Electronics (of which) |
90.8 |
85.5 |
-5.8% |
- Sensors |
33.8 |
34.3 |
1.5% |
- Cockpit (A) |
35.7 |
33.3 |
-6.6% |
- Acoustics (B) |
21.4 |
16.7 |
-21.9% |
- Interior (A)+(B) |
57.0 |
50.0 |
-12.3% |
- Digital Assistance |
- |
1.2 |
N/M |
Electromobility |
24.7 |
66.9 |
170.9% |
Body Kinematics |
9.33 |
34.977 |
274.9% |
Total Revenue |
124.8 |
187.4 |
50.1% |
EBITDA (EIR definition) |
16.964 |
23.093 |
36.1% |
EBITDA (EIR) margin |
16.5% |
18.5% |
12.1% |
Other operating income |
1.379 |
7.197 |
421.9% |
EBITDA (adjusted) |
18.343 |
30.290 |
65.1% |
EBITDA (adjusted) margin |
14.7% |
16.2% |
|
One-off expenses |
(3.5) |
0 |
|
EBITDA (reported) |
14.810 |
30.290 |
104.5% |
EBITDA (reported) margin |
11.9% |
16.2% |
|
Operating Profit (adjusted) |
8.9 |
14.8 |
65.8% |
Operating Profit (adjusted) margin |
7.2% |
7.9% |
|
Operating profit (reported) |
5.4 |
14.8 |
173.9% |
Operating (reported) margin |
5.3% |
7.9% |
|
Profit before tax (reported) |
1.0 |
10.6 |
N/M |
Net income |
(4.0) |
3.4 |
N/M |
EPS diluted (reported)(€) |
(0.30) |
0.52 |
N/M |
Net debt/(cash) (EIR defined) |
(59.5) |
68.8 |
N/M |
Net debt/(cash) (company defined liquidity) |
(80.5) |
61.7 |
N/M |
Source: paragon reports, Edison Investment Research
The key highlights of paragon’s performance in FY18 were as follows:
■
Group 60-month cumulative order backlog at 31 December 2018 (weighted for lifetime and probability of occurrence) was €2.1bn (FY17: €2.0bn), of which Voltabox accounted for €1.1bn (FY17: €1.0bn).
■
Reported FY18 revenues of €187.4m (FY17: €124.8m), a 50% increase and modestly above guidance of €185m.
■
FY17 accounts were restated to reflect corrections to Voltabox’s accounts, primarily affecting the presentation of group net income, which was reduced, and disallowed some deferred tax assets. The net cash position was unaffected.
■
Reported FY18 EBITDA of €30.3m (restated FY17: €14.8m).
■
Reported FY18 EBIT of €14.8m (restated FY17: €5.4m) represented a 174% increase, with a margin of 7.9%, compared to 7.2% after adjusting for one-off costs in Mechanics of €3.6m in FY17 and following the restatement of Voltabox’s accounts.
■
Voltabox (Electromobility) made a first positive EBIT contribution of €5.6m compared to a restated loss of €1.6m in FY17.
■
Organic capex investment increased by €27.0m to €48.8m, of which Voltabox accounted for €13.6m (FY17: €6.3m).
■
Acquisition spending increased to €26.3m from €16.0m in FY17. Acquisitions included 82% of SemVox (now paragon semvox) on 1 October 2018 for an initial net cash consideration of €16.2m, and LPG/ETON (now paragon electroacoustics) for €2.8m on 1 November 2018. Voltabox acquired Concurrent Design on 1 April 2018 for €2.5m and on 1 September 2018 it bought ACCURATE Smart Battery Systems for €4.8m.
■
Operating cash outflow of €53.4m compared to €10.0m in the prior year. The movement was more than accounted for by Voltabox as its working capital expanded to prepare for growth and reflecting the changes to the Triathlon supply agreement.
■
Company defined net debt at the period end was €61.7m, to which Voltabox contributes €24.5m of net cash. This compares to company defined net cash of €80.5m at the end of FY17, of which €98.6m was attributable to Voltabox. The company defined net debt attributable to the remaining paragon activities at the end of the year thus increased to €86.2m from €18.1m. The company calculation includes group cash and cash equivalents, and additional available liquidity. The additional liquidity fell from €21.0m at the end of FY17 to €7.1m at the end of FY18. Excluding these amounts, group net debt on our normal definition amounted to €68.8m at the end of FY18 compared to group net cash of €59.5m at the end of FY17.
|
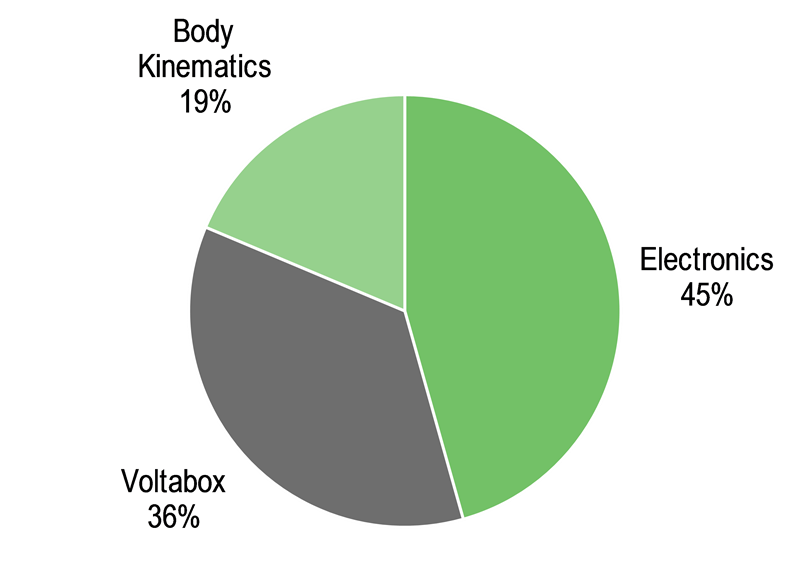
Exhibit 3: paragon revenues split by division (FY18: €187.4m) |
Exhibit 4: paragon revenue progression by division |
|
|
|
Source: paragon reports |
|
Exhibit 3: paragon revenues split by division (FY18: €187.4m) |
|
|
Source: paragon reports |
|
Exhibit 4: paragon revenue progression by division |
|
|
Source: paragon reports |
Revenue growth in FY18 was driven primarily by Voltabox (the Electromobility segment, up 171%). Electronics remains the largest segment at present, although sales fell by 5.8%. However, the rapid organic growth at Voltabox is expected to result in this being the largest contributor in FY19. It is also worth noting the rapid progress of Body Kinematics (formerly Mechanics – up 275%) following the acquisition of HS Genion in late 2017, with revenues more than trebling in FY18.
In the Electronics segment, revenues at the Sensors unit rose 1.5% to €34.3m as sales of new-generation products for vehicles started to outweigh lifecycle declines of older-generation products. Revenues at the newly formed Interiors division declined by 12.3% to €50.0m, with Acoustics responsible for over half of the underlying decline of €8.6m, and LPG adding €1.6m of revenues. The newly created Digital Assistance unit (paragon semvox) added €1.2m. Overall, Electronics revenues fell by 5.8% to €85.5m, or by an underlying 8.9% excluding the 2018 acquisitions. Despite the fall in sales, EBIT for the overall segment rose to €10.5m (FY17: €9.7m), a margin of 11.2% compared to 10.2% in the prior year.
External sales of the Mechanics segment are represented by paragon movasys, where the full-year contribution from HS Genion helped more than treble sales to €35.0m (FY17: €9.3m). Somewhat disappointingly, the segment moved into a modest loss of €0.7m at the EBIT level, compared to the €1.2m profit seen in FY17. Timing of new product developments and introductions appears to have been largely responsible for the reversal in profitability.
Segment revenues of Electromobility (comprising Voltabox) rose by 171% to €66.9m, ahead of guidance of €65m for FY18. The primary growth driver was battery packs for intralogistics (forklift trucks), including the first direct sales of battery systems to customers in the EU alongside the now revised Triathlon supply agreement. ACCURATE added €2.2m to revenues as an initial contribution. The segment moved into a healthy EBIT position of €5.6m (FY17: loss €1.6m), a margin of 8.4%, closer to original guidance of 9% before revision of the Triathlon agreement rather than the subsequent 7%, which was readily beaten due to operating leverage.
Strategy remains unchanged
There is no change to paragon’s strategy, rather an evolution as opportunities are identified based on a virtuous cycle of innovation, inspiration, integration and introduction.
The innovative engineering capabilities are centred on the core idea of enhancing the driving experience, inspired by the global megatrends of climate change, digitalisation and urbanisation, which translate into digitalisation, CO2 reduction, urbanisation and increased comfort for the automotive value chain. The relevant fields of innovation derived from these trends are shared mobility, connectivity, e-mobility, autonomous driving, digital assistance and emission control. These trends are addressed by the business segments, which develop new products that are offered to customers using the ‘push’ principle once functionally developed with intellectual property suitably protected. Generally, this provides a first-mover advantage when integrated into customer platforms and introduced into the market.
The sustainability of the strategy has four key elements at its core:
■
Product innovation and development, the lifeblood of the business allowing it to push innovative solutions to its automotive customers to address the trends it identifies proactively.
■
Increasing the customer base (market penetration), extending the strong established relationships in the luxury and premium automotive segments into the volume segment, supported by a trickle-down effect of its products into the mid-range and compact segments.
■
Regional development with a key focus on the high-growth markets of North America and China where it already has a presence.
■
Developing new submarkets with new product offerings. Examples include the creation of the Digital Assistance segment and broadening of end-markets for battery packs.
As has been evident in the last year, the organic strategy is supported by active M&A to shorten development cycles and accelerating entry into new segments and markets.
Acquisitions should augment FY19 growth
As stated, there were several acquisitions made during 2018 for an aggregate initial cash consideration of €26.3m. Full-year contributions from these are likely to add around €15m to group revenues in FY19, although they may at first be dilutive to group operating margins.
Exhibit 5: Acquisitions in 2018 (€m)
Acquisition |
Location |
Date |
Division/ |
Cash consideration |
Sales |
EBIT |
|||
segment |
Initial |
Deferred |
FY18* |
2018** |
FY18* |
2018** |
|||
Concurrent Design |
US |
1-Apr-18 |
Electromobility |
2.5 |
0.4 |
0.3 |
0.9 |
0.0 |
0.3 |
ACCURATE |
Germany |
1-Sep-18 |
Electromobility |
4.8 |
0.0 |
2.2 |
4.3 |
0.7 |
(0.4) |
SemVox |
Germany |
1-Oct-18 |
Digital Assistance |
16.2 |
3.8 |
1.2 |
3.9 |
(1.6) |
|
LPG/ETON |
Germany |
1-Nov-18 |
Acoustics |
2.8 |
0.5 |
1.6 |
12.0 |
0.2 |
|
Source: paragon reports. Note: *Consolidated result from date of purchase. **Full year performance.
The acquisitions by Voltabox allow for accelerated systems engineering and a greater vertical integration in the production of power packs.
The two acquisitions in Electronics by paragon provide new strategic development paths for the group’s automotive operations. Following its acquisition, the now renamed paragon semvox forms the foundation of a new Digital Assistance division in the Electronics segment. The division has core capabilities based on artificial intelligence (AI) and machine learning to provide system solutions for digital assistance systems. These include voice control applications, human machine interaction and intelligent assistance systems.
LPG (Lautsprecher-Produktions Gmbh) and its subsidiary ETON have been renamed paragon electroacoustics. LPG manufactures and sells loudspeakers and electronic devices, with ETON manufacturing, selling and trading electronic components. Together with the former cockpit and acoustics segments, this now forms paragon’s new Interiors division.
Guidance
With FY18 results, both paragon and its subsidiary Voltabox released their guidance for FY19. At the paragon group level management expects revenue of €230–240m, an increase of around 25%, with an EBIT margin similar to the FY18 level at around 8.0%. Investment across the group is expected to be sustained at c €40m seen in FY18. Included in this assumption is the guidance from Voltabox for revenues of €105–115m and EBIT margins in the 8–9% range, with investment of around €14m. The proportion of capitalised development work is forecast to be €18m at the group level, of which €8m is attributable to Voltabox.
By deduction, the sales of the other paragon activities, Body Kinematics and Electronics, are expected to rise only modestly to €125–135m from €120.5m in FY18, despite an additional contribution in excess of €10m from the acquisitions. We believe this reflects the expectation of continuing product cycles, although management does indicate that it expects all segments to increase sales, including organically in Mechanics and in the Sensors unit of Electronics. We suspect the ongoing activities of Acoustics and Cockpit in the Interiors division are likely to experience further organic declines.
Management reiterated guidance with the Q119 report on 13 May 2019.
Revisions to FY19 estimates
The reduction in our FY19 estimates is largely due to Voltabox growth indications being below our previous expectations, compounded by reduced margin development. Nevertheless, the expected rate of sales and earnings growth at Voltabox remains very strong. In the rest of paragon, we now expect lower profitability at Mechanics as it grows from its FY18 base, which was worse than we expected. We expect that reduction to be largely offset by higher profitability at Electronics, albeit relatively flat on FY18. It should be noted that productronic Gmbh has been reclassified to the Electronics segment from Q119, removing significant internal revenue eliminations. The company now serves as the internal manufacturing arm only for Electronics, as paragon movasys serves as the manufacturing unit for Mechanics The changes does not affect external revenues, but does affect the calculation of unit margin as total revenues are used, including internal sales.
Exhibit 6: paragon earnings estimates revisions
€m |
2018 |
2019e |
||||
|
Prior |
Actual |
% change |
Prior |
New |
% change |
Electronics |
93.7 |
85.5 |
(8.7%) |
101.1 |
96.5 |
(4.6%) |
Voltabox |
60.1 |
66.9 |
11.3% |
117.2 |
107.0 |
(8.7%) |
Mechanics |
24.7 |
35.0 |
41.5% |
32.9 |
36.7 |
11.7% |
Total group external revenues |
178.5 |
187.4 |
5.0% |
251.2 |
240.2 |
(4.4%) |
|
|
|
|
|
|
|
Electronics |
15.9 |
20.0 |
25.6% |
17.7 |
20.0 |
13.1% |
Voltabox |
7.4 |
9.6 |
29.8% |
18.2 |
15.5 |
(14.5%) |
Mechanics |
6.2 |
1.3 |
(79.2%) |
6.6 |
3.7 |
(44.2%) |
HQ Other and intersegment |
(3.8) |
(0.6) |
(84.8%) |
(3.8) |
(0.6) |
(84.8%) |
EBITDA (company reported) |
25.7 |
30.3 |
17.9% |
38.6 |
38.6 |
(0.0%) |
|
|
|
|
|
|
|
Underlying PBT |
13.3 |
14.8 |
11.4% |
23.8 |
18.8 |
(21.0%) |
|
|
|
|
|
|
|
EPS (€) |
1.88 |
1.45 |
(23.0%) |
3.05 |
2.41 |
(20.9%) |
DPS (€) |
0.25 |
0.25 |
0.0% |
0.25 |
0.25 |
0.0% |
Net cash/(debt) |
17.8 |
(68.8) |
N/M |
5.6 |
(72.6) |
N/M |
Source: Edison Investment Research estimates
Overall, our FY19e sales are reduced by 4.4%, although EBITDA is maintained despite a different segmental mix. Adjusted profit before tax (before PPA intangibles amortisation) is further reduced by a higher depreciation charge following the investments in FY18, and higher interest costs due to the increased average net debt including the CHF35m April bond issue. Our PBT estimate for FY19 is consequently reduced by 21% to €18.8m.
As a result, we have revised our estimates for 2019 as shown below:
While our EPS estimates are reduced by more than a quarter, we still anticipate growth of 65% for the group on a normalised basis in FY19.
We also introduce our FY20 estimates for the first time, namely revenues of €295.3m, up 23% with an EBIT margin of 8.8% on an as reported basis, delivering underlying EPS growth of over 20%.
Q119 trading
Exhibit 7: paragon Q1 summary
€m |
Q118 |
Q119 |
% change |
Divisional revenue |
|||
Electronics (of which) |
21.7 |
21.7 |
0.1% |
- Sensors |
8.7 |
7.9 |
-9.2% |
- Interior |
13.0 |
13.2 |
1.3% |
- Digital Assistance |
- |
0.6 |
N/M |
Electromobility |
5.1 |
12.6 |
148.8% |
Body Kinematics |
7.5 |
8.7 |
15.6% |
Total Group revenue |
34.2 |
43.0 |
25.4% |
EBITDA (EIR definition) |
4.6 |
4.2 |
-7.2% |
EBITDA (EIR) margin |
13.3% |
9.9% |
-26.0% |
Other operating income |
0.2 |
3.3 |
|
EBITDA (reported) |
4.8 |
7.6 |
57.7% |
EBITDA (reported) margin |
14.0% |
17.6% |
|
Operating Profit (adjusted) est |
2.312 |
3.036 |
|
Adj Operating Profit margin |
6.8% |
7.1% |
|
Operating profit (reported) |
1.6 |
2.0 |
26.3% |
Operating margin |
4.7% |
4.7% |
|
Profit before tax (reported) |
0.2 |
0.6 |
268.4% |
Net profit (loss) (reported) |
(0.6) |
1.7 |
|
EPS diluted (reported) (€) |
(0.01) |
0.31 |
|
Net debt/(cash) (EIR defined) |
(68.8) |
(98.5) |
|
Net debt/(cash) (company defined) |
(61.7) |
(91.6) |
Source: paragon reports, Edison Investment Research
The highlights of Q119 trading performance are as follows:
■
External revenues grew 25.4% to €43.0m (Q118: €34.2m), in line with FY19 guidance.
■
Company-defined EBITDA rose 57.7% to €7.6m (Q118: €4.8m).
■
EBIT increased by 26.3% to €2.0m (Q118: €1.6m), with the margin maintained at 4.7%.
■
The group returned a positive net income of €1.7m compared to a loss of €0.7m in Q118.
■
Reported EPS for the period were €0.31 per share (Q118: loss per share €0.01).
■
We estimate that adjusted EPS (excluding acquired intangibles amortisation) rose to €0.53.
■
Cash flow from operating activities was little changed with an outflow of €8.5m (Q118 outflow: €8.1m), largely due to working capital. Capex increased to €12.2m from €5.7m in Q118.
■
Company-defined net debt rose €29.9m to €91.6m during the quarter, with the movement being entirely attributable to Voltabox. The adoption of IFRS 16 at the start of 2019 brought €6.1m of lease liabilities onto the balance sheet. These had increased to €9.7m by the Q119 period end, which is included in the net debt movement. Free liquidity in excess of cash and cash equivalents was relatively unchanged at €6.9m (€7.1m at the start of the period). The bond issue in early April added around €31m of liquidity.
■
Guidance has been maintained by management for FY19. As was seen last year, Q1 performance does not necessarily reflect the anticipated outcome for the full year.
While all segments made progress in revenues, growth was primarily driven by Voltabox and Electronics was essentially flat due to weaker Sensors sales. In terms of reported EBIT contribution, only Voltabox improved compared to the prior year, reversing a loss of €0.77m to a contribution of €0.56m. Mechanics and Electronics both saw reported EBIT decline by around €1.5m, which appears to be largely due to timing of new product introductions and lifecycle factors for existing products. The Q119 result also reflects the transfer of productronic into the Electronics segment. The remainder of the improvement coming from the Other Eliminations segment, where we assume the improvement in other operating income is largely reflected.
Overall, Q119 appears to be a decent start to the year, but management focus on execution remains key to delivering full-year guidance, as it did in FY18.
Valuation
We note that an even delivery of paragon’s 60-month backlog of €2.1bn would imply annual group revenues of c €400m, including Voltabox revenues averaging €200m pa based on its €1.1bn backlog included in the group total. Both of these are significantly larger than FY19 guided revenue levels, implying that strong growth is yet to come in the next five years.
By stripping out the enterprise value attributed to Voltabox by the market, we can deduce the valuation attributed by the market to the remainder of paragon’s operations, Electronics and Mechanics. This is shown in the table below.
Exhibit 8: Valuation of paragon excluding Voltabox
Market value attributable to paragon without Voltabox (€m) |
|
paragon's stake in Voltabox |
60% |
Voltabox market value (share price €15.5 at 14 May 2019) |
245 |
Voltabox's market value to paragon (1) |
147 |
paragon's total market value (2) (share price €26 at 14 May 2019) |
118 |
Market value attributable to paragon’s electronics and mechanics business (2)-(1) |
(29) |
Net debt to paragon (excluding Voltabox) |
86 |
paragon's EV (excluding Voltabox) |
57 |
paragon's FY19e EV/sales for the electronics and mechanics segment |
0.43 |
paragon's FY19e EV/EBITDA for the electronics and mechanics segment |
2.4 |
paragon's FY18e EV/EBIT for the electronics and mechanics segment |
6.7 |
Market value attributable to paragon without Voltabox (€m) |
paragon's stake in Voltabox |
Voltabox market value (share price €15.5 at 14 May 2019) |
Voltabox's market value to paragon (1) |
paragon's total market value (2) (share price €26 at 14 May 2019) |
Market value attributable to paragon’s electronics and mechanics business (2)-(1) |
Net debt to paragon (excluding Voltabox) |
paragon's EV (excluding Voltabox) |
paragon's FY19e EV/sales for the electronics and mechanics segment |
paragon's FY19e EV/EBITDA for the electronics and mechanics segment |
paragon's FY18e EV/EBIT for the electronics and mechanics segment |
60% |
245 |
147 |
118 |
(29) |
86 |
57 |
0.43 |
2.4 |
6.7 |
Source: Edison Investment Research estimates
It is apparent that, following the sharp decline in the share price and the increase in debt, a negative equity value is implied for the other paragon activities despite them generating improving profitability and cash flow.
We can reverse this process by applying an EV/EBITDA multiple of 6x (auto components peer group average) to our FY19 estimates and adding the current market value of Voltabox. At present, this implies that paragon should be trading at €43.8 per share.
Clearly, this is dependent on our growth estimates for the auto-facing activities being met, but at present, given the current level of guidance, we do not feel this is a stretch target.
Indeed, our capped DCF for the entire paragon group still returns a value of €85, using a WACC of 7.4% and a terminal growth rate of zero. Sensitivity to terminal growth rates and WACC of the DCF-derived equity value per share is shown below.
Exhibit 9: Capped DCF equity value per share (€/share)
WACC |
6% |
6.50% |
7.00% |
7.4% |
7.50% |
8.00% |
8.50% |
9.00% |
9.50% |
Terminal growth rate |
|||||||||
0% |
121 |
107 |
94.0 |
85 |
83 |
74 |
65 |
58 |
51 |
1% |
123 |
108 |
95.2 |
86 |
84 |
75 |
66 |
59 |
52 |
2% |
124 |
109 |
96.3 |
87 |
85 |
76 |
67 |
60 |
53 |
3% |
126 |
110 |
97.5 |
88 |
86 |
77 |
68 |
60 |
54 |
Source: Edison Investment Research estimates
Financials
While we have reduced our growth rates and margin forecasts, both Voltabox and the other paragon activities look set to continue to grow as new generations of sensors and new product introductions are sold to a broader range of customers in an expanding number of end-market applications around the globe. We expect the development of adjusted EPS (excluding the PPA amortisation of acquired intangibles) to grow progressively, initially primarily driven by Voltabox but also with increasing contributions from the Electronics and Mechanics segments.
Cash flow in FY18 was heavily affected by working capital investment at Voltabox. This resulted from inventories built in support of expected growth in the current year, as well as an increase in receivables reflecting the changes to terms of trade under the revised battery pack supply agreement with Triathlon that changed in May 2018. While we expect some unwinding of the position in FY19, as paragon maintains high growth across its segments, we expect to see continued increases in working capital as the norm from 2020.
We also expect investment to be maintained at a high level of around €40m pa as production development, manufacturing processes and facilities are expanded to meet the anticipated growth.
We therefore expect a modest increase in net debt in FY19 before a more normal working capital profile resumes next year. On our forecast, even with net debt of €93m at the end of FY20, this represents a 2x net debt/EBITDA multiple.
It should be noted that after pulling a bond issue last autumn due to market conditions, paragon successfully returned to the market in early April 2019 raising CHF35m (€31m), increasing gross cash available for the group. The bond has a five-year term with a 4% coupon and was placed entirely within Switzerland.
Exhibit 10: Financial summary
€m |
2017 |
2018 |
2019e |
2020e |
||
Year end 31 December |
IFRS |
IFRS |
IFRS |
IFRS |
||
PROFIT & LOSS |
||||||
Revenue |
|
|
124.8 |
187.4 |
240.2 |
295.3 |
Cost of Sales |
(71.2) |
(105.9) |
(124.9) |
(147.6) |
||
Gross Profit |
53.6 |
81.5 |
115.3 |
147.6 |
||
EBITDA |
|
|
18.3 |
30.3 |
38.6 |
47.0 |
Operating Profit (before amort. and except). |
13.3 |
23.4 |
29.0 |
35.6 |
||
Intangible Amortisation |
(3.0) |
(4.3) |
(5.0) |
(6.0) |
||
Exceptionals |
(4.9) |
(4.2) |
(4.0) |
(4.0) |
||
Other |
0.0 |
0.0 |
0.0 |
0.0 |
||
Operating Profit |
5.4 |
14.8 |
20.0 |
25.6 |
||
Net Interest |
(4.4) |
(4.2) |
(5.2) |
(5.3) |
||
Profit Before Tax (norm) |
|
|
5.9 |
14.8 |
18.8 |
24.3 |
Profit Before Tax (FRS 3) |
|
|
1.0 |
10.6 |
14.9 |
20.3 |
Tax |
(5.0) |
(7.2) |
(4.0) |
(5.5) |
||
Profit After Tax (norm) |
(0.4) |
7.6 |
13.7 |
17.7 |
||
Profit After Tax (FRS 3) |
(4.0) |
3.4 |
10.8 |
14.8 |
||
Average Number of Shares Outstanding (m) |
4.5 |
4.5 |
4.5 |
4.5 |
||
EPS - normalised (€) |
|
|
(0.09) |
1.45 |
2.41 |
2.99 |
EPS - normalised fully diluted (€) |
|
|
(0.09) |
1.45 |
2.41 |
2.99 |
EPS - (IFRS) (€) |
|
|
(0.30) |
0.52 |
1.77 |
2.36 |
Dividend per share (€) |
0.25 |
0.25 |
0.25 |
0.25 |
||
Gross Margin (%) |
42.9 |
43.5 |
48.0 |
50.0 |
||
EBITDA Margin (%) |
14.7 |
16.2 |
16.1 |
15.9 |
||
Operating Margin (before GW and except.) (%) |
10.7 |
12.5 |
12.1 |
12.1 |
||
BALANCE SHEET |
||||||
Fixed Assets |
|
|
104.1 |
172.9 |
194.4 |
215.3 |
Intangible Assets |
67.4 |
122.1 |
129.2 |
134.9 |
||
Tangible Assets |
36.4 |
50.5 |
64.9 |
80.1 |
||
Investments |
0.3 |
0.3 |
0.3 |
0.3 |
||
Current Assets |
|
|
203.8 |
189.4 |
187.0 |
189.9 |
Stocks |
17.3 |
58.9 |
48.0 |
58.5 |
||
Debtors |
32.7 |
70.7 |
79.3 |
88.6 |
||
Cash |
145.8 |
41.8 |
37.8 |
16.8 |
||
Other |
8.0 |
17.9 |
21.9 |
26.0 |
||
Current Liabilities |
|
|
(46.4) |
(84.4) |
(51.7) |
(62.2) |
Creditors |
(27.4) |
(42.2) |
(51.7) |
(62.2) |
||
Short term borrowings |
(19.0) |
(42.2) |
0.0 |
0.0 |
||
Long Term Liabilities |
|
|
(70.2) |
(71.7) |
(113.4) |
(112.7) |
Long term borrowings |
(67.3) |
(68.4) |
(110.5) |
(110.1) |
||
Other long-term liabilities |
(2.8) |
(3.3) |
(2.9) |
(2.5) |
||
Net Assets |
|
|
191.4 |
206.2 |
216.3 |
230.4 |
CASH FLOW |
||||||
Operating Cash Flow |
|
|
0.8 |
(42.0) |
47.6 |
34.7 |
Net Interest |
(4.4) |
(4.2) |
(5.2) |
(5.3) |
||
Tax |
(6.3) |
(7.2) |
(5.1) |
(6.5) |
||
Capex |
(21.8) |
(48.8) |
(40.1) |
(42.4) |
||
Acquisitions/disposals |
(15.9) |
(26.3) |
0.0 |
0.0 |
||
Financing |
143.2 |
1.5 |
0.0 |
0.0 |
||
Dividends |
(1.1) |
(1.1) |
(1.1) |
(1.1) |
||
Net Cash Flow |
94.4 |
(128.3) |
(3.9) |
(20.6) |
||
Opening net debt/(cash) |
|
|
34.9 |
(59.5) |
68.8 |
72.6 |
HP finance leases initiated |
0.0 |
0.0 |
0.0 |
0.0 |
||
Other |
0.0 |
0.0 |
(0.0) |
(0.0) |
||
Closing net debt/(cash) |
|
|
(59.5) |
68.8 |
72.6 |
93.3 |
Source: Company reports, Edison Investment Research
|
||||||||||||
|
||||||||||||
Research: TMT
Tinexta reported strong Q119 results, with c 10% organic revenue growth, c 32% organic EBITDA growth, 50% EPS growth and improving free cash flow (FCF) generation. All divisions contributed to profit growth and the acquisitions made in FY18 are performing well. Management has reiterated guidance for FY19, which appears conservative even though Q1 is a seasonally less important quarter. We maintain our forecasts for now but will review them later in the year.