Last close As at 05/08/2026
AUD0.79
▲ 0.04 (4.67%)
Market capitalisation
AUD213m
Research: Metals & Mining
The publication of the results of its initial scoping study on the Tunkillia project on 16 July puts Barton well on the road to executing its three-phase development strategy to achieve c 150,000oz gold production. The study posited a 5Mtpa bulk open-pit mine operating over 6.4 years to process 30.7Mt of material at an average grade of 0.93g/t Au to generate a pre-tax NPV7.5 of A$512m and an internal rate of return (IRR) of 40% at a gold price of A$3,500/oz, an average all-in sustaining cost of A$1,917/oz and an initial capital cost of A$374m. Barton is now advancing an optimisation review targeting further cost savings and mine life growth.
Barton Gold |
Special by name, special by nature |
Initiation of coverage |
Metals and mining |
2 September 2024 |
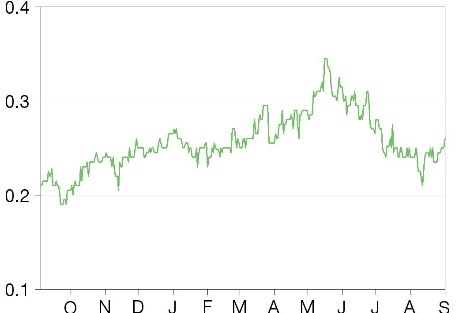
Share price performance
Business description
Next events
Analyst
Barton Gold is a research client of Edison Investment Research Limited |
|||||||||||||||||||||||||||||||||||||||||||||||
The publication of the results of its initial scoping study on the Tunkillia project on 16 July puts Barton well on the road to executing its three-phase development strategy to achieve c 150,000oz gold production. The study posited a 5Mtpa bulk open-pit mine operating over 6.4 years to process 30.7Mt of material at an average grade of 0.93g/t Au to generate a pre-tax NPV7.5 of A$512m and an internal rate of return (IRR) of 40% at a gold price of A$3,500/oz, an average all-in sustaining cost of A$1,917/oz and an initial capital cost of A$374m. Barton is now advancing an optimisation review targeting further cost savings and mine life growth.
Year end |
Revenue (A$m) |
PBT* |
EPS* |
DPS |
P/E |
Yield |
06/22 |
2.4 |
(4.1) |
(2.3) |
0.0 |
N/A |
N/A |
06/23 |
2.8 |
(5.7) |
(3.2) |
0.0 |
N/A |
N/A |
06/24e |
4.5 |
(5.4) |
(2.6) |
0.0 |
N/A |
N/A |
06/25e |
0.0 |
(9.6) |
(4.4) |
0.0 |
N/A |
N/A |
Note: *PBT and EPS are normalised, excluding amortisation of acquired intangibles and exceptional items.
Business plan and near-term optimisations
Barton intends to leverage its platform and its people to create performance in the form of a clear development pathway. Its immediate strategy will be to optimise its Tunkillia scoping study and then to convert it to a pre-feasibility study with a full equipment list, individually priced and incorporating built-in scale-up contingencies. Simultaneously, it will seek to recommission its Central Gawler Mill for an estimated cost of US$10m, to produce 25–50koz pa from Tarcoola from 2026 for minimal equity dilution (note that Barton’s mill is fully licensed). Phase 2 will involve the development of a new large-scale 5Mtpa high-efficiency mill at Tunkillia to put it into production, with its mill feed augmented by additional high-grade material from Tarcoola to increase output to c 150koz pa. The third and final phase of Barton’s business plan will be to explore for growth and also create low-risk optionality and grow future value by processing additional third-party ore through either (or both) of its mills, located c 200km apart in an emerging gold development region.
Valuation: A$0.65–0.96/share on a risked basis
We value Barton’s mill at A$0.46/share on an ‘as new’ replacement cost basis and at A$0.23/share on an ‘as is’ indemnity value basis. Hence, this asset alone more than covers Barton’s share price of A$0.26/share. At the same time, we estimate that Tunkillia’s pre-tax NPV7.5 of A$512m translates into a post-tax NPV7.5 of c A$322.6m, or A$1.48/share as a project on an un-risked basis. Adjusting for stage of development (ie scoping study or preliminary economic assessment, PEA), sovereign risk and the overall risk of commerciality of the project (in the form of its IRR), we calculate a value for Tunkillia of A$0.42–0.50/share based on EV/NPV multiples. Similarly, at the current (real) price of gold of US$2,510/oz, we estimate that the project could support a fund-raising of A$102.9m at the current share price (such that the net debt:equity ratio peaks at 2:1) and still return dividends to shareholders with an NPV10 of A$0.51/share. In the event that Barton is able to extend its operations’ lives indefinitely via exploration success however, we calculate that this valuation could rise to in excess of A$2.50/share (see Exhibit 27).
Investment summary
Company mission: Aiming to lead central South Australian gold
Named for Australia’s first prime minister who, along with others, led the movement for a federation of states and territories in large part owing to the significant westward immigration of voters during the Western Australian gold rush of the 1880s, Barton Gold is an Australian gold developer that boasts a JORC mineral resource of 1.6Moz Au and ownership of the only regional gold mill in the central Gawler Craton of South Australia. Its philosophy is to leverage its platform and its people to create performance in the form of a clear development pathway in the manner of bulk open pit developer, Capricorn Metals (ASX: CMM). Key to achieving this is crystallising an understanding of its assets to create optionality and to de-risk the intermediate development milestones on its execution pathway by building up its operating base sequentially in two key infrastructure phases and preserving its shareholders’ interests in the future by minimising equity dilution. Within this context, it is very clear that it is not looking to sell itself to generate value for shareholders and that it does not need an acquiror to achieve its goals. In the three years since IPO, Barton has already differentiated itself in this fashion (among others), with little dilution relative to its peers, in part owing to an unusual track record of generating non-dilutive cash via asset monetisation – more than A$10m so far. On 16 July, it announced the results of an initial scoping study on Tunkillia. The study posited a 5Mtpa bulk open-pit mine operating over 6.4 years to process 30.7Mt of material at an average grade of 0.93g/t Au to generate a pre-tax NPV7.5 of A$512m and an IRR of 40% at a gold price of A$3,500/oz (US$2,300/oz), an average all-in sustaining cost (AISC) of A$1,917/oz (US$1,278/oz) and an initial capital cost of A$374m (US$249m) for processing and site infrastructure.
Valuation: A$0.65–0.96/share at today’s gold price
We value Barton’s mill at A$0.46/share on an ‘as new’ replacement cost basis and at A$0.23/share on an ‘as is’ indemnity value basis. These assets alone more than cover Barton’s share price of A$0.26/share. At the same time, we estimate that the Tunkillia project’s pre-tax NPV7.5 of A$512m translates into a post-tax NPV7.5 of c A$322.6m, or A$1.48/share as a project on an un-risked basis. Adjusting for stage of development (ie scoping study or PEA), sovereign risk and the overall risk of commerciality of the project (in the form of its IRR), we calculate a value for Tunkillia today in the range A$0.42–0.50/share, based on EV/NPV multiples and the input assumptions outlined above (see Tunkillia valuation section below). At Edison’s long-term gold price of US$1,794/oz (in real 2024 US dollar terms) and with no adjustment to costs, the valuation is lower and, we believe, unlikely to support a major capital programme (see Exhibit 11). However, in this respect, Barton’s scoping study at Tunkillia should be thought of as the first step in a pathway to profitable production, rather than an end in itself, and opens the gateway to multiple potential optimisations around comminution and power costs, to name but two, and an exploration programme to define additional pods of high-grade resources at both Tunkillia and Tarcoola. In the meantime, at the current price of gold (US$2,510/oz, we estimate that the project could support an equity fund-raising of A$102.9m in FY26 at the current share price (such that the net debt:equity ratio peaks at 2:1) and still return dividends to shareholders with an NPV10 of A$0.51/share in 1 July 2024 money terms. At the very least, we believe that this ‘mark-to-market’ type valuation could form the basis of an alternative approach to development, including the issue of revenue protection.
Sensitivities: Notable gearing to incremental higher-grade ore
Edison’s un-risked post-tax project NPV7.5% estimate of A$322.6m (or A$1.48/share) changes by an average of A$136.1m (or 42%) for every 10% by which the gold price diverges from its assumed price of US$2,333/oz (A$3,500/oz), while it changes by A$68m (or 21%) for each 10% by which operating costs (excluding selling costs) diverge from their assumed levels. However, it changes by a more modest 11% for every 10% by which initial capex changes. These sensitivities are more muted for Edison’s discounted dividend flow valuation of Barton Gold (based on the execution of Tunkillia) owing to the effect of future assumed dilution, and amount to ±A$0.16/share (±31%) for every 10% by which the gold price diverges from its assumed level, ±A$0.07/share (±14%) for every 10% by which costs diverge from their assumed levels and ±A$0.04/share (±8%) for every 10% by which initial capex diverges from its level. Adding 1.8% additional ore at a 1.2% higher grade (over the life of mine) to the mill feed would also increase Tunkillia’s valuation by c 8% in the form of effectively costless, free revenue. This is corroborated in Barton’s Tunkillia scoping study, which emphasises the potential upside of slightly higher grade via a high-efficiency mill; its ‘Starter Pit’ is modelled to have a grade of 1.26g/t Au (c 35% higher than the life of mine average of 0.93g/t) with a resulting cash cost of production of A$1,235/oz (US$823/oz) – ie very competitive, globally. Inevitably, our valuation of the company is also sensitive to the extent to which it raises future equity and the price at which it does so (see Exhibits 24 and 25). However, it is also very sensitive to the extent to which management is able to extend its operations’ lives. In the event that it is able to extend the company’s assets’ operational lives ad infinitum in a manner that approximates the performance of Tunkillia in the period FY32–35, for example, we calculate that its valuation rises to A$1.35/share currently and to in excess of A$2.50/share in FY32, when its corresponding P/E ratio (assuming that this valuation is achieved) would be 19.1x (ie comparable to its peers’ ratings).
Financials: Enough to get to the next phase
On 30 June 2024, Barton reported that it had A$10.25m in cash on its balance sheet plus a further A$4.5m in interest-bearing deposits posted as security for rehabilitation performance bond guarantee facilities. At its current quarterly burn rate, this cash position should be sufficient to fund Barton through at least one additional year of operations, before any further fund-raising is required. In the meantime, we note that Barton has a consistent track record of generating cash from its existing asset base – more than A$10m to date since IPO – and we expect to see this as a continued focus.
Company description: South Australia focus
Barton Gold is an Australian gold developer listed on the ASX, OTCQB and Frankfurt stock exchanges. It boasts a JORC mineral resource of 1.6Moz Au, ownership of the only regional gold mill in the central Gawler Craton of South Australia and is targeting future gold production of c 150,000oz annually.
Its principal assets, located in central South Australia, are Tunkillia (a large-scale, long-term production opportunity), Tarcoola (a high-grade, past producing mine) and the Central Gawler Mill, approximately 90km north-west of Tarcoola and 170km north-west of Tunkillia.
|
Exhibit 1: Barton Gold’s South Australian assets |
Exhibit 2: Principal Barton Gold tenements |
|
|
|
Source: Barton Gold |
|
Exhibit 1: Barton Gold’s South Australian assets |
|
|
Source: Barton Gold |
|
Exhibit 2: Principal Barton Gold tenements |
|
|
Source: Barton Gold |
History
Regional history
Whereas gold had been discovered in New South Wales as early as the 1820s, it was not until January 1846 that first gold was discovered in South Australia, near Castambul in the Adelaide Hills – South Australia only having been settled as recently as 1836. As such, South Australia was experiencing its earliest gold finds at the same time that New South Wales and Victoria were experiencing their first major gold rushes in 1851. While the Castambul discovery proved to be something of a flash in the pan, payable gold was found in May 1852 at Echunga, in the area of Chapmans Gully and Donkey Gully (also in the Adelaide Hills). After an initial burst of productivity however, with an estimated c 4,000oz having been produced in the four months between September 1852 and January 1853, production from these areas began to tail off and diggers departed for the richer fields in Victoria. There were further discoveries of gold in the Echunga area in 1853, 1854, 1855, and 1858 causing minor rushes and then a major one in September 1868, when gold was discovered at Jupiter Creek. The Barossa goldfield was discovered in late 1868 when a prospecting party found alluvial gold in Spike Gully and recovered c 100,000oz gold. During 1869 reef mining was introduced and further discoveries were made at Para Wirra in 1869, Birdwood, Ulooloo and Algebuckina in 1870, Waukaringa in 1873 and Woodside in 1879. Other discoveries were also made at Balhannah, Forest Range and Mount Pleasant. The discovery of Broken Hill just across the border in New South Wales led to the extension of the railway out of Adelaide from Peterborough to Cockburn in 1887 contributing to discoveries at Manna Hill, Teetulpa, Kings Bluff, Wadnaminga and Mount Grainger between 1885 and 1891. Although it was nearly deserted only three years later in 1889, the (alluvial) Teetulpa field in particular yielded an estimated c 100,000oz Au. Up to that point, the Echunga goldfields were South Australia’s most productive and, around the turn of the century, estimated gold production from these fields was c 200,000oz per annum. That was the moment that outcropping gold was discovered at Tarcoola in October 1893, which was variously worked until the 1990s. More discoveries were made at Deloraine in 1909 and at Mongolata in 1930 and a further c 120,000oz Au was recovered as a by-product of copper mining in the region.
Tarcoola history
Total recorded historical production from the Tarcoola underground was estimated to be c 77,000oz at an average grade in the region of 37.5g/t (>1opt). The underground mine was abandoned during the 1990s, when the price of gold fell towards c US$250/oz. Shallow, open-pit mining down to a depth of c 77m then produced a further c 35,000oz at a grade of c 3–4g/t in 2017-18 in a development around historical underground shafts (the Perseverance pit). In neither case however was anything other than cursory exploration performed around the high-grade shoots being mined. Note that the material produced during 2017–18 was processed through Barton’s Central Gawler Mill.
Barton Gold acquired the mining lease and exploration licences hosting the historical 1893 discovery and subsequent high-grade workings in late 2019 and has used new technology to remodel the geology under the existing Perseverance pit and across the c 15km of ground hosting the high grade historical goldfield. In conjunction with a drilling plan both along strike and through the pit floor, this has allowed it to identify additional shallow mineralisation in the Perseverance pit, at ‘Perseverance West’ (a new extension to the south/southwest of the open pit), as well to posit the existence of deeper mineralisation in the ‘Perseverance Deeps’ zone below the main open pit
|
Exhibit 3: Tarcoola Perseverance Mine long section with existing JORC block model and resources |
|
|
Source: Barton Gold |
Barton has spent three years mapping approximately 10–15km of structures below historical, high-grade workings and developing a new three-dimensional architectural model for the area – the first time that all of the known gold occurrences in the area have been put into a consistent structural framework. To date, it has identified four areas with known, significant footprints, albeit under cover. Its next step will be to identify the controls on mineralisation, to target untested areas under cover and to confirm new zones of mineralisation with a view to eventual high-grade development. Most recently, it has announced a discovery success at Tolmer (see Exhibit 4), confirming a new gold mineralised system of quartz veining within a broader zone of alteration.
|
Exhibit 4: Tarcoola regional targets |
|
|
Source: Barton Gold |
Tunkillia history
Tunkillia was acquired by Barton in late 2019/early 2020 and sits astride a kilometres-wide, Kalgoorlie-style, major shear zone, known as the Yarlbrinda Shear. To date, it accounts for well over 90% of Barton’s group-wide resources (see Exhibit 8).
|
Exhibit 5: Tunkillia district and licence areas showing major, regional features |
|
|
Source: Barton Gold |
Prior to Barton’s ownership, Tunkillia was subject to a number of shallow historical drilling campaigns, including one by AngloGold, between 1996 and 2005 (when the gold price was trading at historically low levels). Whereas the traditional interpretation of Tunkillia’s geology had been that its mineralisation was structurally bounded (or, at least, limited) and confined to the western margin of the shear zone, Barton quickly showed this assumption to be untrue. Subsequent drilling rapidly extended Tunkillia’s footprint to depth as well as identifying five new zones of mineralisation along strike, four of which have been converted to resources since October 2020 at an all-in cost of c A$15 per incremental resource ounce. Even so, current drilling has covered only c 10% of the shear margins contained within Barton’s licences with more than 20km of strike remaining to be tested along the same trend.
|
Exhibit 6: Tunkillia main project area and JORC resources |
|
|
Source: Barton Gold |
The areas of existing resource at Tunkillia were the subject of a recent scoping study to assess their amenability to bulk open-pit operations, the results of which were announced on 16 July 2024 (see below). In the meantime, Barton is conducting regional drilling on the neighbouring Tarcoola project, which has the potential to blend higher-grade material into the ‘base case’ mining and processing scenario, while preparing for follow up Tunkillia drilling for the optimisation of its study.
Tunkillia structure, potential and development
As it stands, Tunkillia is a continuous, disseminated body of mineralisation that appears amenable to bulk, open-pit mining. What makes it interesting is the concentration of high-grade gold in the middle of the deposit as well as the potential for depth extensions and repeating structures.
|
Exhibit 7: Tunkillia Area 223 cross section |
|
|
Source: Barton Gold |
Currently, approximately 80% of both the resource tonnes and ounces currently delineated at Tunkillia (see Exhibit 8) are within 200m of surface and c 20% start from c 35m of the surface. In addition, they appear biased to the centre of the mineralised structures, with 10–30m width of the 300m long Central zone (itself 80–100m wide) hosting model blocks with grades of up to 2–10g/t in the shallowest portions of the main deposit, just below the weathered supergene zone, which hosts c 277koz Au of the total resources (cf an average grade for the deposit as a whole of 0.91g/t). This dispersion of grade would suggest mining via an initial shallow, high-grade pit in the centre of the deposit. Indeed, Barton’s recent scoping study highlights a ‘Starter Pit’ modelled to have a grade of 1.26g/t Au (c 35% higher than the life of mine average grade of 0.93g/t Au) with a cash cost of production of A$1,235/oz (US$823/oz). The fresh zone of mineralisation, being c 80–100m across and continuous could very easily be exploited in the bulk open pit manner of a coal mine and would support a deepening of the initial pit (as shown in Exhibit 7).
Barton’s immediate focus is the optimisation of its initial scoping study for Tunkillia and regional exploration, targeting potential repeats of >1Moz Au mineralisation over 20–25km of untested shear zone on strike from the existing resources in Area 223 (under c 30m of cover). In the future however, it will test whether the six domains of mineralisation so far identified extend further at depth. It will also consider testing for iron oxide, copper, gold (IOCG) type mineralisation further to the east side of its exploration licences.
Resources
Barton’s goal is to develop a long-term project with bulk operating efficiencies and stable, reliable production and hence resources are modelled on a relatively conservative basis. For example, while mineralisation is known to extend below 400m at Tunkillia, a resource cut-off has been applied at 300m, representing the limit of Barton’s present exploration interest (at depth) and emphasising its focus on the identification of other shallow, large-scale deposits along strike with the potential to turn its future operations into a regionally significant production hub. Within this context, Barton’s group-wide resources are summarised below, in Exhibit 8.
Exhibit 8: Barton Gold group resources
Deposit/category |
Tonnes (Mt) |
Grade (g/t) |
Contained gold (koz) |
Tunkillia |
|||
Measured |
0.00 |
0.00 |
0.0 |
Indicated |
26.70 |
0.96 |
820.0 |
Inferred |
24.55 |
0.85 |
672.0 |
Total |
51.25 |
0.91 |
1,493.0 |
Tarcoola |
|||
Measured |
0.00 |
0.00 |
0.0 |
Indicated |
0.19 |
2.08 |
12.7 |
Inferred |
0.35 |
1.47 |
16.7 |
Total |
0.54 |
1.68 |
29.4 |
Challenger |
|||
Measured |
0.00 |
0.00 |
0.0 |
Indicated |
0.00 |
0.00 |
0.0 |
Inferred |
0.53 |
3.85 |
65.6 |
Total |
0.53 |
3.85 |
65.6 |
Grand total |
|||
Measured |
0.00 |
0.00 |
0.0 |
Indicated |
26.89 |
0.96 |
832.7 |
Inferred |
25.43 |
0.92 |
754.3 |
Total |
52.32 |
0.94 |
1,588.0 |
Source: Barton Gold, Edison Investment Research. Note: Cut-off grades are 0.4g/t Au (Tunkillia Area 223), 0.5g/t Au (Tunkillia Area 51), 0.4g/t Au (Tarcoola), 2.0g/t Au (Challenger). Totals may not add up owing to rounding.
More details regarding Barton’s resources are available on its website. In brief however, the current Tunkillia resource comprises two areas (Area 223 and Area 51), although the vast majority (92%) of resources are contained within Area 223. Further, each of Tunkillia’s areas comprise three mineralogical zones, namely the oxide zone, the transition zone and the fresh zone, with the vast majority of its resources (79%) being located in the fresh zone. All told therefore, 74% of Tunkillia’s and 69% of Barton’s total global resources are accounted for by the Tunkillia Area 223’s fresh zone.
Infrastructure: The Central Gawler Mill
The third of Barton’s three core assets is the Central Gawler Mill (see Exhibit 2) and its associated stockpiles. While not reflected on its balance sheet, Barton’s management commissioned an independent report in 2023 that valued the mill at in excess of A$100m (A$0.46/share) on an ‘as new’ replacement cost basis and in excess of A$50m (A$0.23/share) on an ‘as is’ indemnity value basis. Originally with a capacity of 200ktpa, the Central Gawler Mill was expanded to 650ktpa in 2008 via the addition of further leaching and crushing capacity. However, the gravity circuit was left unchanged (despite an estimated 60–70% of gold being mined at the neighbouring Challenger Mine being gravity recoverable). Hence, the mill incorporates only a single Knelson concentrator, where it probably should have a train of five to six.
The Central Gawler Mill remains on care & maintenance. In 2022, Barton dismantled and cleaned the gravity circuit as a precursor to the evaluation of a future optimisation and recovered c 1,400oz gold in c 11 dry metric tonnes of high-grade concentrates, which it recently sold for an initial payment of A$4.25m, plus an additional final payment subject to final recoveries (likely in Q125).
In addition to the infrastructure of the mill itself, Barton also acquired a number of stockpiles, including a small, high-grade stockpile and a larger, low-grade one, the attributes of which are summarised below:
■
The small, high-grade stockpile comprises principally mill scats, which are mill screen oversize material that has been rejected from the grinding circuit for additional crushing because it contributes to higher (and inefficient) energy consumption within the mill. Whereas the impression of previous management was that the mill scats were hard and low grade, on account of their operating environment, Barton believes that the intrinsically low-grade material has been coated with high-grade slurry and is reviewing potential recovery options.
■
The low-grade stockpiles amount to c 300kt of materials located both adjacent to the Central Gawler Mill and Tarcoola’s Perseverance open pit mine. These materials represent potential for selective processing or use as initial materials for the start of a ‘Stage 1’ operation using the Central Gawler Mill – both options that are currently under review by Barton.
Management
Barton’s team might be best described as a cohort of professional investors and asset managers who are currently running a fleet of drill rigs to advance a long-term strategic development pathway. It is led by Alexander (Alex) Scanlon, the company’s founder, CEO and managing director, whose official biography is on the back page of this report. Alex’s background is essentially financial, having read for two undergraduate honours degrees in economics and finance at Santa Clara University before moving on to complete two master’s degrees in financial economics and management at Oxford and Cambridge Universities, respectively.
Before attending graduate school, he was trading real estate investment trusts (REITs) in the leveraged real estate bull market of the early to mid-2000s and then, later, had the foresight to short the housing market in 2007. He then joined Barclay Capital’s lucrative, London-based principal investments team, structuring large-scale, cross border principal investments on behalf of the bank.
After moving to Australia, his focus returned to real assets and specifically the natural resources industry. He was co-founder of the multi-billion-dollar York Potash Project (subsequently sold to Sirius Minerals and then onward to Anglo American) before becoming the head of natural resources at a boutique merchant banking team focused on structured credit and equity solutions for corporate clients. In 2016, he established private, multi-family office PARQ Capital with a focus on principal investments driven by long-term macro-economic trends and structural market changes.
Within this environment, he was able to perceive a similar building up of inflationary pressures and policies in western economies which fuelled the global financial crisis of 2008–09 – a pressure that he reasoned would only be exacerbated by a likely fragmentation of the global economy and predictable increase in international trade friction that was implicit in both the UK’s Brexit referendum and the election of Mr Trump as US president in 2016. His strategy settled upon pursuing under-recognised, large-scale gold exploration and development opportunities in tier 1 jurisdictions. He also recognised that access to good infrastructure – whether by ownership or rights of use – would be a key leverage point. After a period of time researching opportunities in Australia from both Western Australia (WA) to Queensland (QLD), he settled on South Australia after being asked to review some distressed assets – some of which he now controls via Barton.
Among other factors, he recalls a perceived mismatch between South Australia’s considerable share of Australia’s known gold resources (c 25%) and its share of national production (c 2.5%), something which his research indicated was in large part attributable to the rapid decline of gold prices and the coincident boom in South Australian copper investment during the 1990s. The result was the availability of substantial tenure in a 130-year-old high-grade gold district, covering the majority of ground of historical interest, an established and fully permitted mill, with indications of an as yet unrecognised but significant geological endowment waiting to be unlocked. The result, thus far, is a near tripling of the JORC resources on Tunkillia’s ground from c 600koz Au to c 1.6Moz Au, which has now emerged as a robust cornerstone to Barton’s long-term regional development strategy.
Since then, Alex has collected a team around him with close to three centuries of experience discovering, permitting, financing, building and operating major mining assets, with a notable pedigree in South Australia and gold mining and exploration. Among the senior leadership there is a notable contingent from the legendary Normandy Mining, which was Australia’s (and the southern hemisphere’s) largest gold producer at c 2.5Moz pa before its acquisition by Newmont in 2002. Notably, all but two of Barton’s team (non-executive director Graham Arvidson and company secretary Shannon Coates) are South Australian natives or long-term transplants and its principal geologists are seasoned gold and IOCG exploration managers. A strategy to build up a local team passionate about South Australian development is core to Barton’s strong South Australian identity and no doubt accounts, in part, for its significant local government support.
Brief biographies of several key leadership personnel are as follows:
Ken Williams, non-executive chairman
Ken has more than 30 years of corporate experience and over 20 as an exploration company director, including nine as director and chair of AWE. From 1999–2003, he was group treasurer, then CFO and then group finance executive for Normandy Mining. He is currently chair of Nova Systems and a non-executive director of Archer Materials. He is a graduate of the University of Western Australia (BSc economics honours) and Macquarie University (MApplFin), is a fellow of the Australian Institute of Company Directors (AICD) and is a member of the Council of the University of Adelaide.
Nicola Frazer, chief financial officer
Nicola is a chartered accountant with over 25 years’ corporate finance, accounting, investor relations, commercial development and grant funding experience in South Australia’s mining and oil & gas sectors. Prior to joining Barton, she was a manager of business development and investor relations for Normandy Mining from 1998–2007. She was also senior commercial adviser at Beach Energy from 2009–20 and, most recently, an associate director with KPMG’s Government Incentives and Grants where she focused on securing non-dilutive State and Federal Government funding incentives for the development of South Australia.
Kim Russell, new development general manager
Barton’s most recent senior recruit, Kim is a mining engineer with c 30 years’ experience in the development and operation of large-scale open-pit gold, iron ore, base and speciality metals projects and in project finance and mergers and acquisitions. He specialises in feasibility studies and new mine development. Most recently, he was head of mining operations for Rex Minerals’ South Australian greenfields Cu-Au Hillside Project and, before that, was manager of technical services for Harmony Gold in Papua New Guinea. Among others, he has managed the feasibility analysis and implementation of Pilbara Minerals’ Pilgangoora lithium operation and has also served as an associate director for PCF Capital (Argonaut), focused on due diligence and project financing. He holds a bachelor of engineering (mining) with first class honours, a master’s degree of applied finance and investment and a South Australian First Class Mine Manager’s Certificate of Competency. Based in Adelaide, he will lead Barton’s Tunkillia gold project through optimised scoping studies in advance of prospective feasibility studies, planning and execution of key asset monetisation initiatives and the implementation of existing brownfields and new greenfields mining projects as Barton develops a new large-scale gold industry in the central Gawler Craton.
Marc Twining, general manager exploration
Marc is a geologist of more than 25 years’ experience in resource development and extensive experience in South Australia, including gold, copper and copper-gold exploration. Previously, he worked as an exploration geologist for both Normandy Mining and Newmont, as exploration manager for a suite of junior exploration companies and as senior principal geoscientist for the Geological Survey of South Australia. As such, he has played lead roles in the discovery, feasibility analysis and regulatory permitting of a number of significant mineral deposits. He is a graduate of the University of Adelaide (BSc geology honours), obtained a Graduate Certificate of Finance (Macquarie University) and is a member of the Australasian Institute of Mining and Metallurgy (AusIMM), the Australian Institute of Geoscientists (AIG) and the Society of Economic Geologists.
Ian Garsed, principal geologist
Ian is a geologist with more than 25 years’ industry experience ranging from early-stage exploration through to resource delineation and project evaluations, with a particular emphasis on gold and base metals. He has extensive experience in South Australia exploring for gold and IOCG mineralisation including as general manager of exploration for Minotaur Exploration. Within these positions, he has played lead roles in the discovery and definition of multiple iron ore, polymetallic, copper/gold and gold deposits throughout Australia. He is a graduate of Ballarat College (BSc geology) and Curtin University (MSc mineral exploration technologies) and is a member of the AIG and the Geological Society of Australia.
David Wilson, general manager projects
David is a project manager and surveyor with more than 40 years’ experience, the majority of which has been in Australasian resources. David has played leading roles in both open-pit and underground mine planning and development. He was previously chief surveyor for Normandy’s (subsequently Newmont’s) underground Tanami and open-pit Waihi gold mines. Latterly, he became the technical services superintendent for Tanami and spent four years in Normandy/Newont’s influential continuous improvement team. He was also mine superintendent for Polymetals’ White Dam gold mine in South Australia. He is a graduate of the University of South Australia (BTech surveying) and also holds a graduate diploma in mining from the University of Ballarat and a graduate diploma in finance and investment from the Securities Institute of Australia.
Corporate history and philosophy: People and platform
Barton’s philosophy is not that of a typical gold junior. In terms of its modus operandi, its intention is to leverage its platform and its people to create performance in the form of a clear development pathway. In the first instance, this has meant identifying mineralised belts, finding trends and growing resources. As this has been achieved, it has evolved into a programme of more tightly spaced drilling, resource updates and parallel economic studies.
In the meantime, its broad starting platform is its control of the principal operable assets in the region in the form of two existing and fully permitted brownfield mines and the Central Gawler Mill. Key to achieving its performance is crystallising an understanding of its assets to create optionality and to de-risk the intermediate development milestones on its pathway to execution by building up its operating base sequentially and preserving its shareholders’ interests in the future by minimising current and future equity dilution. As such, it is very clear that it is not looking to sell itself to generate value for shareholders and that it does not need an acquiror to achieve its goals.
Recent company history
The company acquired its gold projects in South Australia during late 2019/early 2020 and then privately raised more than A$10.0m and began exploration across its c 5,000km2 land package. In June 2021, it listed and raised A$15m on the ASX via an initial public offering at a price of 25c. Since then, it has only raised a further A$3.5m in a placing to gold specialist institutional investors in FY23 and A$3m to several of these same investors during FY24. Its ability to issue such a small amount of equity is, in large part, attributable to a significant track record of asset monetisation since IPO, having generated more than A$10m in non-dilutionary cash, cash via asset disposals, leasing of its facilities to third parties, South Australian State and Australian Federal Government grant programmes and the production of more than 2,000oz gold at its mill (see Infrastructure: The Central Gawler Mill, above). Of this, it has already realised a series of strategic sales amounting to A$1.0m in FY22, A$0.5m in FY23 and A$4.3m in FY24 (with a further sum expected to be received in early FY25). Significantly however, aside from small (and heavily oversubscribed) Share Purchase Plans allowing its currently eligible investors to acquire new shares alongside incoming institutional investors, there have been no retail equity placings and as such its significant and growing base of retail investors are on the share register of their own volition. As such, Barton has worked to minimise dilution and to preserve its shareholders’ present interests in the future economic development of the company. To some extent, the success of this strategy may be judged by the notable success of its most recent Share Purchase Plan during April 2024 in which it had hoped to raise A$1m but ended up closing early after raising A$2.25m in only one week. At the time of writing therefore, Barton is well capitalised with approximately A$10.3m in cash (as at 30 June 2024) plus a further c A$4.5m in interest-bearing deposits posted for rehabilitation performance bond guarantee facilities plus an additional potential payment to be received further to the recent processing and sale of the gold-bearing materials recovered from its Central Gawler Mill. Noting Barton’s consistent track record of asset monetisation, we might expect to see continued internal generation of non-dilutive cash in the future.
Shareholder register: Strong support for consistent performance
Management regards one of its critical functions as standing between its investors and the threat of potential dilution. Its ability to achieve this through capital efficiency and asset monetisation initiatives is a key differentiator for Barton relative to most of its listed peers and investors (including retail investors) appear to have noticed. Compared with the c 500 retail investors with which it went public in 2021, Barton estimates that its retail shareholder register had expanded to approximately 1,100 by January of this year as a result of deliberate, on-market purchases, rather than directed retail equity placings. This has now grown rapidly (via on-market purchases only) to approximately 1,900 retail investors (management estimate) in the aftermath of this year’s March-July publication of a 1.5Moz Au Tunkillia resource, another successful placing to notable specialist institutional investors (which saw Collins Stret Asset Management emerge with a 6.9% stake, which it has subsequently grown to c 8% via further on-market purchases as recently announced) and the rapid follow-up publication of an initial scoping study for a cost-competitive 130,000oz Tunkillia operation. As a result, its share register is roughly equally split between board and management (21%), high-net-worth individuals and family offices (c 28% of shares in issue – many of which are known to management), institutions and corporates (c 26% – many of which are specialists in the sector with direct mining experience) and a relatively tight book of general retail investors (c 25%), all of whom specifically want to be there and are not simply legacy holders of a rebooted shell and directed equity placings. Relative to the only 25% increase in the number of shares in issue since IPO over three years ago, the near quadrupling of retail investors on the register indicates the broad appeal of Barton to cost and dilution cautious investors hoping to back a team that can deliver differently and the amount of potential gold-focused energy waiting behind Baton’s securities in the event of a shift back to more favourable conditions for global gold equities – as attested to by the aggressive response to Barton’s April 2024 Share Purchase Plan.
Other key differentiators
In addition to a track record of low dilution, Barton differentiates itself from its peers on a number of other factors, including its focus on leveraging the regional infrastructure of South Australia, generating revenues that offset (and even fully cover) its corporate overhead costs and its alignment of management and shareholder interests with a goal to preserving tomorrow’s success for today’s holder. To this end, since IPO, it has raised capital only from sophisticated, strategic, long-term investors and its existing shareholders in self-managed placings with low costs and discounts, has indulged in no specific or general retail equity placings and has minimised its net cash burn rate from non-project costs. The result is a successful track record of minimised dilution and therefore the maximum preservation of its historical shareholders’ interests in its future economic potential. As a result, management argues that Barton Gold is not simply a high-risk proxy for the gold price and that this is attested to by its shares’ divergence from, and performance relative to, a series of mining equity indices since its floatation in June 2021 (see Exhibit 9, below):
|
Exhibit 9: Barton Gold share price versus a selection of mining equity indices, rebased (underlying data in US$) |
|
|
Source: Edison Investment Research (underlying data: LSEG Data & Analytics). Note: Dropped scale on the y-axis. |
Analogue
In developing Tunkillia and its wider South Australian assets, Barton is seeking to mimic, among others, the success of Capricorn Metals’ development of the Karlawinda project in WA and its planned, lookalike development of the Mt Gibson Gold Project (also in WA). In brief, Capricorn acquired Karlawinda in late 2015 and navigated it through a series of resources upgrades, before putting it into production in mid-2021 and achieving steady-state production in mid-2022, with the result that its shares, in US dollar terms, have outperformed the gold price by 1,889.6% (ie a factor of 19.9x) since 1 January 2015:
|
Exhibit 10: Capricorn Metals share price versus five mining equity indices, rebased (underlying data in US$) |
|
|
Source: Edison Investment Research (underlying data: LSEG Data & Analytics) |
Capricorn is continuing to grow its resource base as well as putting a second mine into production at Mt Gibson. In the meantime, Karlawinda is operating at or near its 4.5Mtpa nameplate capacity and producing at a rate of 120koz gold per annum at an AISC in the range A$1,300–1,500/oz – one of Australia’s lowest.
Barton has followed a nearly identical pre-studies resource growth pathway (from c 600koz of c 1.5Moz Au at 0.9g/t Au) and has now completed an initial scoping study which, inflation adjusted, looks very similar to Karlawinda’s delivered production scale and capital and operating costs.
Business plan
Having acquired every significant historical gold exploration and production asset, including the only available mill in the vicinity, Barton’s goal is to build a regional and sub-regional platform to support production of c 150koz pa. Operationally, its focus is on open-pit operations to provide it with flexibility and the ability to scale capex and opex to inflationary pressures, with a particular emphasis on volumetric efficiencies. It perceives its pathway to production in three phases:
■
The first phase is to recommission its Central Gawler Mill for an estimated cost of US$10m to produce c 25koz (possibly up to 50koz) pa from Tarcoola from 2026 for minimal equity dilution. This is anticipated to generate positive free cash flow, leveraging the value of its infrastructure for credit funding, while avoiding material equity dilution (note that Barton’s mill is fully licensed and has been used to treat high-grade material from Tarcoola as recently as 2018). At the same time, Barton would continue to explore Tarcoola’s lattice of high-grade targets, while advancing the Tunkillia development process funded by Tarcoola’s positive free cash flow (NB see ‘Tunkillia scoping study results’ below). As such, this Phase 1 production option is a lower-cost, lower-risk – and ostensibly lower dilution – bridge to Phase 2.
■
Phase 2 will then involve the development and commissioning of a new, large-scale 5Mtpa, high-efficiency mill at Tunkillia, with its mill feed augmented by additional high-grade material from Tarcoola to increase output to c 150,000oz pa.
■
The third and final phase of Barton’s business plan will be to explore for growth and also to create low-risk optionality and grow future value by processing additional third-party ore through either (or both) of its mills, located c 200km apart in an emerging gold development region.
Barton is also contemplating prospective regional partnerships for key energy and logistics infrastructure that could deliver not only additional savings (and profitability) to its own operations but also provide it exposure to a growing network of regional developments.
Development and developmental timelines and milestones
Barton’s ambition is to achieve production of 125–150koz pa via bulk, lower-grade production from Tunkillia blended with complementary high-grade ore from Tarcoola. Subject to the usual caveats regarding timelines, Barton’s ambition for achieving its targets is as follows:
■
To validate high-grade ‘Stage 1’ feed and ‘Stage 2’ blending mineralisation at Tarcoola in 2024 and 2025.
■
To return the existing Central Gawler Mill to production in 2026. Note that, in the event of Barton proving the viability of processing the existing low-grade stockpiles at Tarcoola, it is possible that the mill could be brought back into production earlier (and potentially just partially to produce the high grade concentrates that Barton has experience selling).
■
To ramp the Central Gawler Mill up to an annual production rate of 25–50ktpa in the six to 12 months following the mill’s recommissioning.
■
To bring Tunkillia into production in c 2028 at a rate of 125koz pa or greater to bring group production into the range 125–150koz pa.
Tunkillia: Initial scoping study results
On 16 July, Barton announced the results of an initial scoping study on Tunkillia. The study posited a 5Mtpa bulk open-pit mining and processing operation, the highlights of which are as follows:
■
Initial 6.4-year life-of-mine and a total project life of around eight years (including construction), with a total of 30.7Mt of material processed at average grades of 0.93 g/t Au and 2.52 g/t Ag.
■
The project would be led by a higher-grade ‘Starter’ pit that would feed an initial 4.9Mt ore to the plant at elevated grades of c 1.26 g/t Au and c 3.32 g/t Ag. Total production from the Starter pit would be c 181koz Au and c 420koz Ag at a very low cash cost of c A$1,235/oz (US$823/oz) to generate average operating cash flow of c A$2,265/oz Au or c A$396m in total from that initial pit alone (net of Ag credits – Barton Gold estimate).
■
Total life of mine payable metal of c 833koz Au and c 1,993koz Ag, produced at an average rate of c 130koz Au and c 311koz Ag per annum, and all at an average AISC of c A$1,917/oz Au (net of by-product credits), which would today rank Tunkillia a respectable 17th out of 47 Australian gold mining operations on the basis of AISC.
■
Average operating cash flow of c A$1,626/oz Au (net of by-product credits).
■
Initial infrastructure capex of A$374m, including A$70m for EPC services, before owner costs, pre-strip and contingencies.
■
A pre-tax NPV7.5 of c A$512m, an IRR of 40% and a payback on initial capex of 1.9 years.
Barton’s management has been careful to emphasise that these results are an initial result only, based upon what they view as conservative input assumptions related (primarily) to the hardness of mined materials and power costs. Being a bulk mining and processing operation, these two factors are the primary contributors to both mining and processing costs and therefore operating cost as expressed in terms of AISC. The team is of the view that there are considerable opportunities to reduce these costs (reasonably), further improving already competitive AISC and financial return measures and also the life of mine (as these savings can be allocated to mining growth).
Edison has built its own initial financial model on the basis of the initial result and information supplied in Barton’s announcement and a summary of the similarities and difference between the two (based on both Barton’s assumptions and Edison’s assumptions) is provided in the table below.
Exhibit 11: Tunkillia scoping study results (real 2024 dollars)
Units |
Barton |
Edison* |
Variance (%) |
Edison** |
|
Economic assumptions |
|||||
Gold price |
(A$/oz) |
3,500 |
3,500 |
0.0 |
2,670 |
(US$/oz) |
2,333 |
2,333 |
0.0 |
1,780 |
|
Silver price |
(A$/oz) |
45.00 |
45.00 |
0.0 |
45.00 |
(US$/oz) |
30.00 |
30.00 |
0.0 |
30.00 |
|
Forex |
A$/US$ |
1.5000 |
1.5000 |
0.0 |
1.5000 |
Input cost assumptions |
|||||
Mining cost |
A$/t material mined |
2.64 |
2.64 |
0.0 |
2.64 |
Processing cost (oxide) |
A$/t processed |
23.57 |
23.57 |
0.0 |
23.57 |
Processing cost (fresh) |
A$/t processed |
25.57 |
25.57 |
0.0 |
25.57 |
Royalties (public and private) |
% |
6.0 |
6.0 |
0.0 |
6.0 |
Selling costs |
A$/oz Au |
37.32 |
37.32 |
0.0 |
37.32 |
General & administrative |
A$/t processed |
***3.73 |
***3.73 |
0.0 |
***3.73 |
Operating parameters |
|||||
Waste and low grade mined**** |
Mt |
191.5 |
191.5 |
0.0 |
191.5 |
Initial pre-strip |
Mt |
29.0 |
29.0 |
0.0 |
29.0 |
Mineral resources mined |
Mt |
30.7 |
30.7 |
0.0 |
30.7 |
Project strip ratio |
waste:ore |
6.23 |
6.24 |
+0.2 |
6.24 |
Operating strip ratio |
waste:ore |
5.29 |
5.29 |
0.0 |
5.29 |
Plant throughput capacity |
Mtpa |
5.0 |
5.0 |
0.0 |
5.0 |
Material processed |
Mt |
30.7 |
30.7 |
0.0 |
30.7 |
Gold recovery (oxide & sulphide) |
% |
*****90.5 |
90.3 |
-0.2 |
90.3 |
Silver recovery (all materials) |
% |
80.0 |
80.0 |
0.0 |
80.1 |
Life of mine gold grade |
g/t |
0.93 |
0.93 |
0.0 |
0.93 |
Life of mine silver grade |
g/t |
2.52 |
2.52 |
0.0 |
2.52 |
Production |
|||||
Contained gold |
oz |
919,868 |
920,925 |
+0.1 |
920,925 |
Contained silver |
oz |
2,491,148 |
2,487,371 |
-0.2 |
2,487,371 |
Payable gold |
oz |
832,852 |
832,000 |
-0.1 |
832,000 |
Payable silver |
oz |
1,992,919 |
1,992,000 |
-0.0 |
1,992,000 |
Economic outputs |
|||||
Life of mine revenues |
A$m |
3,005 |
3,002 |
-0.1 |
2,304 |
Life of mine cash operating costs |
A$m |
1,710 |
1,688 |
-1.3 |
1,646 |
Life of mine operating cashflows (EBITDA) |
A$m |
1,295 |
1,314 |
+1.5 |
658 |
C1 cash cost |
A$/oz |
1,660 |
1,660 |
+0.0 |
1,660 |
All-in sustaining cost |
A$/oz |
1,917 |
1,924 |
+0.4 |
1,874 |
Initial capex |
|||||
Processing and infrastructure (inc EPC) |
A$m |
374 |
374 |
0.0 |
374 |
Capitalised pre-strip |
A$m |
60 |
60 |
0.0 |
60 |
Owner’s costs |
A$m |
9 |
9 |
0.0 |
9 |
Owner’s contingency |
A$m |
18 |
18 |
0.0 |
18 |
Design growth contingency |
A$m |
32 |
32 |
0.0 |
32 |
Total |
A$m |
493 |
493 |
0.0 |
493 |
Sustaining and closure capex |
|||||
Sustaining capex |
A$m |
34 |
34 |
0.0 |
34 |
Mine closure and rehabilitation |
A$m |
20 |
20 |
0.0 |
20 |
Financial returns |
|||||
Project free cashflow (undiscounted) |
A$m |
806 |
844 |
+4.7 |
188 |
Pre-tax project NPV7.5 |
A$m |
512 |
509 |
-0.6 |
41 |
Pre-tax project IRR |
% |
40 |
38.1 |
-1.9pp |
10.4 |
Estimated post-tax project NPV7.5 |
A$m |
N/D |
322.6 |
N/A |
(8) |
Source: Barton Gold, Edison Investment Research. Note: *Edison model with Barton Gold input assumptions; **Edison model with Edison input assumptions; ***Including transport, refining, insurance etc; ****Includes pre-strip; *****Average of 25% oxide material at 92% recovery and 75% fresh material at 90% recovery.
Note that the potential working capital effects on cash flow have been ignored in Edison’s project valuation model (above) but have been taken into account in our company valuation model (below).
Tunkillia valuation considerations
Un-risked project valuation
Barton’s scoping study calculated a pre-tax IRR on the Tunkillia project of 40% and a pre-tax NPV7.5% of A$512m. Inasmuch as we are able to reconstruct Barton’s financial model and pre-tax valuation (the centre ‘Edison*’ column in Exhibit 11, above), we estimate that the equivalent post-tax NPV7.5% is A$322.6m. With 218.7m Barton shares in issue, this post-tax NPV estimate equates to A$1.48 per share.
Project valuation risked for two factors
Risk associated with Tunkillia may be assumed to comprise sovereign risk, execution risk, geological risk, metallurgical risk, engineering risk, management risk (possibly also including funding risk) and an overall risk of ‘commerciality’. Three of these risks – sovereign risk, execution risk (in the form of ‘stage of development’ risk – ie scoping study or PEA) and overall ‘commerciality risk’ – may immediately be adjusted for.
Sovereign risk
In our report Gold stars and black holes, published in January 2019, we calculated that companies with completed scoping studies commanded valuations between -4.8% and 50.7% of attributable project NPV, with an average of 11.7% (see Exhibit 166 on page 82 of the report).
According to the Fraser Institute, South Australia ranks in the top quartile of jurisdictions most attractive to mining investment, on a par with Finland and Idaho and above British Columbia and the Northwest Territories:
|
Exhibit 12: Fraser Institute survey of mining investment attractiveness, by jurisdiction (2023) |
|
|
Source: Fraser Institute |
The mean Fraser Institute investment attractiveness score for all jurisdictions is 56.56, which is between the scores for Serbia and California. If this is deemed to attract an average valuation of 11.7% of attributable NPV, and the top and bottom halves of the sample are presumed to attract valuations with respect to the average and pro rata to their scores, then a company with an average project in South Australia may be expected to attract a valuation of 33.9% of attributable project NPV. For Barton, this would imply a valuation of A$0.50/share for Tunkillia alone, excluding any contribution from its other assets (eg Tarcoola – see ‘Valuation modifying factors’, below).
Project valuation risked for overall commerciality
In Gold stars and black holes, we calculated a statistically significant relationship between the valuation of a company and its IRR, which is demonstrated in the graph below.
|
Exhibit 13: Company enterprise value as percent of attributable project NPV (%) versus project IRR (%) |
|
|
Source: Edison Investment Research |
On the basis of the Tunkillia project’s scoping study pre-tax IRR of 40%, therefore, Barton could be expected to command a valuation equivalent to 28.2% of its NPV, or A$0.42/share.
Alternatively, if a multiple regression analysis between IRR and Fraser Institute Investment Attractiveness scores and a company’s enterprise value/NPV ratio is performed and the resulting equation applied to Tunkillia, a 33.2% enterprise value/NPV ratio is predicted. This implies a valuation of A$0.49/share (ie between the other two risk-adjusted valuations of A$0.50/share and A$0.42/share).
Company valuation based on Edison assumptions
Edison’s long-term, real gold price forecast currently remains at US$1,794/oz – largely based on the assumption that, at some point, positive real interest rates must return to western economies in general and the US economy in particular. Over the period in which we would expect Tunkillia to be in production (FY29–35), we estimate the gold price will average US$1,780/oz in real 2024 US dollar terms, in which case – at the costs indicated in its scoping study – the project is somewhat marginal in terms of returns to shareholders. At the current price of gold however (US$2,510/oz at the time of writing), we estimate that it can support a fund-raising of A$102.9m in FY26 at the current share price (such that the net debt:equity ratio peaks at 2:1) and return dividends with an NPV10 of A$0.51/share shareholders in 1 July 2024 money terms.
|
Exhibit 14: Barton Gold EPS, maximum potential DPS and NPV of DPS, FY23–35 (Ac/share) |
|
|
Source: Edison Investment Research. Note: Based on the execution of Tunkillia project to the parameters set out in its initial scoping study only, using a spot gold price of US$2,510/oz and a 10% discount rate. |
From this level of A$0.51/share on 1 July 2024, we would expect the valuation of Barton to increase and to peak of A$0.91/share (also on 1 July 2024 in money terms) on the cusp of the company’s first potential dividend to shareholders in FY31.
Tunkillia valuation summary
Exhibit 15, below, summarises our valuation of Tunkillia on the basis of the six scenarios set out above:
Exhibit 15: Tunkillia valuation summary
Scenario |
Valuation (A$/share) |
Un-risked estimated post-tax NPV7.5% |
1.48 |
Ditto adjusted for: |
|
|
■ Sovereign risk |
0.50 |
|
■ IRR |
0.42 |
|
■ Sovereign risk and IRR |
0.49 |
Discounted dividend valuation** |
0.51 |
Scenario |
Un-risked estimated post-tax NPV7.5% |
Ditto adjusted for: |
|
■ Sovereign risk |
|
■ IRR |
|
■ Sovereign risk and IRR |
Discounted dividend valuation** |
Valuation (A$/share) |
1.48 |
0.50 |
0.42 |
0.49 |
0.51 |
Source: Edison Investment Research. Note: *See Exhibit 8. **Using spot gold price of US$2,510/oz and a 10% discount rate.
While each of these valuation methods have merits, we believe that the most appropriate of the five considered above is the discounted dividend valuation (applying a 10% discount rate) as this puts a present value on estimated potential future dividends derived from the project, as opposed to a calculated or observed EV/NPV ratio. Nevertheless, we also believe that the alternative methodologies provide important corroborating support for the valuation, given that they fall within a strikingly narrow range of A$0.46/share ±A$0.04/share.
Valuation modifying factors
Rather than being an end in itself, the scoping study at Tunkillia is an exercise that allows Barton to conservatively state a baseline valuation, as well as providing it with a basis for subsequent optimisation exercises. At this stage, the scoping study places Tunkillia approximately at the top of the bottom tercile in terms of costs, which is an attractive result, given the number of conservative assumptions adopted. It has also allowed management to identify capital and operational requirements with respect to the specific geometry of the project. Within this context, three areas of potential optimisation are especially prominent.
Comminution
The Tunkillia scoping study assumed a bond ball mill work index of 25.5kWh/t and a bond rod mill work index of 26.7kWh/t. This was derived from the hardest rock encountered by Barton at the project, sourced from a mafic dyke, but representing only 1–2% of the ore likely to require crushing in the mine plan. Energy accounts for c 50% of Tunkillia’s assumed costs. If the bond mill indices are c 20kWh/t, rather than c 25kWh/t, it would allow for a c 20% reduction in energy costs and a c 10% reduction in opex costs overall, worth c A$2.50/t or c A$100/oz Au produced. Alternatively, the scoping study assumed single stage crushing to 150mm. However, reduced grinding energy holds out the possibility for three-stage crushing and thereby reducing residence times in the carbon-in-leach (CIL) circuit and/or requiring fewer consumables, fewer grinding media and/or less high-specification media (eg chrome alloy, rather than steel). As a result, in the follow-up optimisation studies, either equipment sizes could be reduced or throughputs could be increased. As an example, Barton’s scoping study assumed A$15m in annual expenditure on mill linings and balls. However, a follow-up optimisation study is likely to consider both softer ore and longer-lasting grinding media, where the relationship between the input assumption and the potential cost saving is non-linear. Similarly, within the context of capital expenditure, Barton has assumed an initial A$40m for mill drums and a 14MW motor, neither of which would be required if the work indices are 20% lower than originally assumed in the scoping study.
Exploration
In addition to the financial and economic results, Tunkillia’s scoping study also demonstrated the operation’s significant gearing to grade, most obviously demonstrated in the operating cash margins earned at each of the four pits:
Exhibit 16: Grade (g/t) and operating cash flow margin (A$/oz Au) by pit
Operating metric |
Units |
Starter pit |
Main pit |
South 1 pit |
Area 51 pit |
All pits |
Grade |
(g/t) |
1.26 |
0.90 |
1.02 |
0.65 |
0.93 |
Operating cash margin |
A$/oz Au |
2,265 |
1,551 |
1,062 |
584 |
1,626 |
Source: Barton Gold
The same data may be expressed graphically, as follows:
|
Exhibit 17: Grade (g/t) cf operating cash flow margin (A$/oz Au) |
|
|
Source: Edison Investment Research |
This is where Barton’s other assets may prove significant multipliers of value. Although small in terms of ounces, Tarcoola, in particular, boasts a low-grade oxide stockpile with a grade of 1.20g/t, a low-grade sulphide stockpile with a grade of 1.40g/t and the Perseverance pit with a grade of 1.99g/t. If this material were to be added into Tunkillia’s mining plan at the rate of 270kt in year one at a grade of 1.68g/t (the average) and a further 270kt in year two at the same grade, displacing planned ore, then we estimate that it would have the following effect on our valuation of the project (all other things being equal).
Exhibit 18: Tunkillia augmented with high-grade Tarcoola material valuation summary
Scenario |
Uplift (%) |
Augmented valuation (A$/share) |
Baseline valuation (A$/share) |
Un-risked estimated post-tax NPV7.5% |
+8.8 |
1.61 |
1.48 |
Ditto adjusted for: |
|||
|
■ Sovereign risk |
+8.0 |
0.54 |
0.50 |
|
■ IRR |
+7.1 |
0.45 |
0.42 |
|
■ Sovereign risk and IRR |
+8.2 |
0.53 |
0.49 |
Discounted dividend valuation** |
+7.6 |
0.55 |
0.51 |
Source: Edison Investment Research. Note: *See Exhibit 8. **Using spot gold price of US$2,510/oz and a 10% discount rate.
In summary, adding 1.8% additional ore at a 1.2% higher grade (over the life of mine), to add 3.0% additional gold ounces to the mill feed, increases Tunkillia’s valuation by c 8% in the form of effectively costless, free revenue.
We estimate that exploration at Tarcoola has identified 170kt of resources at an average grade of 2.50g/t, adding 13.7koz to its gold inventory in FY24. In total however, Barton is targeting an additional c 40–50koz gold in higher-grade zones to be fed into the mill in the first two years of operation and potentially as much as 100koz to be fed into the mill over the operation’s full seven-year processing life. Early examples of this include potentially extending the Starter pit and deepening and smoothing the eventual Main pit floor. Whether early or late in the life of the operation however, we estimate that future exploration success and/or future optimisation studies have the potential to add materially to Tunkillia’s NPV7.5%.
Power
Tunkillia’s scoping study assumed that power would be provided to the project in the form of LNG, which is significantly greener than diesel. LNG use is common practice in WA, but much less so in South Australia, which has historically depended on diesel as a power source. Hence, Barton has assumed that LNG will be railed from WA at a delivered cost of A$19.60/GJ, which is close to the retail price. This contrasts with the wholesale price of c A$12.00/GJ. The opportunity therefore exists for Barton to purchase excess LNG in WA and sell it in South Australia. Given sufficient demand, it could even enter a partnership with an independent power supplier on the build-own-operate model for the provision of LNG to the state.
Financial engineering
Crudely, Barton’s operation at Tunkillia could be thought of as producing 100,000oz gold per annum at a cost of c 60,000oz gold per annum to leave a gross profit of 40,000oz gold per annum. One of management’s key skills is financing in difficult market conditions and, should market conditions over the next couple of years prove difficult, one option open to it would be to borrow against its projected 40,000oz pa annual profit. In itself, this would create a tax deferral and credit costs could be refinanced at a later stage. Selling into the Indian market (either the world’s largest or second largest market, depending on conditions), where concentrate sales may attract a payability rate as high as 98.25%, would then allow it to potentially leverage the gold concentrates import tax arbitrage between the two tax regimes.
Sensitivities
Exhibits 19–21 provide our estimate of the Tunkillia project’s empirical sensitivity to the gold price, unit costs and capital expenditure, as well as our see-through, discounted dividend valuation of Barton:
Exhibit 19: Tunkillia valuation sensitivity to the gold price
Gold price change (%) |
-20% |
-10% |
u/c |
+10% |
+20% |
Gold price (US$/oz) |
1,867 |
2,100 |
2,333 |
2,567 |
2,800 |
Post-tax NPV7.5% (A$m) |
50.0 |
186.7 |
322.6 |
458.5 |
594.4 |
Pre-tax IRR (%) |
16.0 |
27.7 |
38.1 |
47.6 |
56.5 |
Un-risked estimated post-tax NPV7.5% (A$/share) |
0.23 |
0.85 |
1.48 |
2.10 |
2.72 |
Discounted dividend valuation* (A$/share) |
0.20 |
0.36 |
0.51 |
0.67 |
0.83 |
Source: Edison Investment Research. Note: *Using spot gold price of US$2,510/oz and at a 10% discount rate.
Exhibit 20: Tunkillia valuation sensitivity to unit operating costs
Unit costs change (%) |
-20% |
-10% |
u/c |
+10% |
+20% |
Post-tax NPV7.5% (A$m) |
458.7 |
390.6 |
322.6 |
254.5 |
186.5 |
Pre-tax IRR (%) |
46.9 |
42.6 |
38.1 |
33.3 |
28.2 |
Un-risked estimated post-tax NPV7.5% (A$/share) |
2.10 |
1.79 |
1.48 |
1.16 |
0.85 |
Discounted dividend valuation* (A$/share) |
0.66 |
0.59 |
0.51 |
0.44 |
0.37 |
Source: Edison Investment Research. Note: *Using spot gold price of US$2,510/oz and at a 10% discount rate.
Exhibit 21: Tunkillia valuation sensitivity to capex
Capex change (%) |
-20% |
-10% |
u/c |
+10% |
+20% |
Post-tax NPV7.5% (A$m) |
393.3 |
357.9 |
322.6 |
287.2 |
251.8 |
Pre-tax IRR (%) |
50.8 |
31.6 |
38.1 |
33.3 |
29.1 |
Un-risked estimated post-tax NPV7.5% (A$/share) |
1.80 |
1.63 |
1.48 |
1.31 |
1.15 |
Discounted dividend valuation* (A$/share) |
0.60 |
0.56 |
0.51 |
0.47 |
0.43 |
Source: Edison Investment Research. Note: *Using spot gold price of US$2,510/oz and at a 10% discount rate.
Exhibit 22 provides our estimate of the project valuation’s sensitivity to a range of potential discount rates:
Exhibit 22: Tunkillia project valuation sensitivity to discount rate
Discount rate (%) |
0.0 |
5.0 |
7.5 |
10.0 |
15.0 |
20.0 |
25.0 |
Post-tax NPV7.5% (A$m) |
591.0 |
397.8 |
322.6 |
258.3 |
155.9 |
79.7 |
22.2 |
Un-risked estimated post-tax NPV7.5% (A$/share) |
2.70 |
1.82 |
1.48 |
1.18 |
0.71 |
0.36 |
0.10 |
Source: Edison Investment Research
Exhibit 23 similarly shows the variation in our discounted dividend valuation of the company based on a range of potential discount rates:
Exhibit 23: Barton Gold company valuation sensitivity to discount rate
Discount rate (%) |
0.0 |
5.0 |
7.5 |
10.0 |
15.0 |
20.0 |
25.0 |
30.0 |
Discounted dividend valuation* (A$/share) |
1.22 |
0.78 |
0.63 |
0.51 |
0.35 |
0.24 |
0.17 |
0.12 |
Source: Edison Investment Research. Note: *Using spot gold price of US$2,510/oz.
In addition to the above, our valuation of the company, in particular, is sensitive to both the amount of equity raised in future and the price at which it is raised. These are demonstrated in Exhibits 24 and 25:
Exhibit 24: Barton Gold valuation sensitivity to amount of future equity raised
Future equity raised (A$m) |
0.0 |
102.9 |
174.3 |
251.9 |
407.2 |
Maximum leverage* |
90.7 |
66.7 |
50.0 |
33.3 |
0.0 |
Equity (%) |
9.3 |
33.3 |
50.0 |
66.7 |
100.0 |
Discounted dividend valuation* (A$/share) |
1.13 |
0.51 |
0.41 |
0.35 |
0.29 |
Source: Edison Investment Research. Note: Using spot gold price of US$2,510/oz and at a 10% discount rate. *Defined as (net debt/[net debt+equity]).
Exhibit 25: Barton Gold valuation sensitivity to the price at which future equity is raised
Future equity raising price (A$/share) |
0.15 |
0.26 |
0.35 |
0.45 |
0.55 |
0.65 |
0.75 |
0.85 |
0.95 |
0.97 |
Discounted dividend valuation* (A$/share) |
0.35 |
0.51 |
0.62 |
0.71 |
0.78 |
0.84 |
89 |
0.93 |
0.97 |
0.97 |
Source: Edison Investment Research. Note: *Using spot gold price of US$2,510/oz and at a 10% discount rate.
Finally, our valuation is sensitive to the extent to which Barton is able to extend its life of operations from those set out in its initial Tunkillia scoping study. According to our analysis, the company will raise equity in FY26 (sensitivities shown above), will begin the development in FY27 (until FY29) and will begin commercial production from Tunkillia in FY29. In our base case discounted dividend scenario (ie raising A$102.9m in new equity in FY26), we estimate that it will pay off outstanding net debt in FY31 and that it will then generate an average of A$164.3m pa for the remaining four years of its life, which it will pay out as dividends at a rate of c A$0.27/share. In the event that it is able to extend this performance into the future, our valuation of the company varies as shown in Exhibit 26, below:
Exhibit 26: Barton Gold life of operations extension sensitivity (A$/share)
Scenario |
Valuation (A$/share) |
Incremental valuation change (A$/share) |
Discounted dividend valuation* (A$/share) |
0.51 |
|
Ditto (including exploration investment**) |
0.46 |
-0.05 |
+5yrs |
0.80 |
+0.34 |
+10yrs |
1.01 |
+0.21 |
+15yrs |
1.14 |
+0.13 |
+20yrs |
1.22 |
+0.08 |
Ad infinitum |
1.35 |
+0.13 |
Source: Edison Investment Research. Note: *Using spot gold price of US$2,510/oz and a 10% discount rate; **Assumed at a rate of A$6.2m pa.
Moreover, while an extension of Barton’s operations’ lives ad infinitum increases our valuation of the company today by A$0.84/share, from A$0.51/share to A$1.35/share, this valuation will continue to rise with time to settle at A$2.54/share from FY35 onwards (cf A$0.91/share in FY31 in the base case discounted dividend valuation – see Exhibit 14), as depicted in Exhibit 27 below:
|
Exhibit 27: Barton Gold maximum potential DPS and NPV of DPS, ad infinitum (A$/share) |
|
|
Source: Edison Investment Research. Note: Based on the ad infinitum extension of Barton’s operations, with Tunkillia at its core, using a spot gold price of US$2,510/oz and a 10% discount rate. |
Accepting the ad infinitum valuation shown in Exhibit 27, we calculate that Barton’s P/E ratio in the years FY29–34 (ie those for which we have full financial forecasts, based on the initial Tunkillia scoping study) would range from 9.2x in FY30 to 21.5x in FY34. This compares with Capricorn Metals’ current, forecast P/E range of 27.9–15.0x for FY24–26 (ie the same order of magnitude).
Financials
During Q424, Barton received a provisional payment of c A$4.25m in relation to the treatment, refining and sale of approximately 1,400oz gold contained in concentrates. Weighing, sampling, moisture determination and assays are currently anticipated to be completed in August 2024, and accordingly Barton anticipates the completion of a final payment relating to the sale in Q125. Excluding this one-off sale and equity issuance, Barton’s cash burn rate during the quarter was A$2.2m, including discretionary exploration expenditure focused on large-scale exploration programmes amounting to A$1.62m (including personnel). On 30 June 2024, Barton reported that it had A$10.25m in cash on its balance sheet plus a further A$4.5m in interest-bearing deposits posted as security for rehabilitation performance bond guarantee facilities. At its current quarterly burn rate, this cash position should therefore be sufficient to fund Barton through at least one additional year of operations, before any additional fund-raising is required.
Exhibit 28: Financial summary
A$'000s |
2022 |
2023 |
2024e |
2025e |
2026e |
2027e |
2028e |
2029e |
|||
June year end |
UK GAAP |
IFRS |
IFRS |
IFRS |
IFRS |
IFRS |
IFRS |
IFRS |
|||
PROFIT & LOSS |
|||||||||||
Revenue |
|
|
2,430 |
2,809 |
4,456 |
0 |
0 |
0 |
0 |
320,580 |
|
Cost of Sales |
(6,250) |
(8,039) |
(9,744) |
(9,744) |
(9,744) |
(9,744) |
(9,744) |
(111,583) |
|||
Gross Profit |
(3,820) |
(5,230) |
(5,288) |
(9,744) |
(9,744) |
(9,744) |
(9,744) |
208,997 |
|||
EBITDA |
|
|
(3,820) |
(5,230) |
(5,288) |
(9,744) |
(9,744) |
(9,744) |
(9,744) |
189,243 |
|
Operating Profit (before amort. and except.) |
|
(3,912) |
(5,358) |
(5,439) |
(9,895) |
(9,895) |
(9,895) |
(9,895) |
138,156 |
||
Intangible Amortisation |
0 |
0 |
0 |
0 |
0 |
0 |
0 |
0 |
|||
Exceptionals |
0 |
0 |
0 |
0 |
0 |
0 |
0 |
0 |
|||
Other |
0 |
0 |
0 |
0 |
0 |
0 |
0 |
0 |
|||
Operating Profit |
(3,912) |
(5,358) |
(5,439) |
(9,895) |
(9,895) |
(9,895) |
(9,895) |
138,156 |
|||
Net Interest |
(193) |
(320) |
(7) |
308 |
86 |
(229) |
(9,351) |
(38,566) |
|||
Profit Before Tax (norm) |
|
|
(4,105) |
(5,678) |
(5,446) |
(9,587) |
(9,809) |
(10,124) |
(19,246) |
99,589 |
|
Profit Before Tax (FRS 3) |
|
|
(4,105) |
(5,678) |
(5,446) |
(9,587) |
(9,809) |
(10,124) |
(19,246) |
99,589 |
|
Tax |
0 |
0 |
74 |
0 |
0 |
0 |
0 |
(29,877) |
|||
Profit After Tax (norm) |
(4,105) |
(5,678) |
(5,372) |
(9,587) |
(9,809) |
(10,124) |
(19,246) |
69,712 |
|||
Profit After Tax (FRS 3) |
(4,105) |
(5,678) |
(5,372) |
(9,587) |
(9,809) |
(10,124) |
(19,246) |
69,712 |
|||
Average Number of Shares Outstanding (m) |
175.6 |
176.0 |
204.5 |
218.7 |
416.6 |
614.6 |
614.6 |
614.6 |
|||
EPS - normalised (c) |
|
|
(2.3) |
(3.2) |
(2.6) |
(4.4) |
(2.4) |
(1.6) |
(3.1) |
11.3 |
|
EPS - normalised and fully diluted (c) |
|
|
(2.3) |
(3.2) |
(2.4) |
(4.0) |
(2.3) |
(1.6) |
(3.0) |
11.0 |
|
EPS - (IFRS) (c) |
|
|
(2.3) |
(3.2) |
(2.6) |
(4.4) |
(2.4) |
(1.6) |
(3.1) |
11.3 |
|
Dividend per share (c) |
0.0 |
0.0 |
0.0 |
0.0 |
0.0 |
0.0 |
0.0 |
0.0 |
|||
BALANCE SHEET |
|||||||||||
Fixed Assets |
|
|
14,151 |
14,374 |
14,482 |
14,332 |
14,181 |
178,364 |
424,713 |
456,692 |
|
Intangible Assets |
13,757 |
13,782 |
13,814 |
13,814 |
13,814 |
13,814 |
13,814 |
13,814 |
|||
Tangible Assets |
394 |
592 |
668 |
518 |
367 |
164,550 |
410,899 |
442,878 |
|||
Investments |
0 |
0 |
0 |
0 |
0 |
0 |
0 |
0 |
|||
Current Assets |
|
|
11,782 |
10,719 |
10,862 |
1,426 |
89,554 |
200 |
200 |
52,898 |
|
Stocks |
0 |
0 |
0 |
0 |
0 |
0 |
0 |
26,349 |
|||
Debtors |
427 |
68 |
409 |
0 |
0 |
0 |
0 |
26,349 |
|||
Cash |
11,200 |
10,451 |
10,253 |
1,226 |
89,354 |
0 |
0 |
0 |
|||
Other |
155 |
200 |
200 |
200 |
200 |
200 |
200 |
200 |
|||
Current Liabilities |
|
|
(573) |
(842) |
(149) |
(149) |
(149) |
(149) |
(149) |
(8,584) |
|
Creditors |
(573) |
(789) |
(153) |
(153) |
(153) |
(153) |
(153) |
(8,588) |
|||
Short term borrowings |
0 |
(53) |
4 |
4 |
4 |
4 |
4 |
4 |
|||
Long Term Liabilities |
|
|
(15,091) |
(15,548) |
(15,548) |
(15,548) |
(15,548) |
(100,500) |
(366,095) |
(372,625) |
|
Long term borrowings |
0 |
(60) |
(60) |
(60) |
(60) |
(85,012) |
(350,607) |
(357,137) |
|||
Other long term liabilities |
(15,091) |
(15,488) |
(15,488) |
(15,488) |
(15,488) |
(15,488) |
(15,488) |
(15,488) |
|||
Net Assets |
|
|
10,269 |
8,703 |
9,648 |
61 |
88,038 |
77,914 |
58,669 |
128,381 |
|
CASH FLOW |
|||||||||||
Operating Cash Flow |
|
|
(4,174) |
(4,540) |
(6,265) |
(9,335) |
(9,744) |
(9,744) |
(9,744) |
144,980 |
|
Net Interest |
(193) |
(320) |
(7) |
308 |
86 |
(229) |
(9,351) |
(38,566) |
|||
Tax |
0 |
0 |
74 |
0 |
0 |
0 |
0 |
(29,877) |
|||
Capex |
676 |
550 |
(259) |
0 |
0 |
(164,333) |
(246,500) |
(83,067) |
|||
Acquisitions/disposals |
0 |
0 |
0 |
0 |
0 |
0 |
0 |
0 |
|||
Financing |
0 |
3,609 |
6,316 |
0 |
97,786 |
0 |
0 |
(0) |
|||
Dividends |
0 |
0 |
0 |
0 |
0 |
0 |
0 |
0 |
|||
Net Cash Flow |
(3,691) |
(701) |
(141) |
(9,027) |
88,128 |
(174,307) |
(265,595) |
(6,530) |
|||
Opening net debt/(cash) |
|
|
(14,891) |
(11,200) |
(10,338) |
(10,197) |
(1,170) |
(89,298) |
85,008 |
350,603 |
|
HP finance leases initiated |
0 |
0 |
0 |
0 |
0 |
0 |
0 |
0 |
|||
Other |
0 |
(161) |
0 |
0 |
0 |
0 |
0 |
0 |
|||
Closing net debt/(cash) |
|
|
(11,200) |
(10,338) |
(10,197) |
(1,170) |
(89,298) |
85,008 |
350,603 |
357,133 |
|
Source: Barton Gold accounts, Edison Investment Research
|
||||||||||||||||||||||||||||||||||||||||||||||||||||||||
|
|
Research: Healthcare
Cereno Scientific has announced its Q224 results, reflecting tangible progress with its clinical candidates. Key developments include closing of patient recruitment for the Phase II CS1 trial (as of 1 July) and the rapid clinical entry for CS014. Initial safety data from the CS014 study are anticipated from mid-2025 and will serve as a key catalyst. In the near term, we expect investor interest to be focused on the top-line readouts (within Q324) from the Phase II trial for lead asset CS1 in pulmonary arterial hypertension (PAH), following the recent news on first patient dosing under the Expanded Access Programme. Based on current burn rates and gross cash at hand of c SEK86m, we estimate that the company is funded through Q125, slightly shorter than our previous estimate of Q225, but well beyond this upcoming inflection point. Our valuation adjusts slightly to SEK2.6bn or SEK9.1/share, from SEK2.5bn or SEK9.0/share previously.