Last close As at 19/08/2026
AUD1.03
▲ 0.09 (8.99%)
Market capitalisation
AUD256m
Research: Metals & Mining
Since our last note on 12 May, Barton has continued to aggressively develop its assets in pursuit of its ambition to produce 150koz gold per year in a two-stage ‘hub and spoke’ model, leveraging its Central Gawler Mill (CGM) and a new future Tunkillia mill. To this end, it has a) continued extensive drilling at Tarcoola-Tolmer, b) acquired the Wudinna prospect for a likely consideration of A$7.5m, or A$15/oz (plus a further potential A$7.5m if it goes into production), c) completed a A$3.0m placing to fund reserve conversion upgrade drilling at Tunkillia as well as a JORC resource upgrade at Tarcoola and d) announced two resource upgrades at its Challenger mine adjacent to the CGM to increase its resource to over 300koz, including 194koz at 3.2g/t Au on existing open pit and underground development. Consequently, Barton has now commenced a definitive feasibility study on ‘Stage 1’ production at the CGM as well as resource upgrade drilling at Tunkillia’s ‘Starter Pits’ and the necessary baseline water monitoring programme to support a mining licence application in late CY26. As a result, its market capitalisation has increased from A$49m in January to A$282m now, and it has been accepted for inclusion into the S&P Dow Jones ASX All Ordinaries Index of the 500 largest companies in Australia.
| Year end | Revenue (AUDm) | PBT (AUDm) | EPS (AUD) | DPS (AUD) | P/E (x) | Yield (%) |
|---|---|---|---|---|---|---|
| 6/24 | 0.8 | (9.4) | (0.05) | 0.00 | N/A | N/A |
| 6/25 | 8.9 | (1.8) | (0.01) | 0.00 | N/A | N/A |
| 6/26e | 0.0 | (10.0) | (0.04) | 0.00 | N/A | N/A |
| 6/27e | 25.5 | (4.0) | (0.02) | 0.00 | N/A | N/A |
Barton has increased its aggregate resource by 648.1koz, or 40.8%, in the 16 months since June 2024. We estimate that this increase corresponds to a value of A$24.5m (A$0.11/share) at the average in-situ rating of pre-production gold resources listed in Australia, or A$78.4m (A$0.35/share) at Barton’s premium rating.
At an updated forex rate of A$1.5286/US$ (cf A$1.5616/US$ previously), we estimate that Tunkillia’s optimised pre-tax NPV7.5 of A$1,416m translates into a post-tax NPV7.5 of c A$960.6m, or A$4.25/share, or A$1.44–2.15 on a risked basis (cf A$1.38–2.07/share previously) based on EV/NPV multiples. For the first time however, we have also incorporated CGM-Challenger cash flows into our financial model. On a stand-alone basis (using the same macroeconomic assumptions as Tunkillia), we value this asset at c A$194.6m or A$0.86/share. As a contributor to Barton, we value it at exactly the same level, albeit its contribution manifests itself in reducing and deferring future equity financing requirements. On this basis, we calculate that Barton can support the required equity fund-raising for Tunkillia at the current share price such that net debt:equity peaks at 2:1 and still return dividends to shareholders with an NPV10 of A$2.84/share (cf A$1.45/share previously), or A$3.71/share at the current price of gold. Ultimately, if it is able to extend the lives of its operations indefinitely, we calculate that a valuation of c A$7.45/share is possible.
Since our last note on the company on 12 May, Barton has made important progress in pursuing its ambition to achieve production of 150koz per year in a regional hub and spoke model from two mills, with the second stage taking Barton to its target scale via bulk, lower-grade production from Tunkillia complemented by high-grade ore from Tarcoola. This is summarised below.
At Tarcoola-Tolmer:
At Wudinna:
Financial updates:
At the Central Gawler Mill:
At Tunkillia:
Stock market listing:
An analysis of the quantitative aspects of the announcements follows.
Barton announced a 156.5koz increase in the JORC resource at Challenger on 30 June and a further 90.5koz upgrade on 8 September, following detailed remodelling of gold mineralisation on or near existing development drives within the historical Challenger underground mine (below the 90m RL level). An analysis of the fully updated mineral resource estimate at Challenger, relative to that prior to the first upgrade on 30 June, is as follows:
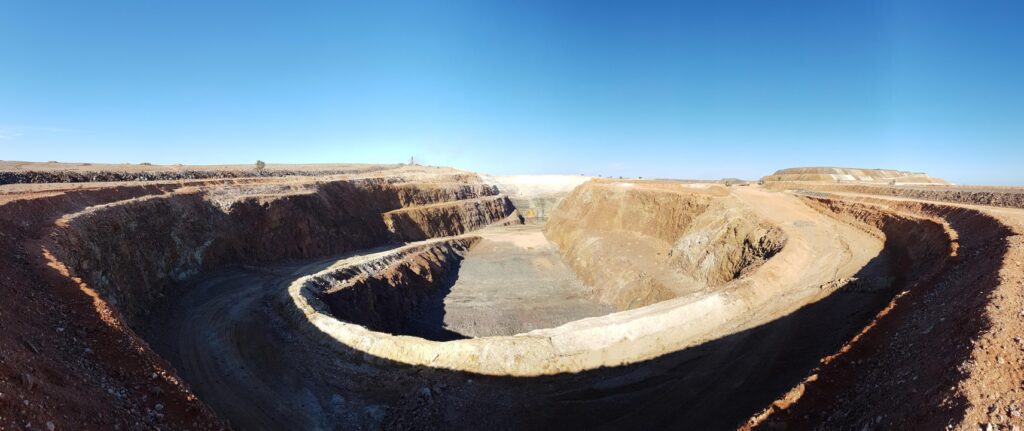
The new Challenger mineral resource estimate reflects the original and adjacent ‘SEZ pit’ open pits (Challenger Main), the ‘West’ open pit (Challenger West), the ‘South Southwest’ Deposit, historical Tailings Storage Facilities 1 and 2 (TSF1 and TSF2, respectively) and the historical Challenger underground mine. However, it excludes various lower-grade stockpiles and higher-grade mill residues (eg ball mill rejects), which are located on the run-of-mine pad, but are likely to form a component of early mill feed as the hard rock crushing and grinding circuits are recommissioned for the start of Phase 2 (fresh rock) operations.
All mineralisation is adjacent to the company’s CGM and almost all is located in, on, or adjacent to existing serviceable open pit and underground developments. Aside from the material increase in the overall mineral resource estimate from less than one year’s worth of ore feed to over 17 years (at an average grade of 0.92g/t cf an average head grade of 0.82g/t at Tunkillia according to the latter’s optimised scoping study), as much as three years’ worth of material is reported to be accessible at a materially higher grade of 3.23g/t.
On our estimate of the value of average in-situ gold resources listed in Australia
of
In the wake of the resource increase, Barton has commenced a DFS on the project, with the objective of starting initial ‘Stage 1’ CGM operations by the end of 2026. Initially, this will focus on reprocessing higher-grade tailings (0.6–1.0g/t Au) identified within its historical TSF1 (‘Phase 1’), with the subsequent integration of fresh ore feed from open pit and underground mining (‘Phase 2’). Within this context, there may also be scope to defer capital cost elements (eg crushing, grinding and gravity circuit refurbishment and upgrades) to a later date, which would reduce upfront capital requirements for the first 12–24 months of operation, with such works then being funded from operating cash flow before fresh ore supplies enter the mill feed schedule. The DFS is expected to be completed by the end of March 2026.
After both its acquisition of Wudinna and its mineral resource upgrade at Challenger, we estimate that Barton’s aggregate, group-wide resources now amount to 2.2Moz, categorised as follows:
This updated resource estimate compares with an equivalent June 2024 number of 1,587.5koz.
On our estimate of the value of average in-situ gold resources listed in Australia
of
Barton’s ambition is to achieve production of 150koz per year in a regional hub and spoke model from two mills, with the second stage taking it to its target scale via bulk, lower-grade production from Tunkillia blended with complementary high-grade ore from Tarcoola. Subject to the usual caveats regarding timelines, Barton’s ambition for achieving its targets remains as follows:
Note that the opportunity to truck high-grade concentrates from Wudinna to either the CGM or Tunkillia presents an upside opportunity to the overall production profile.
Compared to past notes, our valuation methodology regarding Tunkillia as a project remains unchanged. However, in our valuation of the company we have incorporated production from CGM-Challenger for the first time, based on the parameters indicated by the work completed since May. This is shown in the table below. At the same time, we have re-phased and refined our estimate of Barton’s equity requirements, such that it raises sufficient in FY26 to bring the CGM into production using Challenger ore, then benefits from positive free cash flows in FY28 and FY29 and raises a reduced amount of equity in FY28 in order to develop Tunkillia (our estimate for the FY28 raise is now A$56.2m).
Analysed as presented in Exhibit 3, CGM-Challenger has an NPV10 of A$194.6m based on discounted cash flows, or A$0.86/share as at 1 July 2025, as a standalone asset. Within the context of Barton however, its principal contribution to the company’s valuation is in the form of reducing future equity funding requirements (see Exhibits 7 and 8).
Barton’s optimised scoping study calculated a pre-tax internal rate of return (IRR)
on the Tunkillia project of 73.2% and a pre-tax NPV7.5% of A$1,416m. Using the same gold price (
Risk associated with Tunkillia may be assumed to comprise sovereign risk, execution risk, geological risk, metallurgical risk, engineering risk, management risk (possibly also including funding risk) and an overall risk of ‘commerciality’. Three of these risks – sovereign risk, execution risk (in the form of ‘stage of development’ risk, ie scoping study or preliminary economic assessment) and overall ‘commerciality risk’ – may immediately be adjusted for.
In our report Gold stars and black holes, published in January 2019, we calculated that companies with completed scoping studies commanded valuations between -4.8% and 50.7% of attributable project NPV, with an average of 11.7% (see Exhibit 166 on page 82 of the report).
According to the Fraser Institute’s 2023 survey, South Australia ranks in the top quartile of jurisdictions most attractive to mining investment, on a par with Finland and Idaho and above British Columbia and the Northwest Territories:
The mean Fraser Institute investment attractiveness score for all jurisdictions is 56.56, which is between the scores for Serbia and California in the exhibit above. If this is deemed to attract an average valuation of 11.7% of attributable NPV, and the top and bottom halves of the sample are presumed to attract valuations with respect to the average and pro rata to their scores, then a company with an average project in South Australia may be expected to attract a valuation of 33.9% of attributable project NPV. For Barton, this would imply an updated valuation of A$1.44/share for Tunkillia alone, excluding any contribution from its other assets.
In our Gold stars and black holes report, we similarly calculated a statistically significant relationship between the valuation of a company and its IRR, which is demonstrated in the exhibit below.
On the basis of the Tunkillia project’s scoping study pre-tax IRR of 73.2%, therefore, Barton could be expected to command an updated valuation equivalent to 46.0% of its NPV, or A$1.96/share.
Alternatively, if a multiple regression analysis between the IRR and Fraser Institute investment attractiveness scores and a company’s enterprise value/NPV ratio is performed and the resulting equation applied to Tunkillia, a 50.5% enterprise value/NPV ratio is predicted. This implies an updated valuation of A$2.15/share.
A summary of all four of these project valuations of Tunkillia is provided below:
We have updated our long-term, real gold price forecast to
From this level of A$2.84/share on 1 July 2025, we would expect the valuation of Barton to increase and to peak at A$4.49/share (also on 1 July 2025 money terms) on the cusp of the company’s first material potential dividend to shareholders in FY31.
A bridge chart of the evolution of Tunkillia’s valuation contribution to Barton is as follows:
As noted previously, the standalone NPV10 of CGM-Challenger on the basis of a discounted cash flow analysis of the financial forecasts made in Exhibit 3 is A$194.6m, or A$0.86/share, which may be rationalised in the chart above as comprising the direct contribution of CGM-Challenger to dividends of A$0.24/share plus the contribution made to delaying and re-phasing future equity issues (and thereby reducing potential dilution) of A$0.54/share and A$0.08/share.
Within this context, Barton’s other assets may prove significant multipliers of value. Although small in terms of ounces, Tarcoola boasts a low-grade oxide stockpile with a grade of 1.20g/t, a low-grade sulphide stockpile with a grade of 1.40g/t and the Perseverance pit with a grade of 1.99g/t – all of which are significantly in excess of Tunkillia’s average resource grade of 0.80g/t and its average life-of-mine head grade of 0.82g/t. In addition, Barton is targeting a further c 365koz gold in higher-grade zones to be fed into the mill in the first two to three years of operation and potentially as much as 120koz per year to be fed into the mill over its full eight-year processing life. Possible sources for such material include potentially extending the Starter pit and deepening and smoothing the eventual Main pit floor. Whether early or late in the life of the operation however, we estimate that future exploration success and/or future optimisation studies have the potential to add materially to Tunkillia’s NPV.
Aside from grade, our valuation is also sensitive to the extent to which Barton is able to extend its life of operations. In our base case, we assume that it would raise equity in FY26 and FY28, would pay off outstanding net debt in early FY31 and that it would then generate an average of A$256.7m per year for the remaining seven years of its life, which it would pay out as (maximum potential) dividends at an average rate of c A$0.89/share. If it is able to extend this performance into the future, our valuation of the company varies as shown in Exhibit 9, below.
Moreover, while an extension of Barton’s operations’ lives ad infinitum would increase our valuation of the company today by A$2.07/share, from A$2.84/share to A$4.91/share, this valuation would continue to rise with time to settle at A$7.45/share from FY37, as depicted in Exhibit 10 below:
Accepting the ad infinitum valuation shown in Exhibit 10, we calculate that Barton’s P/E ratio in the years FY30–37 (ie those for which we have full financial forecasts) would range from 5.2x in FY30 to 22.2x in FY37. This compares with Capricorn Metals’ current consensus forecast P/E range of 20.6–10.4x for FY26–28 (ie the same order of magnitude; source: LSEG Data & Analytics, 30 September 2025).
General disclaimer and copyright
This report has been commissioned by Barton Gold and prepared and issued by Edison, in consideration of a fee payable by Barton Gold. Edison Investment Research standard fees are £60,000 pa for the production and broad dissemination of a detailed note (Outlook) following by regular (typically quarterly) update notes. Fees are paid upfront in cash without recourse. Edison may seek additional fees for the provision of roadshows and related IR services for the client but does not get remunerated for any investment banking services. We never take payment in stock, options or warrants for any of our services.
Accuracy of content: All information used in the publication of this report has been compiled from publicly available sources that are believed to be reliable, however we do not guarantee the accuracy or completeness of this report and have not sought for this information to be independently verified. Opinions contained in this report represent those of the research department of Edison at the time of publication. Forward-looking information or statements in this report contain information that is based on assumptions, forecasts of future results, estimates of amounts not yet determinable, and therefore involve known and unknown risks, uncertainties and other factors which may cause the actual results, performance or achievements of their subject matter to be materially different from current expectations.
Exclusion of Liability: To the fullest extent allowed by law, Edison shall not be liable for any direct, indirect or consequential losses, loss of profits, damages, costs or expenses incurred or suffered by you arising out or in connection with the access to, use of or reliance on any information contained on this note.
No personalised advice: The information that we provide should not be construed in any manner whatsoever as, personalised advice. Also, the information provided by us should not be construed by any subscriber or prospective subscriber as Edison’s solicitation to effect, or attempt to effect, any transaction in a security. The securities described in the report may not be eligible for sale in all jurisdictions or to certain categories of investors.
Investment in securities mentioned: Edison has a restrictive policy relating to personal dealing and conflicts of interest. Edison Group does not conduct any investment business and, accordingly, does not itself hold any positions in the securities mentioned in this report. However, the respective directors, officers, employees and contractors of Edison may have a position in any or related securities mentioned in this report, subject to Edison's policies on personal dealing and conflicts of interest.
Copyright 2025 Edison Investment Research Limited (Edison).
Australia
Edison Investment Research Pty Ltd (Edison AU) is the Australian subsidiary of Edison. Edison AU is a Corporate Authorised Representative (1252501) of Crown Wealth Group Pty Ltd who holds an Australian Financial Services Licence (Number: 494274). This research is issued in Australia by Edison AU and any access to it, is intended only for "wholesale clients" within the meaning of the Corporations Act 2001 of Australia. Any advice given by Edison AU is general advice only and does not take into account your personal circumstances, needs or objectives. You should, before acting on this advice, consider the appropriateness of the advice, having regard to your objectives, financial situation and needs. If our advice relates to the acquisition, or possible acquisition, of a particular financial product you should read any relevant Product Disclosure Statement or like instrument.
New Zealand
The research in this document is intended for New Zealand resident professional financial advisers or brokers (for use in their roles as financial advisers or brokers) and habitual investors who are “wholesale clients” for the purpose of the Financial Advisers Act 2008 (FAA) (as described in sections 5(c) (1)(a), (b) and (c) of the FAA). This is not a solicitation or inducement to buy, sell, subscribe, or underwrite any securities mentioned or in the topic of this document. For the purpose of the FAA, the content of this report is of a general nature, is intended as a source of general information only and is not intended to constitute a recommendation or opinion in relation to acquiring or disposing (including refraining from acquiring or disposing) of securities. The distribution of this document is not a “personalised service” and, to the extent that it contains any financial advice, is intended only as a “class service” provided by Edison within the meaning of the FAA (i.e. without taking into account the particular financial situation or goals of any person). As such, it should not be relied upon in making an investment decision.
United Kingdom
This document is prepared and provided by Edison for information purposes only and should not be construed as an offer or sol icitation for investment in any securities mentioned or in the topic of this document. A marketing communication under FCA Rules, this document has not been prepared in accordance with the legal requirements designed to promote the independence of investment research and is not subject to any prohibition on dealing ahead of the dissemination of investment research.
This Communication is being distributed in the United Kingdom and is directed only at (i) persons having professional experience in matters relating to investments, i.e. investment professionals within the meaning of Article 19(5) of the Financial Services and Markets Act 2000 (Financial Promotion) Order 2005, as amended (the "FPO") (ii) high net-worth companies, unincorporated associations or other bodies within the meaning of Article 49 of the FPO and (iii) persons to whom it is otherwise lawful to distribute it. The investment or investment activity to which this document relates is available only to such persons. It is not intended that this document be distributed or passed on, directly or indirectly, to any other class of persons and in any event and under no circumstances should persons of any other description rely on or act upon the contents of this document.
This Communication is being supplied to you solely for your information and may not be reproduced by, further distributed to or published in whole or in part by, any other person.
United States
Edison relies upon the "publishers' exclusion" from the definition of investment adviser under Section 202(a)(11) of the Investment Advisers Act of 1940 and corresponding state securities laws. This report is a bona fide publication of general and regular circulation offering impersonal investment-related advice, not tailored to a specific investment portfolio or the needs of current and/or prospective subscribers. As such, Edison does not offer or provide personal advice and the research provided is for informational purposes only. No mention of a particular security in this report constitutes a recommendation to buy, sell or hold that or any security, or that any particular security, portfolio of securities, transaction or investment strategy is suitable for any specific person.
London │ New York │ Frankfurt
20 Red Lion Street
London, WC1R 4PS
United Kingdom
Research: TMT
Zalaris has built an impressive track record over the last five years, with a revenue CAGR of 11.6% and adjusted EBIT margins growing from 7.0% to 11.0% from FY20 to FY24. The company is on track to hit its original FY26 targets early and has set ambitious targets for FY28. With long-term customer relationships and a low churn rate, Zalaris has good revenue visibility due to a high proportion of recurring revenues. Focused on multinational customers with a strong presence in Europe, the company has been winning progressively larger contracts and has the opportunity to expand further in Europe and the Asia-Pacific region (APAC).