Last close As at 05/08/2026
AUD0.33
▲ 0.01 (1.54%)
Market capitalisation
AUD129m
Research: TMT
EML Payments reported robust H121 results, with revenue growth of 61% and NPATA growth of 30% y-o-y. The GPR division, which now makes up 57% of group revenue, saw strong organic growth in H1, compensating for the lower volumes experienced in the malls segment of the G&I division. Management has reinstated guidance for FY21 and we have upgraded our forecasts to reflect the more positive outlook.
EML Payments |
Showing the benefits of diversification |
H121 results |
Software & comp services |
19 February 2021 |
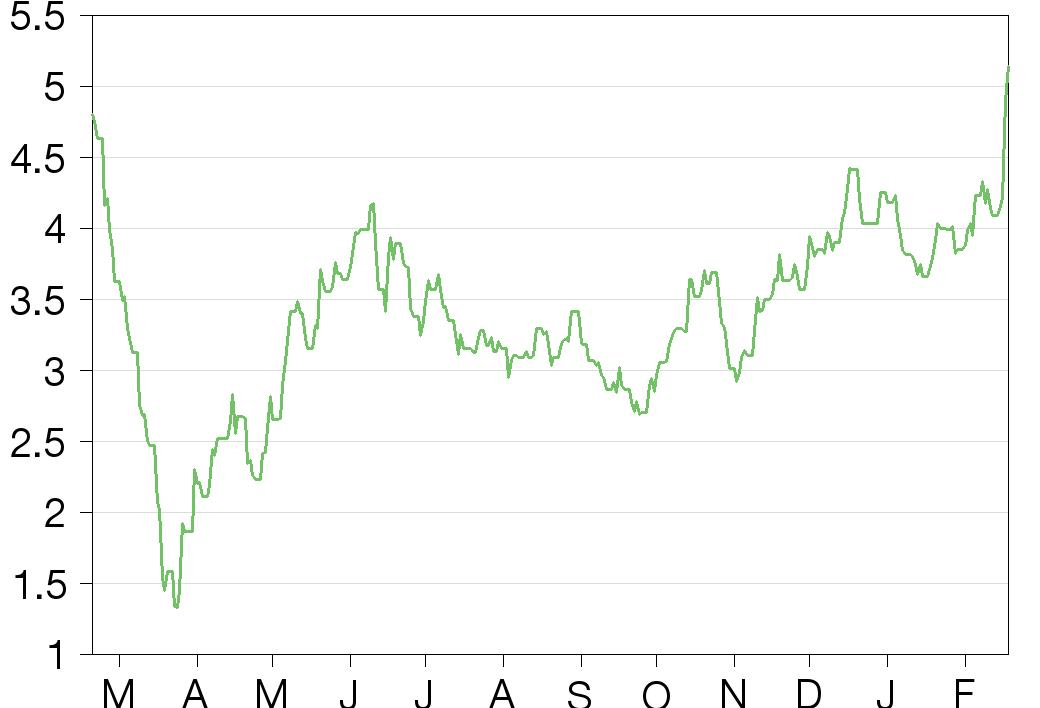
Share price performance
Business description
Next events
Analyst
EML Payments is a research client of Edison Investment Research Limited |
|||||||||||||||||||||||||||||||||||||||||||||
EML Payments reported robust H121 results, with revenue growth of 61% and NPATA growth of 30% y-o-y. The GPR division, which now makes up 57% of group revenue, saw strong organic growth in H1, compensating for the lower volumes experienced in the malls segment of the G&I division. Management has reinstated guidance for FY21 and we have upgraded our forecasts to reflect the more positive outlook.
Year end |
Revenue (A$m) |
PBT* |
NPATA** (A$m) |
Dil. EPS* |
DPS |
P/E |
EV/EBITDA |
06/19 |
97.2 |
25.6 |
20.6 |
7.8 |
0.0 |
65.0 |
59.1 |
06/20 |
121.0 |
21.6 |
24.0 |
5.5 |
0.0 |
91.8 |
54.0 |
06/21e |
182.2 |
34.7 |
30.8 |
7.5 |
0.0 |
67.5 |
35.1 |
06/22e |
226.3 |
52.4 |
44.1 |
11.3 |
0.0 |
44.9 |
24.8 |
Note: *PBT and EPS are normalised, excluding amortisation of acquired intangibles, exceptional items and share-based payments. **Net profit after tax, excluding acquisition-related costs.
Benefiting from first full contribution of PFS
In H121, EML reported gross debit volume (GDV) growth of 54% y-o-y, revenue growth of 61%, EBITDA growth of 42% and NPATA growth of 30%. GPR saw a good performance from both PFS (acquired in April 2020) and the original EML business, with digital banking and government programmes particularly strong. The strong performance of PFS has resulted in a A$25m increase in the fair value of contingent consideration (up to the maximum of £55m/A$98m). The Gift part of G&I suffered from the closure of malls during the vital Christmas shopping period, while the Incentive part of the business saw double-digit growth as digital card programmes proved popular. VANs reported a steady performance, with volume-based gross margin gains and new contracts signed to support growth in H221. As part of the Project Accelerator strategy to position the company at the forefront of payment-related technology, EML made its first two investments via its FinLabs incubator.
Confidence returning; guidance reinstated
For the first time in nearly a year, management has issued guidance for FY21. The low end of the range was above our forecasts, and we have upgraded our forecasts accordingly. The main driver of upside is the GPR division, which has performed better than we expected. At the same time, management expects to invest more this year to manage and drive increased levels of activity. We remain conservatively at the lower end of the guidance range, while upgrading FY21 revenue by 5.0%, EBITDA by 3.3% and NPATA by 9.1%.
Valuation: Project Accelerator key to upside
On EV/EBITDA and P/E multiples, EML trades at a discount to global payment processing companies and at a premium to prepaid card companies, reflecting the scale and profitability of the former, and EML’s better growth prospects compared to the latter. A reverse DCF analysis implies that the market is factoring in double-digit revenue growth for the company after our forecast period, which successful execution of Project Accelerator should support.
Review of H121 results
The table below summarises the company’s performance at a group and divisional level for H121.
Exhibit 1: Divisional and group results, H121
H121 |
H120 |
y-o-y |
H121 |
H120 |
y-o-y |
|||
GDV (A$bn) |
Gross profit (A$m) |
|||||||
G&I |
0.75 |
0.84 |
(11%) |
G&I |
28.8 |
32.3 |
(11%) |
|
GPR |
4.87 |
1.47 |
232% |
GPR |
34.1 |
8.7 |
290% |
|
VANS |
4.59 |
4.31 |
6% |
VANS |
4.2 |
3.4 |
23% |
|
Group GDV |
10.21 |
6.62 |
54% |
Group |
67.3 |
44.8 |
50% |
|
Yield (bp) |
Gross margin |
|||||||
G&I |
467 |
479 |
(12) |
G&I |
82.3% |
80.4% |
1.9% |
|
GPR |
112 |
89 |
23 |
GPR |
62.6% |
66.4% |
(3.8%) |
|
VANS |
13 |
13 |
(0) |
VANS |
73.3% |
62.4% |
10.9% |
|
Group yield |
93 |
89 |
4 |
Group |
70.5% |
75.7% |
(5.2%) |
|
Revenue (A$m) |
H121 |
FY20 |
h-o-h |
|||||
G&I |
35.0 |
40.1 |
(13%) |
Cash |
136.5 |
118.4 |
15% |
|
GPR |
54.4 |
13.2 |
314% |
Net cash |
100.3 |
82.5 |
22% |
|
VANS |
5.8 |
5.5 |
5% |
|||||
Net interest contribution |
0.1 |
0.3 |
(63%) |
|||||
Group revenue |
95.3 |
59.2 |
61% |
|||||
EBITDA (A$m) |
28.1 |
19.7 |
42% |
|||||
EBITDA margin |
29.4% |
33.3% |
(3.9%) |
|||||
NPATA (A$m) |
13.2 |
10.1 |
30% |
|||||
Source: EML Payments
In H121, EML reported GDV growth of 54% y-o-y, revenue growth of 61%, EBITDA growth of 42% and NPATA growth of 30%. EML’s NPATA measure adjusts profit after tax to exclude acquisition-related items, such as amortisation of acquired intangibles and changes in fair value of contingent consideration. In H121, this included a A$24.9m charge to reflect the increase in the fair value of contingent consideration, mainly for PFS (up to the maximum of £55m), resulting from better-than-expected performance of the acquired business.
Cash increased by A$18.1m: underlying operating cash flow of A$35.1m was offset by A$9.8m in FinLab investments, $4.8m in capitalised development costs and A$2.9 in tax and interest payments.
General Purpose Reloadable (GPR) – strong organic growth
The division saw GDV growth of 232% y-o-y, as PFS (acquired on 1 April 2020) was included for the full six months for the first time. The company noted that PFS contributed GDV of A$3.12bn and the original EML business A$1.75bn (+20% y-o-y). The divisional yield increased by 23bp y-o-y, as the higher yielding PFS business made up a greater proportion of divisional GDV. PFS contributed revenue of A$38.0m and EML $16.4m (+25% y-o-y). Overall, divisional revenue increased 314% year-on-year. Gross margin declined y-o-y, reflecting the higher costs of the PFS business, which uses third party payment processors.
Two areas of strength for the original business were:
■
Australian salary packaging – this grew from 233,000 accounts at the end of FY20 to 282,000 by the end of H121 as the migration of Smart Salary accounts continued. It has since increased to 286,000 accounts with the target to hit 300,000 by the end of FY21. Revenue from this segment increased by 60% y-o-y.
■
Gaming disbursements – ended December on an annualised GDV run rate of A$1bn. Revenue increased by 42% y-o-y. The division launched payout cards for Paddy Power in the European market towards the end of H1, which should drive growth in H2.
PFS saw strong demand for its solutions, with digital banking and government programmes a particular area of strength. This includes programmes with the UK Home Office (which is moving into phase 2) and the Jersey government (stimulus programme).
The division signed 55 new contracts in H1.
During H1, EML became a primary member of Faster Payments in the UK. Until now, it has used a third-party processor for this. The company estimates this will generate cost savings of c £480k in FY22.
Gift & Incentive – GDV hit by mall closures
The two parts of this division performed in very different ways.
■
Gift: as shopping malls went into various stages of lockdown from early to mid-December, H121 GDV was down 19% y-o-y (down 18% in North America, down 20% in the UK/Europe). The Christmas shopping season is crucial for mall operators – with malls closed it was difficult for consumers to buy mall gift cards and they would have been less keen to buy them as gifts if they could not be spent. The company noted that GDV for January 2021 was down 50% y-o-y in the US and Canada, down 70% in the UK and down 54% in Europe. Management expects volumes to start to improve as lockdowns are relaxed (most likely from April), helped by vaccine roll-outs around the world. The company expects to recognise breakage revenue of A$3.8m in H221, down from A$6.8m in H220, reflecting the lower level of gift card sales in the run up to Christmas.
■
Incentive: this business saw GDV growth of 11% y-o-y in H121 (North America +13%, Australia +15%, UK/Europe +8%). The company continues to sign up new partners and to launch new programmes. In H1, reflecting the shift from physical to digital solutions, it ran 150 digital PAYS gift card programmes.
Overall, divisional GDV declined 11% y-o-y and the yield reduced by 12bp to 467bp, resulting in a y-o-y revenue decline of 13%. Breakage rates were temporarily higher due to lower card spend, resulting in gross margin increasing from 80.4% in H120 to 82.3% in H121. We note that breakage made up 16% of group revenue, down from 26% a year ago.
In anticipation of improving volumes, the company has continued to invest in technology within this division, launching the new EML Retail platform, which enables mall operators to sell cards both in store and online.
VANs – gross margin boost from higher volumes
This division saw steady progress in H121: GDV growth of 6% and a flat yield of 13bp resulted in revenue growth of 5%. Volume rebates resulted in gross margin jumping from 62.4% in H120 to 73.3% in H121, which should be sustainable as long as volumes remain at or above current levels. Management noted that it closed H121 with an annualised GDV of $9.8bn (+20% y-o-y). The division signed five contracts in H1 and is expecting to launch these programmes by the end of H2.
Progress of Project Accelerator
EML announced its Project Accelerator strategy in August last year. As a reminder, this is designed to help the company fulfil its vision of ‘offering customers a feature-rich, fully embedded payment solution, via a simple, single touchpoint’. The group wants to benefit from working with companies looking to disrupt their own industries, using EML’s payments technology to help them do so. To remain at the forefront of innovation, the group plans to focus its investment in four areas:
■
In-house development of product and infrastructure: to make it easy for customers to use EML’s solutions. For example, creating a single point of integration for customers to access EML’s operations in different countries or developing a tokenisation solution for Visa cards so that EML can support the customer’s choice of card network.
■
Integration with adjacent technologies: to add additional functionality that the company does not necessarily want to develop itself.
■
Partnering with disruptive fintechs: potentially to use as a route to sell each other’s products.
■
External investment: the company has set up FinLabs to invest in minority stakes in companies with interesting and relevant technology.
The company expects to spend A$10–15m over the next two years, some of which will be capitalised. The remainder will be funded through cost savings.
EML has already made its first two FinLabs investments:
1.
US$2m investment for a 10% stake in Interchecks, a US-based disbursement tool for non-card payments. EML will also resell Interchecks’ technology. Systems integration has been completed and initial contracts have been signed.
2.
US$5m investment for an 11% stake in The Hydrogen Technology Corporation (Hydrogen). US-based Hydrogen provides an embedded finance and international payments platform. Systems integration is underway; more than 100 companies are involved in beta testing.
Outlook and changes to forecasts
With the onset of the pandemic, the company withdrew guidance in March last year. It has now reinstated it for FY21:
■
Revenue: A$180–190m.
■
EBITDA: A$50–54m.
■
NPATA: A$30–33.5m.
■
Operating cash flow conversion: 90–110%.
■
EBITDA per share: 13.8-15.0c.
We have revised our forecasts to reflect H121 results and the new guidance. On a divisional basis, we have increased our GDV forecasts and gross margin assumptions for GPR and VANs; for G&I we have slightly increased our yield and gross margin assumptions but have left GDV unchanged.
The company had previously suggested that cash overheads would be in the range of A$66–72m (depending on the level of bonus accruals), but now expects this to be more like A$76–80m. As business in GPR was better than expected, considering COVID-19 disruption, the company decided to invest more in the business to support growth. The table below summarises the changes to our estimates.
We have reflected the increased estimate for PFS contingent consideration and added the two FinLabs acquisitions.
Exhibit 2: Changes to forecasts
FY21e |
FY22e |
FY23e |
|||||||||||
Old |
New |
Change |
y-o-y |
Old |
New |
Change |
y-o-y |
Old |
New |
Change |
y-o-y |
||
Revenues |
A$m |
173.4 |
182.2 |
5.0% |
50.6% |
218.8 |
226.3 |
3.4% |
24.2% |
247.4 |
255.9 |
3.5% |
13.1% |
Gross profit |
A$m |
117.2 |
125.4 |
7.0% |
42.4% |
150.4 |
157.0 |
4.4% |
25.2% |
171.9 |
179.6 |
4.4% |
14.4% |
Gross margin |
67.6% |
68.8% |
1.2% |
-4.0% |
68.7% |
69.4% |
0.7% |
0.6% |
69.5% |
70.2% |
0.7% |
0.8% |
|
EBITDA |
A$m |
48.4 |
50.1 |
3.3% |
53.9% |
70.6 |
70.7 |
0.1% |
41.1% |
87.7 |
87.9 |
0.2% |
24.5% |
EBITDA margin |
27.9% |
27.5% |
-1.6% |
0.6% |
32.3% |
31.2% |
-3.2% |
3.7% |
35.5% |
34.4% |
-3.1% |
3.1% |
|
Normalised operating profit |
A$m |
35.4 |
36.1 |
1.9% |
61.5% |
54.0 |
53.8 |
-0.3% |
49.1% |
68.4 |
68.5 |
0.2% |
27.3% |
Normalised operating profit margin |
20.4% |
19.8% |
-0.6% |
1.3% |
24.7% |
23.8% |
-0.9% |
4.0% |
27.7% |
26.8% |
-0.9% |
3.0% |
|
Reported operating profit |
A$m |
11.9 |
7.7 |
-35.9% |
-235.7% |
37.5 |
37.3 |
-0.4% |
388.2% |
51.9 |
52.0 |
0.2% |
39.4% |
Reported operating margin |
6.9% |
4.2% |
-2.7% |
8.9% |
17.1% |
16.5% |
-0.6% |
12.3% |
21.0% |
20.3% |
-0.7% |
3.8% |
|
Normalised PBT |
A$m |
35.3 |
34.7 |
-1.6% |
60.5% |
53.7 |
52.4 |
-2.4% |
51.1% |
68.2 |
67.1 |
-1.5% |
28.0% |
Reported PBT |
A$m |
5.3 |
(26.1) |
-595.8% |
297.7% |
30.7 |
34.4 |
12.1% |
-231.8% |
45.2 |
49.6 |
9.9% |
44.1% |
Normalised net income |
A$m |
28.2 |
27.8 |
-1.6% |
60.5% |
43.0 |
42.0 |
-2.4% |
51.1% |
54.5 |
53.7 |
-1.5% |
28.0% |
NPATA |
A$m |
28.2 |
30.8 |
9.1% |
28.0% |
46.1 |
44.1 |
-4.4% |
43.1% |
56.6 |
54.7 |
-3.4% |
24.2% |
Reported net income |
A$m |
4.2 |
(20.9) |
-595.8% |
257.3% |
24.6 |
27.6 |
12.1% |
-231.8% |
36.1 |
39.7 |
9.9% |
44.1% |
Normalised basic EPS |
A$ |
0.08 |
0.08 |
-1.6% |
35.2% |
0.12 |
0.12 |
-2.5% |
50.5% |
0.15 |
0.15 |
-1.6% |
28.0% |
Normalised diluted EPS |
A$ |
0.08 |
0.08 |
-1.6% |
36.0% |
0.12 |
0.11 |
-2.5% |
50.5% |
0.15 |
0.15 |
-1.6% |
28.0% |
Reported basic EPS |
A$ |
0.01 |
-0.06 |
-595.6% |
200.9% |
0.07 |
0.08 |
12.0% |
-231.3% |
0.10 |
0.11 |
9.8% |
44.1% |
Dividend per share |
A$ |
0.00 |
0.00 |
N/A |
N/A |
0.00 |
0.00 |
N/A |
N/A |
0.00 |
0.00 |
N/A |
N/A |
Net debt/(cash) |
A$m |
(112.2) |
(109.1) |
-2.8% |
32.2% |
(126.6) |
(114.0) |
-9.9% |
4.5% |
(151.8) |
(129.7) |
-14.6% |
13.8% |
GDV |
A$bn |
19.9 |
20.6 |
3.4% |
48.6% |
23.4 |
24.2 |
3.5% |
17.3% |
26.3 |
27.2 |
3.6% |
12.6% |
Take rate |
0.87% |
0.88% |
0.0% |
0.01% |
0.94% |
0.94% |
0.0% |
0.05% |
0.94% |
0.94% |
0.0% |
0.00% |
|
Source: Edison Investment Research
Valuation
Exhibit 3: Peer group valuation multiples
Currency |
Market |
EV/Sales (x) |
EV/EBITDA (x) |
P/E (x) |
Div yield (%) |
|||||
cap (m) |
CY |
NY |
CY |
NY |
CY |
NY |
CY |
NY |
||
EML Payments |
A$ |
1,838 |
9.6 |
7.8 |
35.1 |
24.8 |
67.5 |
44.9 |
0.0 |
0.0 |
Payment processors |
||||||||||
Adyen |
€ |
66,517 |
66.0 |
47.8 |
109.0 |
74.6 |
261.7 |
165.4 |
0.0 |
0.0 |
FIS |
US$ |
84,141 |
7.3 |
6.7 |
16.3 |
14.6 |
21.3 |
18.4 |
1.1 |
1.2 |
Fiserv |
US$ |
73,741 |
6.2 |
5.8 |
14.9 |
13.5 |
20.3 |
17.3 |
0.0 |
0.0 |
Global Payments |
US$ |
59,023 |
8.8 |
8.1 |
18.6 |
16.6 |
24.8 |
21.4 |
0.4 |
0.4 |
PayPal Holdings |
US$ |
349,444 |
13.5 |
11.2 |
46.0 |
37.6 |
65.5 |
51.8 |
0.0 |
0.0 |
Square |
US$ |
122,993 |
13.0 |
9.5 |
286.1 |
180.8 |
360.2 |
237.8 |
0.0 |
0.0 |
Worldline |
€ |
21,987 |
8.1 |
4.2 |
35.1 |
17.3 |
46.5 |
32.3 |
0.0 |
0.0 |
Average |
17.6 |
13.3 |
75.2 |
50.7 |
114.3 |
77.8 |
0.2 |
0.2 |
||
Average excl Square |
18.3 |
14.0 |
40.0 |
29.0 |
73.3 |
51.1 |
0.2 |
0.3 |
||
Prepaid card companies |
||||||||||
Appreciate Group |
£ |
79 |
0.6 |
0.6 |
9.2 |
6.1 |
21.2 |
12.9 |
2.8 |
4.0 |
Edenred |
€ |
11,750 |
9.1 |
8.4 |
23.2 |
20.4 |
43.8 |
36.9 |
1.5 |
1.6 |
Euronet Worldwide |
US$ |
7,795 |
2.9 |
2.5 |
16.4 |
11.5 |
26.5 |
18.2 |
0.0 |
0.0 |
Fleetcor Technologies |
US$ |
22,113 |
9.6 |
8.7 |
16.9 |
14.9 |
21.2 |
18.2 |
0.0 |
0.0 |
Green Dot Corp |
US$ |
2,910 |
2.6 |
2.5 |
15.4 |
13.6 |
27.5 |
24.6 |
0.0 |
0.0 |
WEX |
US$ |
9,770 |
7.4 |
6.4 |
16.8 |
14.9 |
36.4 |
27.0 |
0.0 |
0.0 |
Average |
5.4 |
4.8 |
16.3 |
13.6 |
29.4 |
23.0 |
0.7 |
0.9 |
||
Australian fintechs |
||||||||||
Afterpay |
A$ |
43,957 |
46.3 |
29.1 |
431.7 |
181.0 |
1274.7 |
329.8 |
0.0 |
0.0 |
FlexiGroup |
A$ |
649 |
6.9 |
6.5 |
N/A |
N/A |
9.3 |
9.8 |
2.6 |
4.4 |
Zip Co |
A$ |
6,992 |
21.3 |
13.5 |
N/A |
512.4 |
N/A |
N/A |
0.0 |
0.0 |
Average |
24.9 |
16.3 |
43.7 |
346.7 |
387.6 |
1.5 |
0.9 |
1.5 |
||
Source: Edison Investment Research, Refinitiv (as at 15 February)
On an EV/EBITDA and P/E basis, EML trades at a discount to payment processors, in our view reflecting their scale and profitability compared to EML. EML trades at a premium to prepaid card companies, justified in our view because of its growth potential. It is forecast to grow EPS at a faster rate than both groups over the next two years.
We have performed a discounted cash flow analysis to estimate the growth rates and margin assumptions factored into the current share price after the explicit forecast period. Using a WACC of 8% and a long-term growth rate of 3%, we estimate that the market is pricing in revenue growth of 12% in FY25–30e with an EBITDA margin of 37.3% (this compares to 6.5% and 35.2% respectively when we last wrote). In our view, these higher growth rates are supported by H1 results, which confirmed that the GPR division is exhibiting strong growth, and the ongoing vaccine roll-out, which should allow restrictions to be lifted in the mall space.
Exhibit 4: Financial summary
A$m |
2017 |
2018 |
2019 |
2020 |
2021e |
2022e |
2023e |
||
30-June |
IFRS |
IFRS |
IFRS |
IFRS |
IFRS |
IFRS |
IFRS |
||
INCOME STATEMENT |
|||||||||
Revenue |
|
|
58.0 |
71.0 |
97.2 |
121.0 |
182.2 |
226.3 |
255.9 |
Cost of Sales |
(13.7) |
(17.7) |
(24.2) |
(32.9) |
(56.8) |
(69.3) |
(76.3) |
||
Gross Profit |
44.2 |
53.3 |
73.0 |
88.1 |
125.4 |
157.0 |
179.6 |
||
EBITDA |
|
|
14.5 |
21.0 |
29.7 |
32.5 |
50.1 |
70.7 |
87.9 |
Normalised operating profit |
|
|
11.9 |
18.1 |
25.6 |
22.4 |
36.1 |
53.8 |
68.5 |
Amortisation of acquired intangibles |
(8.9) |
(7.2) |
(7.5) |
(10.6) |
(18.5) |
(14.0) |
(14.0) |
||
Exceptionals |
0.2 |
(0.3) |
(3.0) |
(11.2) |
(3.6) |
0.0 |
0.0 |
||
Share-based payments |
(5.3) |
(5.0) |
(4.2) |
(6.1) |
(6.3) |
(2.5) |
(2.5) |
||
Reported operating profit |
(2.1) |
5.6 |
10.9 |
(5.6) |
7.7 |
37.3 |
52.0 |
||
Net Interest |
0.0 |
(0.1) |
(0.0) |
(0.7) |
(1.4) |
(1.4) |
(1.4) |
||
Joint ventures & associates (post tax) |
0.0 |
0.0 |
0.0 |
0.0 |
0.0 |
0.0 |
0.0 |
||
Exceptionals |
0.0 |
(0.5) |
(1.8) |
(0.2) |
(32.4) |
(1.5) |
(1.0) |
||
Profit Before Tax (normalised) |
|
|
11.9 |
17.9 |
25.6 |
21.6 |
34.7 |
52.4 |
67.1 |
Profit Before Tax (reported) |
|
|
(2.1) |
5.0 |
9.0 |
(6.6) |
(26.1) |
34.4 |
49.6 |
Reported tax |
2.1 |
(2.8) |
(0.6) |
0.7 |
5.2 |
(6.9) |
(9.9) |
||
Profit After Tax (normalised) |
8.9 |
14.4 |
20.5 |
17.3 |
27.8 |
42.0 |
53.7 |
||
Profit After Tax (reported) |
0.0 |
2.2 |
8.5 |
(5.9) |
(20.9) |
27.6 |
39.7 |
||
Minority interests |
0.0 |
0.0 |
(0.2) |
0.0 |
0.0 |
0.0 |
0.0 |
||
Discontinued operations |
0.0 |
0.0 |
0.0 |
0.0 |
0.0 |
0.0 |
0.0 |
||
Net income (normalised) |
8.9 |
14.4 |
20.3 |
17.3 |
27.8 |
42.0 |
53.7 |
||
Net income (reported) |
0.0 |
2.2 |
8.3 |
(5.9) |
(20.9) |
27.6 |
39.7 |
||
Basic average number of shares outstanding (m) |
245 |
246 |
249 |
304 |
361 |
362 |
362 |
||
EPS - basic normalised (A$) |
|
|
0.036 |
0.058 |
0.081 |
0.057 |
0.077 |
0.116 |
0.148 |
EPS - diluted normalised (A$) |
|
|
0.036 |
0.057 |
0.078 |
0.055 |
0.075 |
0.113 |
0.145 |
EPS - basic reported (A$) |
|
|
0.000 |
0.009 |
0.033 |
(0.019) |
(0.058) |
0.076 |
0.110 |
Dividend (A$) |
0.00 |
0.00 |
0.00 |
0.00 |
0.00 |
0.00 |
0.00 |
||
Revenue growth (%) |
148.6 |
22.5 |
36.9 |
24.4 |
50.6 |
24.2 |
13.1 |
||
Gross Margin (%) |
76.3 |
75.1 |
75.1 |
72.8 |
68.8 |
69.4 |
70.2 |
||
EBITDA Margin (%) |
25.1 |
29.6 |
30.6 |
26.9 |
27.5 |
31.2 |
34.4 |
||
Normalised Operating Margin |
20.5 |
25.4 |
26.4 |
18.5 |
19.8 |
23.8 |
26.8 |
||
BALANCE SHEET |
|||||||||
Fixed Assets |
|
|
90.6 |
108.0 |
162.9 |
905.2 |
905.7 |
988.7 |
1,049.6 |
Intangible Assets |
60.1 |
65.8 |
104.6 |
404.7 |
384.0 |
371.2 |
356.7 |
||
Tangible Assets |
2.8 |
3.5 |
5.4 |
14.6 |
12.0 |
9.6 |
7.1 |
||
Investments & other |
27.6 |
38.7 |
53.0 |
485.8 |
509.6 |
607.9 |
685.9 |
||
Current Assets |
|
|
96.9 |
131.6 |
313.8 |
1,001.1 |
1,271.8 |
1,513.5 |
1,716.3 |
Stocks |
10.3 |
12.6 |
18.2 |
22.3 |
20.9 |
23.0 |
25.3 |
||
Debtors |
6.3 |
8.9 |
14.4 |
21.7 |
32.3 |
39.9 |
45.0 |
||
Cash & cash equivalents |
39.9 |
39.0 |
33.1 |
118.4 |
144.9 |
149.8 |
165.5 |
||
Other |
40.4 |
71.1 |
248.2 |
838.7 |
1,073.6 |
1,300.8 |
1,480.5 |
||
Current Liabilities |
|
|
(62.8) |
(90.5) |
(299.0) |
(1,326.3) |
(1,628.5) |
(1,963.6) |
(2,205.7) |
Creditors |
(23.8) |
(21.2) |
(33.9) |
(47.5) |
(60.3) |
(70.8) |
(76.3) |
||
Tax and social security |
(0.0) |
0.0 |
(0.8) |
(0.2) |
(0.2) |
(0.2) |
(0.2) |
||
Short term borrowings |
0.0 |
0.0 |
(15.0) |
0.0 |
0.0 |
0.0 |
0.0 |
||
Other |
(39.0) |
(69.3) |
(249.4) |
(1,278.6) |
(1,568.1) |
(1,892.6) |
(2,129.1) |
||
Long Term Liabilities |
|
|
(4.2) |
(19.3) |
(33.5) |
(139.0) |
(125.3) |
(85.0) |
(64.3) |
Long term borrowings |
0.0 |
0.0 |
0.0 |
(35.8) |
(35.8) |
(35.8) |
(35.8) |
||
Other long-term liabilities |
(4.2) |
(19.3) |
(33.5) |
(103.2) |
(89.4) |
(49.1) |
(28.5) |
||
Net Assets |
|
|
120.6 |
129.8 |
144.2 |
441.0 |
423.6 |
453.7 |
495.9 |
Minority interests |
0.0 |
0.0 |
0.0 |
0.0 |
0.0 |
0.0 |
0.0 |
||
Shareholders' equity |
|
|
120.6 |
129.8 |
144.2 |
441.0 |
423.6 |
453.7 |
495.9 |
CASH FLOW |
|||||||||
Op Cash Flow before WC and tax |
13.1 |
19.7 |
28.4 |
31.2 |
48.2 |
68.8 |
86.1 |
||
Working capital |
4.9 |
(9.2) |
2.0 |
3.6 |
4.2 |
(0.1) |
(2.8) |
||
Exceptional & other |
(0.8) |
(1.2) |
(0.7) |
(12.7) |
(1.5) |
0.0 |
0.0 |
||
Tax |
2.1 |
(2.8) |
(0.6) |
0.7 |
5.2 |
(6.9) |
(9.9) |
||
Net operating cash flow |
|
|
19.3 |
6.5 |
29.2 |
22.8 |
56.2 |
61.9 |
73.4 |
Capex |
(2.9) |
(5.3) |
(5.8) |
(11.0) |
(13.1) |
(13.8) |
(14.5) |
||
Acquisitions/disposals |
0.0 |
(0.7) |
(44.0) |
(142.5) |
(13.3) |
(40.0) |
(40.0) |
||
Net interest |
0.0 |
(0.1) |
(0.0) |
(0.7) |
(1.4) |
(1.4) |
(1.4) |
||
Equity financing |
0.2 |
0.0 |
0.4 |
240.8 |
0.0 |
0.0 |
0.0 |
||
Dividends |
0.0 |
0.0 |
0.0 |
0.0 |
0.0 |
0.0 |
0.0 |
||
Other |
(3.6) |
(0.6) |
(0.4) |
(7.0) |
(1.8) |
(1.8) |
(1.8) |
||
Net Cash Flow |
13.0 |
(0.2) |
(20.6) |
102.3 |
26.5 |
4.9 |
15.7 |
||
Opening net debt/(cash) |
|
|
(26.9) |
(39.9) |
(39.0) |
(18.1) |
(82.5) |
(109.1) |
(114.0) |
FX |
(0.0) |
(0.6) |
(0.3) |
(2.0) |
0.0 |
0.0 |
0.0 |
||
Other non-cash movements |
0.0 |
0.0 |
0.0 |
(35.8) |
0.0 |
0.0 |
0.0 |
||
Closing net debt/(cash) |
|
|
(39.9) |
(39.0) |
(18.1) |
(82.5) |
(109.1) |
(114.0) |
(129.7) |
Source: EML Payments, Edison Investment Research
|
|
Research: Healthcare
CASI has announced as part of its preliminary results that it sold $4.8m worth of Evomela in Q420 and approximately $15m for the year (unaudited), exceeding the company guidance of $14m and our estimate of $14.4m. The company stated that it is targeting 50% growth in Evomela sales in 2021. Additionally, in 2021 the company will be jump starting its clinical development engine as it is expected to initiate clinical studies on a majority of its portfolio during the year.