Last close As at 05/08/2026
—
— 0.00 (0.00%)
Market capitalisation
—
Research: Financials
Secure Trust Bank
Written by
Secure Trust Bank |
Poised to benefit from uncertain times |
Interim results |
Banks |
2 August 2016 |
Share price performance
Business description
Next event
Analysts
Secure Trust Bank is a research client of Edison Investment Research Limited |
|||||||||||||||||||||||||||||||||||||||||||||||
Now independent with significant capital headroom, Secure Trust Bank (STB) is seeking a Main Market listing. This will leave it particularly well placed to take opportunities for both organic and inorganic growth in what may be a period of elevated uncertainty as the UK negotiates its exit from the EU. In its interim results STB showed strong growth, despite taking a more cautious stance in areas of its business before the EU referendum.
Year |
Operating income (£m) |
PBT* |
EPS* |
DPS** |
P/E |
Yield |
12/14 |
63.7 |
17.5 |
155.8 |
68.0 |
13.7 |
3.2 |
12/15 |
92.1 |
24.8 |
170.4 |
72.0 |
12.5 |
3.4 |
12/16e |
121.2 |
33.1 |
145.6 |
74.0 |
14.6 |
3.5 |
12/17e |
152.3 |
47.4 |
200.5 |
95.0 |
10.6 |
4.5 |
Note: *PBT and EPS are normalised, excluding amortisation of acquired intangibles, exceptional items and share-based payments. **2015 DPS ex 165p special dividend.
Interim results
In the first half, loan book growth of 51% since the same period last year fed into an increase in continuing operating income of 34% and a 54% rise in underlying profit before tax to £17.4m. The sale of Everyday Loans Group (ELG) realised a profit of nearly £117m, prompting a special dividend of 165p and contributing significantly to the £209m uplift in shareholders’ equity since STB’s IPO in 2011 (see page 2).
Outlook
While the outcome of the EU referendum has added to the uncertainties surrounding the outlook for the UK economy, the argument for a significant market opportunity for specialist lenders such as STB remains intact. The large incumbent banks seem likely to remain focused on core activities and managing capital ratios. With its long history, experienced management team, a common equity tier 1 ratio of over 20% and limited exposure to interbank funding, STB is well placed to manage any near-term bumpiness in market or economic conditions and take opportunities as they emerge.
Valuation: Recent weakness increases upside
A period of share price weakness for challenger banks has had some impact on the STB share price leaving it still ‘in the pack’ when we compare price to book and returns on equity (Exhibit 8). Prospective growth and strengthening returns on equity suggest potential upside and refreshing our ROE/COE calculation points to a valuation of c 3,400p (previously 3,600p), indicating potential upside of more than 50% once the market forms a clearer view of the economic backdrop.
Company description: Growth and broader scope
Incorporated in 1954, STB is a well-established specialist lender that between 1985 and June this year was a subsidiary of Arbuthnot Banking Group (ARBB). It became independent following a sale of shares to institutional shareholders that took ARBB’s stake from 51.9% to 18.9%. ARBB undertook not to sell further STB shares for 180 days from completion (16 June), unless agreed by sole bookrunner, Stifel.
Floated on AIM in 2011, STB is seeking to move to a premium listing on the Main Market of the London Stock Exchange. To address the corporate governance structure as part of this process Sir Henry Angest, the chief executive of ARBB, is to be succeeded as non-executive chairman of STB by Lord Forsyth, who joined the board in 2014. The move to the Main Market, which will not involve raising any new capital, is expected to be completed by the end of 2016.
STB has traditionally focused on providing banking services to customers who may not have been well serviced by the large incumbent banks. The scope of business has progressively broadened in recent years from consumer unsecured lending to include motor, retail point of sale and business finance (which includes real estate finance, invoice discounting, factoring and asset finance). Since the financial crisis, the pace of loan growth has been rapid (59% annual compound 2010-H116), focused in particular on secured lending. The trend towards secured lending was accelerated by the sale of ELG, announced last year and completed in April this year. This generated a profit of £116.8m that supported the payment of a special dividend of 165p and provides substantial capital headroom with a common equity tier one (CET1) ratio of 20.1% at the half-year end. STB is developing a new mortgage business (first charge mortgages only and no buy to let), which is due to launch in 2016/17. Management has indicated that it aims to achieve three broadly equal legs to the business: consumer, business and mortgage lending.
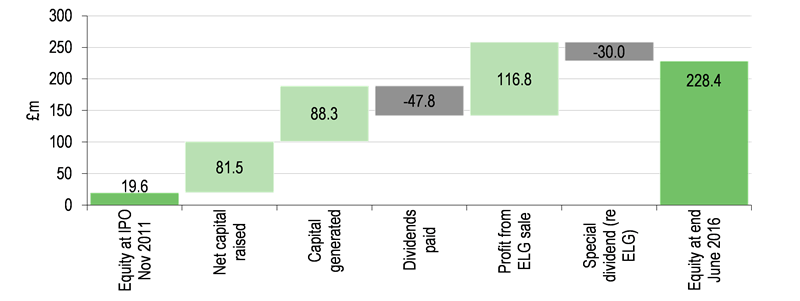
Exhibit 1 illustrates the increase in shareholders equity since STB’s IPO in 2011, from £19.6m to £228.4m, after £47.8m in ordinary dividends and the £30m special dividend relating to ELG. Adding back these dividends would give a total of £306.2m, of which 27% came from new equity issuance, 29% from capital generated and 38% from the sale of ELG.
|
Exhibit 1: Growth in shareholders’ equity since IPO |
|
|
Source: Secure Trust Bank |
Interim results to end June 2016
Key events in the first half were the completion of the ELG sale and announcement of the reduction in ARBB’s stake. The first influenced the reported figures with the gain on the ELG sale helping to boost profits after tax from £12.9m in the same period last year to £129.1m. Main points from the results are summarised below.
■
Compared with the first half of 2015 and excluding ELG, the loan book increased by 51% to £1.1bn.
■
Loan growth from the year end was more moderate, at 17.5% (see comments below).
■
Continuing operating income increased 34% from H115 to £57.3m and underlying profit before tax was £17.4m, up 54% (both excluding ELG). EPS on the same basis was 78.5p (+57%).
■
The normalised, annualised return on average equity was 16.1% while the return on required equity was 26.9% (based on equity at a target CET1 of 12%), indicating the potential returns available as surplus capital is deployed.
■
The interim dividend was 17p, which is unchanged.
■
Disposal of ELG completed (13 April), generating a post-tax profit of £116.8m; reflecting a special dividend of 165p, or c £30m, paid 27 July.
Lending
As noted, customer lending growth has remained strong and compound annual growth has been 59% since 2010 (see Exhibit 2, which shows overall growth excluding ELG). The somewhat slower rate of growth in the first half, an increase of 17.5% from the year end, reflects deliberate restraint in the real estate and personal lending areas. The bank took a more cautious view on real-estate lending in the first half, reflecting uncertainty ahead of the EU referendum. The real estate loan book is primarily exposed to residential rather than historically more volatile commercial property; lending for investment in commercial property only accounted for £31m or under 9% of the real estate loan book and even here properties are mixed and mainly residential. Real estate lending is otherwise split between loans to residential property developers (45%) and professional buy-to-let investors (47%). Leverage ratios for development loans are limited to 60% of the gross development value or 50% if loans are made for development in central London (the average for outstanding loans, if all lines were drawn, would be 56%). In the case of buy to let, the average LTV is reported as 58%.
As shown in Exhibit 3, both real estate and personal lending were slightly below the level at the year end. Stripping these areas out, loan growth was 35% compared with 31% and 30% in the previous two half-year periods.
|
Exhibit 2: STB customer loans since 2010 |
Exhibit 3: STB segmental customer loans (£m) |
|
|
|
Source: Secure Trust Bank. Note: ex-ELG. |
Source: Secure Trust Bank Note: ex-ELG. |
|
Exhibit 2: STB customer loans since 2010 |
|
|
Source: Secure Trust Bank. Note: ex-ELG. |
|
Exhibit 3: STB segmental customer loans (£m) |
|
|
Source: Secure Trust Bank Note: ex-ELG. |
Net interest income and impairments
STB’s first-half net interest income increased by 38% over the same period last year (excluding ELG), compared with growth in average loan balances of 50% with the differential reflecting changes in loan mix including the contraction in personal lending and expansion in asset-based lending where the net interest income margin is narrower.
The impairment charge increased by 66% but as a percentage of average balances decreased from 3.0% to 2.6% and even where there were segmental increases within this (personal loans, motor loans and retail finance) management indicates that this reflected mix changes and was in line with expectations.
Funding and capital
The group has limited exposure to wholesale and interbank funding. Fixed-term, fixed-rate customer lending is broadly matched with customer deposits on a similar basis. The structure of deposits has moved slightly further towards term deposits, which now account for 61.7% of the total compared with 57% at the year end. In line with market rates, the cost of funds has been falling in recent years and the annualised interest cost for the first half was 2.14% compared with 2.61% for FY16 and 3.09% in FY13. The period-end loan to deposit ratio ticked up slightly from 104% at end 2015 to 108% reflecting the use of surplus liquidity arising from the ELG sale rather than deposit funding.
The CET1 ratio stood at 20.1% at the end of the first half compared with 13.6% at the end of 2015 and the leverage ratio increased from 10.4% to 15.8% (compared with the 4% minimum stipulated by the Prudential Regulation Authority), both highlighting the capital headroom the bank has to support organic loan book growth. On our estimates, with loan growth of 92% between end-2015 and end 2018e, the CET 1 ratio would remain above 11%.
Management has also made clear that it would review opportunities for inorganic growth and the growth in the number of specialist lenders/challenger banks could provide scope for accretive consolidation at some point. In this event, the existing surplus capital could be helpful but STB’s new status as an independent company and its proposed move to the Main Market should facilitate equity issuance increasing the strategic options.
Outlook: Uncertainty and opportunity
The potential for strong loan growth at STB and other specialist lenders remains in place with a significant market to address as the major incumbent banks continue to focus on core areas and ensuring capital ratios are maintained or strengthened. The near to medium-term macroeconomic overlay has become more uncertain in the wake of the EU referendum and, in the event of markedly negative impact on the economy, loan growth and impairments could be adversely affected for a period. STB stands ready to adjust its approach according to market conditions and, as noted above, had already adopted a more cautious stance in some of the more economically sensitive areas of its loan book, a prudent approach it retains but will keep under review. Growth will be sought where the opportunities match its risk appetite.
When setting our forecast assumptions, we have allowed for the current caution around real estate lending but note the potential sensitivity of growth and credit risk estimates to a significant worsening in the economic background were this to emerge. STB’s strong capital position means it has entered this phase of increased uncertainty particularly well positioned to exploit opportunities that may arise. The bank has expressed its hope that Brexit facilitates regulatory changes that would mitigate the capital disadvantage they, and other smaller banks, have compared with larger banks in areas such as mortgage lending. On a longer view, this could enable a widening of the specialist/challenger banks’ target market and growth opportunities.
Financials
A segmental analysis of the historical loan book and our assumed figures for the estimated years are shown in Exhibit 4. Features to note include: (1) the strong overall growth expected, reflecting the anticipated employment of the capital generated by the sale of ELG; (2) the initial lending in the new mortgage business is visible in 2017 but is now at a lower level as STB seems likely to launch this at a slower pace than we had previously expected; and (3) real estate lending is expected to grow but more modestly than before.
Exhibit 4: Loan book estimates
£m |
2014 |
2015 |
2016e |
2017e |
2018e |
Personal unsecured |
88 |
74 |
75 |
79 |
83 |
Motor vehicles |
138 |
166 |
249 |
298 |
358 |
Retail finance |
117 |
220 |
320 |
399 |
499 |
Mortgage |
0 |
0 |
0 |
75 |
300 |
Total retail lending |
342 |
460 |
643 |
851 |
1,240 |
Real estate finance |
134 |
368 |
400 |
600 |
810 |
Asset finance |
5 |
71 |
150 |
203 |
243 |
Commercial finance |
5 |
29 |
75 |
150 |
200 |
Total commercial lending |
143 |
468 |
625 |
953 |
1,253 |
Other |
43 |
32 |
58 |
58 |
58 |
Discontinued |
94 |
114 |
0 |
0 |
0 |
Total lending |
623 |
961 |
1,326 |
1,862 |
2,551 |
Source: Edison Investment Research, Secure Trust Bank
Our estimate of total lending is trimmed by c 7% for 2016 and 2017 with only a marginal change for 2018; compound annual growth over the forecast period is still expected to be high at 38%. Adjustments in our loan book assumptions drive mix changes, which in turn influence our net interest income estimates (margin slightly higher) and impairment charges (also slightly higher as a percentage of average loan balances). The current year will bear the costs associated with seeking a listing on the main exchange (estimated at £3m) but these are excluded from the normalised profit and EPS as are items relating to the ELG sale. The resulting changes in our estimates are summarised in Exhibit 5.
Exhibit 5: Estimate changes
Operating income (£m)* |
Normalised PBT (£m) |
Normalised EPS (p) |
Dividend (p) |
|||||||||
Old |
New |
% chg. |
Old |
New |
% chg. |
Old |
New |
% chg. |
Old |
New |
% chg. |
|
2016e |
123.8 |
121.2 |
(2.1) |
33.9 |
33.1 |
(2.4) |
155.9 |
145.6 |
(6.6) |
76.0 |
74.0 |
(2.6) |
2017e |
147.1 |
152.3 |
3.6 |
49.8 |
47.4 |
(4.8) |
217.2 |
200.5 |
(7.7) |
95.0 |
95.0 |
0.0 |
Source: Edison Investment Research. Note: *Total operating income including net interest income and net fees.
Valuation
As a starting point we have updated our comparative table for challenger banks and a number of specialist lenders. The companies are differentiated by size, business mix and strategy but may give some context for assessing the valuation of STB. As measured by the historical P/E ratio STB is above the average while it trades on an average price to NAV, within a wide range. Its return on equity is relatively depressed by excess capital although still above the average, which also spans a wide range including Metrobank, which is currently growing towards profitability.
Exhibit 6: Challenger/specialist lenders comparative table
Price (p) |
Market cap (£m) |
Historic P/E (x) |
Yield (%) |
ROE (%) |
Price/NAV (x) |
|
Secure Trust Bank |
2,186.0 |
397.7 |
13.9 |
3.3 |
16.1 |
1.7 |
Arbuthnot Banking Group |
1,495.5 |
222.7 |
17.3 |
1.9 |
2.0 |
0.8 |
1PM |
66.5 |
34.9 |
18.0 |
0.5 |
10.8 |
1.4 |
Aldermore |
139.0 |
479.2 |
6.1 |
0.0 |
17.2 |
0.9 |
Close Brothers |
1,255.0 |
1,882.1 |
10.0 |
4.3 |
18.2 |
1.8 |
CYBG |
260.2 |
2,293.1 |
negative |
0.0 |
7.0 |
0.6 |
Metrobank |
2,067.0 |
1,659.7 |
negative |
0.0 |
-2.4 |
2.1 |
OneSavings Bank |
205.4 |
499.3 |
6.0 |
4.2 |
29.1 |
1.6 |
Paragon |
274.0 |
776.7 |
7.7 |
4.0 |
11.8 |
0.8 |
Private and Commercial Finance |
30.8 |
48.9 |
12.3 |
0.0 |
15.1 |
2.1 |
Provident Financial |
2,702.0 |
3,989.4 |
17.8 |
4.4 |
38.6 |
5.4 |
Shawbrook |
189.4 |
474.4 |
7.9 |
0.0 |
20.0 |
1.3 |
S&U |
2354.5 |
281.4 |
4.0 |
3.2% |
15.2 |
2.2 |
Simple average |
11.0 |
1.7 |
15.3 |
1.7 |
Source: Bloomberg, Edison Investment Research. Note: Prices as at 29 July 2016. P/E ratios last reported.
Our next comparison plots price to net asset value versus return on equity. Given its current losses, Metrobank is an outlier, but placing it on its target ROE of 20% would put it in line with the peer group. Although STB’s return on equity is set to fall this year, on our estimates, it is set to rise towards 20% in subsequent years and growth in loan book and earnings are expected to be strong. We would therefore argue that its ‘in line’ positioning compared with peers is supportive or encouraging given the potential for significant upside depending on its relative prospective growth.
|
Exhibit 7: Challenger banks/specialist lenders P/NAV versus ROE |
|
|
Source: Bloomberg, Edison Investment Research. Note: ALD (Aldermore), ARBB (Arbuthnot Banking Grp), CBG (Close Brothers), CYBG (CYBG), MTRO (Metrobank), OPM (1PM), OSB (OneSavings Bank), PAG (Paragon), PFC (Private and Commercial Finance), PFG (Provident Financial), SHAW (Shawbrook), SUS (S&U). |
Finally, we have refreshed our ROE/COE valuation for STB, basing this on the end H116 NAV. Using a 10% cost of equity, nominal growth of 5% together with a return on equity of 18.5% (similar to our estimate for 2018) the value indicated is c 3,400p (3,600p previously, reflecting a slightly higher ROE assumption), 59% above the current share price. The implied upside has widened following share price weakness leading up to and following the EU referendum vote. Over the last three months, the share prices for the peer group shown were, on a simple average, down 6% but STB fell 16% while Aldermore, OneSavings Bank and Shawbrook were all more than 20% lower. Cautious sentiment may mean the STB valuation is not realised rapidly but, as a clearer view of the Brexit process and economic prospects starts to emerge, confidence in this specialist lender may grow. The current caution is underlined when we reverse the ROE/COE calculation with the current share price suggesting the market is discounting an ROE of only 14%.
Exhibit 8: Financial summary (£m except where stated)
Year end December |
2014 |
2015 |
2016e |
2017e |
2018e |
Net interest income |
49.2 |
78.9 |
107.2 |
138.0 |
174.2 |
Net commission income |
14.5 |
13.2 |
14.0 |
14.3 |
14.4 |
Total operating income |
63.7 |
92.1 |
121.2 |
152.3 |
188.6 |
Total G&A expenses (exc non-recurring items) below |
(37.5) |
(50.5) |
(67.3) |
(69.2) |
(83.0) |
Operating profit pre impairments & exceptionals |
26.2 |
41.6 |
53.9 |
83.1 |
105.6 |
Impairment charges on loans |
(8.7) |
(16.8) |
(28.3) |
(36.8) |
(44.6) |
Other income |
0.0 |
0.0 |
0.0 |
0.0 |
0.0 |
Operating profit post impairments |
17.5 |
24.8 |
25.6 |
46.2 |
61.1 |
Non-recurring items |
0.0 |
0.0 |
0.0 |
0.0 |
0.0 |
Pre tax profit |
17.5 |
24.8 |
25.6 |
46.2 |
61.1 |
CorporationTax |
(3.6) |
(5.5) |
(4.8) |
(9.0) |
(10.8) |
Tax rate |
20.6% |
22.2% |
19.0% |
19.5% |
17.7% |
Bank tax surcharge |
0.0 |
0.0 |
(0.0) |
(1.7) |
(2.9) |
Profit after tax - continuing basis |
13.9 |
19.3 |
20.7 |
35.5 |
47.4 |
Discontinued business |
6.6 |
9.4 |
118.8 |
0.0 |
0.0 |
(Loss)/profit for year |
20.5 |
28.7 |
139.5 |
35.5 |
47.4 |
Minority interests |
0.0 |
0.0 |
0.0 |
0.0 |
0.0 |
Net income attributable to equity shareholders |
20.5 |
28.7 |
139.5 |
35.5 |
47.4 |
Company reported pre-tax earnings adjustments |
7.2 |
2.8 |
7.5 |
1.2 |
1.0 |
Company reported underlying pre-tax earnings (inc discontinued) |
33.3 |
39.3 |
33.1 |
47.4 |
62.1 |
Company reported underlying earnings after tax and minorities (inc discontinued) |
26.1 |
31.0 |
26.5 |
36.5 |
48.2 |
Average basic number os shares in issue (m) |
16.7 |
18.2 |
18.2 |
18.2 |
18.2 |
Average diluted number of shares in issue (m) |
17.1 |
18.5 |
18.5 |
18.5 |
18.5 |
Reported diluted EPS (p) |
81.5 |
104.1 |
111.5 |
191.5 |
255.4 |
Underlying diluted EPS (p) |
155.8 |
170.4 |
145.6 |
200.5 |
265.0 |
Ordinary DPS (p) |
68.0 |
72.0 |
74.0 |
95.0 |
107.0 |
Special DPS (p) |
0.0 |
165.0 |
0.0 |
0.0 |
0.0 |
Net interest/average loans |
9.71% |
9.97% |
9.38% |
8.66% |
7.90% |
Impairments/average loans |
1.72% |
2.12% |
2.48% |
2.31% |
2.02% |
Cost income ratio |
58.9% |
54.8% |
55.5% |
45.5% |
44.0% |
Net customer loans |
622.5 |
960.6 |
1,326.0 |
1,861.9 |
2,550.8 |
Other assets |
159.8 |
286.8 |
271.6 |
328.6 |
381.2 |
Total assets |
782.3 |
1,247.4 |
1,597.6 |
2,190.5 |
2,932.0 |
Total customer deposits |
608.4 |
1,033.1 |
1,312.9 |
1,825.4 |
2,500.8 |
Other liabilities |
49.0 |
73.1 |
49.0 |
107.9 |
144.2 |
Total liabilities |
657.4 |
1,106.2 |
1,361.9 |
1,933.3 |
2,645.1 |
Net assets |
124.9 |
141.2 |
235.7 |
257.2 |
286.9 |
Minorities |
0.0 |
0.0 |
0.0 |
0.0 |
0.0 |
Shareholders' equity |
124.9 |
141.2 |
235.7 |
257.2 |
286.9 |
Opening shareholders' equity |
61.6 |
124.9 |
141.2 |
237.8 |
259.3 |
Profit in period |
20.5 |
28.7 |
139.5 |
35.5 |
47.4 |
Other comprehensive income |
0.4 |
0.0 |
0.0 |
0.0 |
0.0 |
Ordinary dividends |
(10.2) |
(12.6) |
(13.1) |
(14.0) |
(17.6) |
Special dividend |
0.0 |
0.0 |
(30.0) |
0.0 |
0.0 |
Share based payments |
0.5 |
0.2 |
0.2 |
0.0 |
0.0 |
Issue of shares |
53.3 |
0.0 |
0.0 |
0.0 |
0.0 |
Share issuance costs |
(1.2) |
0.0 |
0.0 |
0.0 |
0.0 |
Closing shareholders' equity |
124.9 |
141.2 |
237.8 |
259.3 |
289.0 |
Period end shares in issue (m) |
18.2 |
18.2 |
18.2 |
18.2 |
18.2 |
NAV per share (p) |
687 |
776 |
1,296 |
1,414 |
1,577 |
Tangible NAV per share (tNAV) (p) |
641 |
738 |
1,257 |
1,375 |
1,539 |
Return on average tNAV |
29.0% |
25.2% |
13.2% |
15.4% |
18.5% |
Average loans |
477.3 |
821.9 |
1,135.8 |
1,555.5 |
2,140.3 |
Average deposits |
499.7 |
827.9 |
1,107.8 |
1,528.2 |
2,098.3 |
Loans/deposits |
102.3% |
93.0% |
101.0% |
102.0% |
102.0% |
Risk exposure |
649.8 |
998.5 |
1,438.3 |
1,890.2 |
2,396.9 |
Common equity tier 1 ratio |
18.7% |
13.6% |
15.9% |
13.3% |
11.7% |
Source: Company accounts, Edison Investment Research.
|