Through a buy and build strategy, Learning Technologies Group (LTG) has established a distinctive international position in corporate e-learning with a broad range of software and service offerings. LTG has been growing apace and profit margins have been rising strongly. The recent acquisition of LMS provider NetDimensions is the last major piece in the technological jigsaw. Attractive growth drivers and synergies from the NetDimensions acquisition put the company in a strong position to generate positive surprises. Given these factors, the c 23x our FY18 EPS is not demanding and our DCF analysis indicates upside potential of 43% to 103%.
Learning Technologies Group |
Rare opportunity in e-learning technologies |
Initiation of coverage |
Software & comp services |
5 September 2017 |
Share price performance
Business description
Next events
Analysts
Learning Technologies Group is a research client of Edison Investment Research Limited |
|||||||||||||||||||||||||||||||||||||||||||||||
Through a buy and build strategy, Learning Technologies Group (LTG) has established a distinctive international position in corporate e-learning with a broad range of software and service offerings. LTG has been growing apace and profit margins have been rising strongly. The recent acquisition of LMS provider NetDimensions is the last major piece in the technological jigsaw. Attractive growth drivers and synergies from the NetDimensions acquisition put the company in a strong position to generate positive surprises. Given these factors, the c 23x our FY18 EPS is not demanding and our DCF analysis indicates upside potential of 43% to 103%.
Year end |
Revenue (£m) |
PBT* |
EPS* |
DPS |
P/E |
Yield |
12/15 |
19.9 |
3.9 |
0.76 |
0.15 |
62.6 |
0.3 |
12/16 |
28.3 |
6.4 |
1.18 |
0.21 |
40.1 |
0.4 |
12/17e |
49.5 |
9.7 |
1.46 |
0.28 |
32.5 |
0.6 |
12/18e |
57.7 |
14.9 |
2.10 |
0.38 |
22.6 |
0.8 |
Note: *PBT and EPS are normalised, excluding amortisation of acquired intangibles, exceptional items and share-based payments.
Investment case: e-learning consolidator
LTG is consolidating the corporate learning technologies space, having made six acquisitions since it joined AIM in 2013. The corporate e-learning industry is growing at rates in the mid-teens supported by a structural shift to online/blended learning. LTG has benefited from its increased scale and profit margins have been rising. The recent investment in software platforms is boosting earnings quality and margins should continue to move higher. Following the NetDimensions deal, more than 40% of revenues are recurring in nature, up from 10% in FY14.
H1 trading update: Strong growth, record order book
Management reported strong organic growth in H1 along with a record order book. Notably, LEO achieved 50% growth in sales over H116. The 100-day plan to reduce operating costs and integrate NetDimensions into the group has been successfully completed on time and the transformation program will continue into H217.
Forecasts: Robust growth and margin profile
Our near-term forecasts are complicated by acquisition activity, particularly the acquisition, restructuring and integration of NetDimensions, where the company is adopting consistent revenue recognition policies, is reducing NetDimensions’ costs to $16m and focusing on bedding down the integration (hence revenue contribution of $24m in FY18e vs $25.6m in FY15). Once complete we conservatively expect to see a group growing at a robust, high single-digit organic rate generating mid-20s operating margins and healthy levels of cash. With strong execution and if market conditions remain buoyant, mid-teens growth and c 30% margins may be possible.
Valuation: DCF analysis suggests 56-77p range
Given these qualities we do not believe that the current PE rating of c 23x in FY18 and 21x in FY19 is at all demanding. Our DCF model suggests a value of 68-97p if management can generate organic growth rates in the mid teens and drive operating margins to 30% from 24.6% in FY16. Further acquisitions could also increase the company’s scale and enhance earnings.
Investment summary: Rare opportunity in e-learning technologies
Company description: Learning technologies consolidator
LTG was established to consolidate the learning technologies space. Traditionally, LTG was a services business, building e-learning content solutions for enterprises, both in the private and public sectors. Through acquisition, LTG has added a specialist in the financial services sector – Eukleia – and a gamification specialist – Preloaded – to its services portfolio. LTG has also added a software business called Rustici that provides Application Programming Interface conformance software – essentially digital plumbing for the e-learning industry and it has developed its own authoring tool, gomo, which is very helpful for establishing customer relationships. The most recent acquisition, NetDimensions, brings a respected learning management system (LMS) with a strong customer base to the portfolio.
Financials: Profit margins rose strongly in FY15 and FY16
When LTG joined AIM in November 2013, management’s stated aim was to generate revenues of £50m in the medium term and LTG is well on target to meet this goal. Since then, the company has made six acquisitions and revenue has risen nearly 300% in just three years. The acquisitions of NetDimensions and Rustici, as well as the in-house development of gomo, have added cash generating software solutions to the portfolio. These software solutions all have rental business models and we estimate that more than 40% of group revenues are recurring in nature. The most recent of these acquisitions – NetDimensions – is easily the group’s biggest acquisition at £53.6m. We forecast revenue to grow 75% in FY17 to £49.5m and 16% in FY17 to £57.7m, with margins falling in FY17 due to the low margins at NetDimensions, but rising in FY18 and FY19 as synergies come through. The group had net debt of £6.1m at 30 June, or £9.8m after including the final payments for NetDimensions and share options exercised near the period end. In addition, there are contingent acquisition liabilities of c £7.4m that are expected to be paid over three years.
Sensitivities: Managing the growth
As with all companies pursuing a consolidation strategy, selecting the right acquisitions, maintaining price discipline and successfully integrating the new businesses will be key to success. We believe that the company’s track record so far, particularly delivery on the 100-day integration plan for NetDimensions, offers reassurance in this regard. There can be challenges for a fast-growing technology-driven business in recruiting suitably experienced employees, and in the availability of freelancers when the company has a high level of projects, although the CSL project run in FY16 demonstrates how the group can scale quickly. The corporate e-learning market is characterised by an evolving technological backdrop, evolving industry standards, changes in customer needs, competition and frequent new product introductions. IT and HR budgets are subject to changes in economic cycles, although many of the group’s customers are required by regulation to offer training, which may provide some resilience. On the LMS side, the group’s smaller scale may put it at a disadvantage to its larger US multi-tenant SaaS competitors, although NetDimensions’ platform provides certain barriers to entry.
Valuation: Plenty of upside if LTG can sustain the growth.
The stock trades on c 32.5x our FY17e earnings, falling to c 22.6x in FY18 and c 20.9x in FY19. Our DCF model suggests a value of 68-97p if management can sustain organic growth rates in the low teens and drive operating margins to 30% from 24.6% in FY16. This outlook is supported by an industry growing in the mid-teens and the group’s expanding high-margin software portfolio. Our valuation scenario does not include any potential future acquisitions.
Company description: High-growth e-learning business
Learning Technologies Group owns a diversified portfolio of e-learning technology businesses, comprising both services-based content delivery along with related software offerings. Based in London, the group has c 470 employees. The employee split as follows: production – c 230, administration – c 46, management – c 7; and c 185 from the recently acquired NetDimensions.
Background
LTG was created in November 2013 through the acquisition of Epic Group by an AIM shell company, which duly changed its name to LTG. The deal valued Epic at £16.5m, comprising 255m shares and £1.2m in cash. Established in 1986, Epic was a fast-growing e-learning business (16.5% CAGR over FY10 to FY12), having already established an impressive customer list including Bridgestone, Deloitte, easyJet, H&M, Lloyds Banking Group and Pearson. Epic was based in Brighton and had offices in Rio de Janeiro, Brazil and New York, US. The following April, LTG acquired LINE Communications, and LTG promptly merged LINE with Epic Group to form LEO. Five additional acquisitions have since been made, as shown in Exhibit 1. Preloaded brought gamification capabilities to the group, while Eukleia added a specialism in financial services. Rustici added a valuable high-growth software asset, and Watershed brought an investment in a related high-growth analytics provider. The acquisition of NetDimensions added an established LMS and is seen as the last key technological capability the group required.
Exhibit 1: Acquisition history
Acq’n date |
Description |
Location |
Owner-ship |
Consideration |
Trailing revenue |
Multiple (x) |
Trailing EBITDA |
Multiple (x) |
||||
Cash |
Shares |
Deferred |
Total |
|||||||||
LINE |
Apr-14 |
Blended e-learning solutions |
London, Sheffield |
100% |
£5.1m |
£3.9m |
0.0 |
£9.0m |
£8.5m |
1.1 |
£0.9m |
10.3 |
Preloaded |
May-14 |
Developer of “games with purpose” |
London |
100% |
£1.6m |
£0.6m |
£3.4m |
£5.6m |
£1.8m |
3.1 |
£0.6m |
9.5 |
Eukleia |
Jul-15 |
E-learning GRC services to financial services sector |
London |
100% |
£6.8m |
£1.5m |
£3.5m |
£11.8m |
£4.9m |
2.4 |
£0.6m |
19.7 |
Rustici |
Jan-16 |
Digital learning inter-operability solutions |
Nashville, US |
100% |
$20.5m |
$6.2m |
$11.0m |
$37.7m |
$6.6m |
5.7 |
$2.7m |
14.0 |
Watershed |
Jan-16 |
Learning analytics developer (xAPI) |
Nashville, US |
27% |
$3.0m |
0.0 |
0.0 |
$3.0m |
0 |
N/A |
0.0 |
N/A |
NetDimensions* |
Mar-17 |
Global enterprise solutions provider of talent & learning management systems |
Hong Kong |
100% |
£44.3m |
0.0 |
0.0 |
£46.8m* |
£19.2m |
2.4 |
£1.5m |
31.2 |
Source: Learning Technologies Group, Regulatory News. Note: *£53.6m cash, less an estimated £6.8m net cash acquired.
Strategy: An emphasis on acquisitions
LTG is building on the success of its existing ventures, and plans to continue its growth through strategic acquisitions and diversification. The learning technologies sector is enjoying unprecedented global growth and there is considerable investor interest, including private equity firms that are attempting a sector consolidation. LTG is unusually positioned as a listed company focused on consolidating the learning technologies sector.
In the short term, LTG is focused on integrating NetDimensions. Further out, LTG seeks to make additional acquisitions to extend technological skills and geographical reach. It might also consider investing in businesses with strong management and requiring capital to scale the business. Key focuses include products and services where there is non-discretionary spend and with repeat revenues in software and content. Management regards LTG as being underweight in the US (c 30% revenues, mostly Rustici), and expanding in the US is a priority. There are a number of ways the group could expand in the US, eg, by bulking up LEO, or through buying a sector specialist in, for example, pharma or healthcare, though this could also be achieved organically. LTG also sees an opportunity to expand in Asia, but this is less of a priority.
Corporate e-learning: A fast-growing market
The corporate training market is well established and globally is estimated to be worth c $359bn. As companies and entities turn increasingly to digital solutions, corporate e-learning, where LTG is positioned, is the fastest-growing segment within this market. The continuing professional development (CPD) initiative in the UK is a driver in the corporate training market, and possibly with a slight bias in the e-learning segment of corporate training.
|
Exhibit 2: Corporate training market versus the e-learning market |
|
|
Source: Edison Investment Research |
Corporate e-learning growing at 15-20% per annum
While the corporate training market has been fairly flat, the e-learning segment within that market has been growing at pace (LTG estimates this at 15-20%). In particular, there is a structural shift to blended learning, which enables organisations to reduce their training and assessments costs (primarily in relation to trainers and travel and hospitality). The overall e-learning market includes the vast education markets that LTG is not active in.
According to The Training Industry, the total global corporate training market grew by 1% in 2016 to $359.3bn, and by 2.5% CAGR since 2008. Research & Markets forecasts the global e-learning market to grow at a 7.2% CAGR over 2015-25 to reach c $325bn by 2025.
Accurate data on the corporate e-learning segment is hard to find and it depends on what is included. According to Research and Markets, the global corporate e-learning market is forecast to grow at an 11.4% CAGR during the period 2016-20.
The corporate e-learning market is broadly divided into four areas:
■
Consultancy: helping businesses to appraise their learning needs and to specify and provide solutions to meet them increasingly with the aid of data analytics.
■
Content: the production of generic and bespoke learning materials.
■
Software: includes LMSs, which are used to manage the learning process and associated content.
■
Distribution: via multi-device and variable screen size: PC, laptop, tablet, mobile. These enable employees to learn when and where they choose
LTG is well positioned with a range of businesses
LTG’s mix of businesses address all of the above categories and LTG has been ranked as a strategic leader in the annual Fosway 9-Grid for Digital Learning, while NetDimensions is attractively placed in the Fosway 9-Grid for Learning Systems. In addition, LTG’s brands have won awards; for example, Eukleia won the category of Best Advance in Training Programs that Require Global Accessibility Standards as part of the Brandon Hall Awards in 2016.
|
Exhibit 3: Digital Learning |
Exhibit 4: Learning Systems |
|
|
|
Source: FOSWAY Group |
|
Exhibit 3: Digital Learning |
|
|
Source: FOSWAY Group |
|
Exhibit 4: Learning Systems |
|
|
Source: FOSWAY Group |
A unique position in a competitive but fragmented market
LTG typically competes with large consultants or very small firms. The large consultants are less specialist, offering digital learning as part of larger project briefs, while small players lack capital backing to handle larger projects.
There are c 3,000 e-learning companies in Europe alone. These companies are mostly owner-managed and typically hit a stumbling block at around £5-10m revenues. LTG is challenging by seeking to create substance and scale. At the other end of the market there are large players such as Accenture, PwC and Babcock. In the US, LTG has some private mid-size peers such as Trivantis and Allen Interactions. We note that some large enterprises will not offer work to small players but will outsource to a third party. However, the larger consultants are potentially lower quality, providing content only, and if they want strategic consulting advice, they need to go to a specialist such as LTG.
LTG’s business structure and breakdown
LEO
LEO is the original core of the business, created through the merger of Epic and LINE in 2014. It has c 150 employees. LEO creates bespoke content-based e-learning solutions for public and private sector customers. The content is tailored for either the customer’s existing LMS or an open-source LMS, most likely Moodle (which is free, but more basic and less secure than a proprietary LMS). LEO opened its first North American office in New York in November 2012 to better deliver its services to customers in the US, the world’s largest training and education market. This also gave it access to North American companies and public bodies that only procure from within the local market.
LEO Brazil, based in Rio de Janeiro, was established as a 50:50 JV in 2011 to access the emerging South American e-learning market. LEO Brazil operates through a local partner led by its CEO Richard Vasconcelos and a notable contract win was to provide e-learning for the 2016 Olympics.
Managing the financial success of the services business is all about maximising utilisation rates and ensuring that client projects are delivered on time and on budget. LTG carefully monitors the sales pipeline and order book at any one time and sizes the workforce in anticipation. When demand is strong, the company will call on freelancers, who typically carry out 10% of the work. In the case of the mammoth CSL contract, LEO expanded its freelancer workforce by c 50%.
Civil Service Learning (CSL) case study
In December 2015, LEO, as part of a consortium led by KPMG, was awarded a major contract to redevelop the Civil Service Learning (CSL) curriculum. The contract, which was previously split and held by Epic and Capita, was tendered by the UK government in 2015 as a blended offering (ie combining digital learning and face to face training). As part of the KPMG consortium, LEO provided all the digital capabilities for the CSL curriculum that is used by c 418,000 learners. LEO carried out all the work in FY16, but it gets paid as the civil servants do the courses. Hence, only a small amount of revenue has so far been recognised and LEO expects to receive the majority over the remainder of the three-year contract, which ends in 2018. The UK government has an option to extend the contract to 2019, after which it may be put out to tender again. We understand that the CSL Moodle platform is the second largest of its kind in the world. The coursework was completely redeveloped from scratch and is delivered through the open-source LMS Moodle. Of the money that comes into the consortium from CSL, the third parties get paid first, after which upfront costs are recovered by KPMG and LEO. Consequently, the timing of the payment to LEO has an element of uncertainty.
Eukleia
Founded in 2005, Eukleia is a specialist governance, risk and compliance (GRC) training consultancy. Its capabilities cover all aspects of training analysis and design through to course delivery and assessment. Eukleia uses the full range of delivery methods, from classroom through to web and video. Eukleia has a strong financial services heritage and helps many of the world’s leading banks deliver their global compliance training programmes. It also helps non-financial services firms manage their reputational and compliance risk in sectors as diverse as energy, clothing and motorsport. Eukleia has five to six in-house regulatory experts and c 10 support people, with the balance in studio generating content.
Preloaded
Founded in 2000, Preloaded has a leading reputation as a BAFTA-winning applied games studio, designing games to utilise the power of gaming to engage, educate and communicate in the areas of learning, health, engagement and training. Preloaded works for organisations across the education, entertainment, publishing, advertising and broadcasting sectors, with clients such as Amplify (a subsidiary of News Corp), Disney, Science Museum Group, Wellcome and the BBC.
gomo
gomo is a software product offering that enables clients to generate their own learning content in HTLM5 for all devices and screen sizes. The solution allows users to distribute courses instantly and track their usage. gomo was developed in-house by LTG and its client base includes PwC, BBC and the Foreign and Commonwealth Office. gomo operates on a software-as-a-service (SaaS) basis and hence delivers very high levels of recurring revenues and strong cash flows. gomo is very useful for building customer relationships. For example, Burberry uses gomo to generate content in house, but every once in a while will need support from LEO for a major product launch.
Rustici Software
Established in 2002, Rustici Software’s expertise is in e-learning standards. Based in Nashville, US, Rustici has c 35 employees. Rustici is the expert plumber of the industry, providing the technology that connects e-learning software for organisations and vendors everywhere. SCORM (and latterly xAPI) allows disparate types of content to work on disparate platforms. SCORM is an aged system from the late 1990s that was not built for the wireless age. Rustici makes it work elegantly. Conforming to e-learning standards is difficult and time consuming, and Rustici Software’s products make it much faster and much more cost-effective.
SCORM (Sharable Content Object Reference Model) is a collection of standards and specifications for e-learning technology. SCORM was developed in the 1990s and now struggles to keep up with developers’ demands. SCORM is an open-source standard that is universally accepted, but very clunky. Essentially, Rustici offers software patches that make SCORM work more effectively.
However, Rustici was mandated to develop a replacement for SCORM from Advanced Distributed Learning, which act as industry stewards, sponsored by the United States Department of Defense. Consequently, Rustici developed a new standard through Project Tincan, now called xAPI, in 2013, which is expected to replace SCORM over time. This may mean declining SCORM-optimisation business for Rustici, but, as it developed xAPI, Rustici remains at the forefront of the industry.
Watershed
When LTG acquired Rustici, it simultaneously invested $3m in a 27% stake in Watershed Systems, a start-up learning analytics business spun out of Rustici. Watershed analyses training data, measuring how effective training is. The business is run by the vendors of Rustici, who developed the Tincan API or xAPI standard while at Rustici. xAPI is well set to replace the obsolete SCORM as the new industry standard. LTG points out that Watershed needs independence in order to gain strong credibility in the marketplace.
Acquisition of NetDimensions
This is a very significant deal for LTG; at the time the deal was announced in early February 2017, LTG had a market capitalisation of £189m, while LTG was paying £53.6m in cash for NetDimensions. The last published accounts of NetDimensions showed net cash of $11.2m as at 30 June 2016, much of which we understand was held in sterling. Hence, that translates to c £9m in cash and NetDimensions had no financial debt other than some insignificant finance leases. We estimate that NetDimensions’ cash position, prior to transaction costs, expanded slightly over the period up to the acquisition date, and that the deal consideration net of cash acquired was £44.3m. The acquisition was funded via a share placement and most of NetDimensions’ major shareholders transferred into LTG despite the significant valuation disparity (the acquisition valued NetDimensions at c 1.8x FY17 revenues).
We estimate that transaction costs on both sides were £3.5m, and have recorded £1.0m as an exceptional item. LTG believes it can generate savings of c $8m, through better procurement, corporation/listing costs and operational restructuring. The aim is to generate $8m of EBITDA on similar revenues. If LTG can achieve this goal, we calculate that it will have acquired NetDimensions on less than 7x EBITDA.
NetDimensions has a number of advantages, including ISO 27001 certification, which is a crucial standard for hosting, and is FDA approved, so it can sell to US healthcare providers. Its software can provide a secure audit trail to ensure that tests have been complied with. A key strategy for LTG will be to cross-sell services to NetDimensions’ 400 LMS customers, as they will require content.
About NetDimensions
Established in 1999, NetDimensions established a strong foundation in supplying LMS software and services. A learning management system (or LMS) is a software application that delivers online courses, assessments or training programmes, and incorporates administration, documentation, tracking and reporting features. The company’s strategy has been to target customers that operate in so-called high-consequence industries. These are industries where accidents or failures can be catastrophic whether that is disrupting society (eg financial services, government), damaging the environment (energy), risking consumer safety (food processing, healthcare, manufacturing, pharmaceuticals), or potentially maiming or causing loss of life (transportation). Furthermore, NetDimensions has been increasing its focus on larger customers with 5,000+ users. The group’s software is based on single tenant architecture, but multi-instance solutions are also offered using shared, or virtualised, servers. It uses the java programming language.
The group’s flagship product, NetDimensions Learning, manages the entire learning and development process from enrolment and delivery to testing, tracking and reporting. It provides a highly personalised learning environment with individual development plans, competencies, licences and certifications. Further, it has robust security as all internet requests are individually controllable and auditable, with transactions passing through a security module before being processed by back-end components. A single installation with a relatively modest hardware footprint can handle more than 500k users, while the group’s cloud-based offering can cope with even larger user numbers. The software is sold as a standalone solution, and the customer configures the software and adds the content. The software includes add-ons, such as links to WebEx, to enable online conferences.
Financials and forecasts
Business model
LEO: The revenue model is mostly fixed-price projects, typically in the £50-250k range and £50-100k is the sweet spot. A contract will typically take two to three months and a client could spend £400-500k over a year on a range of assignments. The customer relationship is built on trust and customers are very sticky, though customers often carry out work in-house as well. The vast majority of LEO’s clients have been LEO customers for a number of years.
Eukleia: Eukleia’s revenue model is mostly project-based content and delivery services as well as instructor-led training.
Preloaded: Preloaded’s revenue model is entirely project-based services.
Gomo: A SaaS business model, ie, the software is rented, paid monthly in advance. Contracts are typically for three years.
Rustici: Rustici has an annual licence model, typically with a three-year contract. 10-15% of revenue is professional services (implementation, customisation and increasingly consultancy services). The vast majority of contracts are in the £50-100k range, based on number of users.
NetDimensions: This unit operates traditional on-premise software licensing business model with associated support and maintenance, along with a broad professional services offering. Pricing of the software is based on the number of users and the group sells directly and via resellers, which extends its geographic coverage to more than 40 countries and rising. In addition to the standard perpetual licence, there is an annual licence option, which is popular with smaller customers wanting greater flexibility. The group also has a hosted single-instance SaaS option for customers that prefer to pay from the opex budget rather than capex. Both the annual licence and hosted options typically involve a three-year contract paid annually in advance. Additionally, NetDimensions offers professional services, which covers implementation, customisation, content authoring, consulting and training.
Trading history
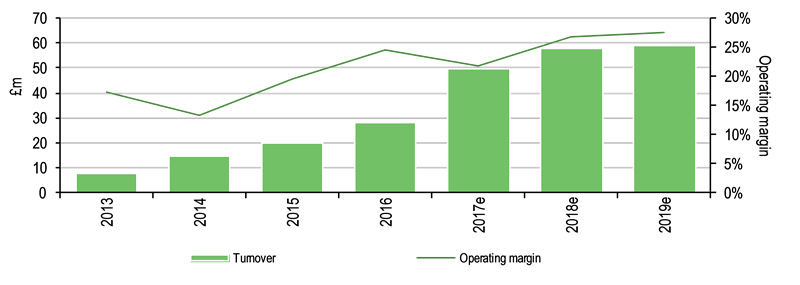
The group has grown quickly, largely via acquisition, and this makes it difficult to assess the underlying picture. The large CSL contract win in FY15 further clouds the picture as its costs have been pre-paid while revenues are mainly in FY18 and FY19. However, profit margins have been growing strongly over the last two years. The dip in FY17 is anticipated due to the integration of NetDimensions, which has not been very profitable, but we forecast margins to continue to rise as the synergies from the acquisition are realised.
|
Exhibit 5: Revenue and margin trends |
|
|
Source: Learning Technologies Group (historicals), Edison Investment Research (forecasts). |
H1 trading update: Strong growth, record order book
Management reported strong organic growth in H1 along with a record order book. Notably, LEO achieved 50% growth in sales over H116 and the CSL contract is progressing in line with expectations. LTG says that Preloaded has performed very well, delivering a prestigious VR learning simulation for the Science Museum and Eukleia is seeing an increase in demand with the introduction of MiFID II regulations. It says its software businesses are performing particularly strongly, with gomo winning a number of key enterprise contracts, while Rustici has been performing ahead of expectations.
The 100-day plan to reduce operating costs and integrate NetDimensions into the group has been successfully completed on time and the transformation program will continue into H217, with the full-year synergies and settled cost base being realised from the beginning of 2018 as planned. NetDimensions’ customer support teams have been relocated to the geographical territories that they serve and hosting services are being migrated to Nashville, while the company is investing in its core technology team headquartered in Hong Kong.
The group had net debt of £6.1m at 30 June, or £9.8m after including the final payments for NetDimensions and share options exercised near (and paid after) the period end. In addition, there are outstanding acquisition liabilities (we estimate c £10.7m as at 31 December 2016, of which a potential c £7.4m are off balance sheet) that are expected to be paid over three years.
Balance sheet
The group had £5.3m cash as at 31 December 2016, along with £13.8m debt, the bulk of which was long-term. That resulted in net debt of £8.5m. In addition, there were acquisition-related deferred liabilities of c £10.7m, which took total net debt to c £19.2m. Acquisition-related liabilities include deferred consideration amounts that are contingent on incremental revenue growth, and which we estimate at £7.4m in aggregate that will be paid over three years. The placement to fund the acquisition of NetDimensions raised £46.5m (we assume £44.2m after costs) and the acquisition cost £53.6m. NetDimensions had cash of $11.2m as at 30 June 2016 and no financial debt, albeit for some nominal finance leases. This cash is likely to have been higher at the acquisition completion date due to NetDimensions’ cash-generative Q4, and we have assumed $11.5m at acquisition. We have also conservatively assumed £2.5m of acquisition-related costs within NetDimensions prior to the deal closing.
In March 2017, LTG announced a new debt facility with Silicon Valley Bank, comprising a £10m term loan and £10m revolving credit facility, both which are available to LTG for five years. The new SVB debt facility replaced LTG's previous debt facility with Barclays Bank.
Exhibit 6: Balance sheet position
£000s |
31/12/15 |
31/12/16 |
Placement |
NetDimensions |
31/12/16 |
(after estimated costs) |
(net of estimated net cash) |
Pro forma |
|||
Cash & bank balances |
(7,305) |
(5,348) |
(44,175) |
46,826 |
(2,697) |
Short-term borrowings |
0 |
3,252 |
3,252 |
||
Long-term borrowings |
0 |
10,582 |
10,582 |
||
Net debt (cash ) |
(7,305) |
8,486 |
(44,175) |
46,826 |
11,137 |
Outstanding acquisition liabilities* |
1,249 |
10,700 |
10,700 |
||
Adjusted net debt (cash) |
(6,056) |
19,186 |
(44,175) |
46,826 |
21,837 |
Net assets |
25,144 |
30,710 |
44,175 |
0 |
74,885 |
Adjusted net debt/equity |
(24.1%) |
62.5% |
29.2% |
Source: Learning Technologies Group, Regulatory News. Note: *FY16 figure includes off-balance sheet liabilities.
Forecasts: Margins to trend upward despite FY17 dip
We forecast group revenue to rise by 75% to £49.5m in FY17, including a nine-month contribution from NetDimensions, and by 16% to £57.7m in FY18. We forecast growth to decelerate to 2% in FY19 as the CSL contract comes to an end. We conservatively forecast the services business to grow at c 7%, which is below the industry growth rates, while we forecast stronger growth from the software businesses. We forecast operating margins to dip 270bp in FY17 as the group integrates the low-margin NetDimensions, and then rebound by 500bp in FY18 as the major cost synergies from the NetDimensions acquisition feed through to the bottom line.
LEO: We forecast FY17 revenues of £18m, including £2m of recurring revenue (hosting & support, managed services) and £4m of CSL revenue. The division also includes LEO Inc in the US. We forecast 7% growth in FY18 but a 14% dip in FY19 as the CSL contract comes to an end.
Eukleia: We forecast FY17 revenues of £6.5m, growing at 7% pa. This includes £1m of recurring revenue and £5.5m of services.
Preloaded: We forecast FY17 revenues of £3.2m, growing at 7% pa.
gomo: We forecast FY17 revenues of £1.0m, growing at 50% in FY18 and 40% in FY19.
Rustici: Rustici generated revenue of £6.3m in FY16, and we forecast revenue growth of 15% over the forecast period.
NetDimensions: We forecast FY17 revenues of $24.0m ($17m recurring and $7m professional services) with no growth in FY18. This compares with $25.6m in FY15 and $26.6m that we had forecasted for FY16. Our FY17 forecast is based on a more conservative approach to revenue recognition and management will be more focused on integrating the business in the near term rather than seeking to drive new revenues, and the business has a long sales cycle of six to 18 months.
Watershed: This 27% associate still retains a healthy cash pot following the fund-raisings in 2016. This is still at start-up phase and we forecast a £0.5m loss this year, and break-even in FY18.
Investment: We forecast the group to spend £0.7m (1.4% of sales) on capital expenditure in FY17, falling to 1.2% of sales in FY18 and 1.0% in FY19. We assume 8.5% of revenue is spent on R&D (£4.2m in FY17), of which 35% is capitalised (£1.5m in FY17) and amortised over five years. We estimate a third of the capitalised R&D is from Rustici, c £150k is from gomo and the rest is from NetDimensions. On our forecasts, total investment capitalised in FY17 is £2.2m, rising to £2.4m in FY18 and easing to £2.3m in FY19. Despite the working capital outflow in FY16, which related to the structure of the CSL contract, we conservatively forecast a flat net working capital movement in FY18 and FY19 and a neutral position on working capital thereafter. We note that cash flow will benefit from the expansion in the group’s cash-generative software offerings.
Operating costs: We forecast operating costs (before R&D effects) to rise by 82% to £38.9m in FY17, boosted by the inclusion of NetDimensions, and by 9% to £42.5m in FY18.
Exhibit 7: Forecasts
£000s |
2014 |
2015 |
2016 |
2017e |
2018e |
2019e |
Revenues |
|
|
|
|
|
|
LEO |
|
|
|
18,000 |
19,260 |
16,608 |
Eukleia |
|
|
|
6,500 |
6,955 |
7,442 |
Preloaded |
|
|
|
3,200 |
3,424 |
3,664 |
gomo |
|
|
|
1,000 |
1,500 |
2,100 |
Rustici |
|
|
|
7,000 |
8,050 |
9,258 |
NetDimensions |
|
|
|
13,846 |
18,462 |
19,938 |
Total Group revenues |
14,920 |
19,905 |
28,263 |
49,546 |
57,651 |
59,010 |
Growth (%) |
97.4 |
33.4 |
42.0 |
75.3 |
16.4 |
2.4 |
Opex before depn & amortisation |
(12,893) |
(15,877) |
(21,387) |
(38,902) |
(42,471) |
(42,986) |
Capitalisation of dev costs |
198 |
310 |
796 |
1,474 |
1,715 |
1,756 |
Adjusted EBITDA |
2,225 |
4,338 |
7,672 |
12,118 |
16,895 |
17,780 |
Amortisation of dev costs |
(89) |
(216) |
(405) |
(700) |
(800) |
(899) |
Depreciation |
(171) |
(214) |
(320) |
(580) |
(621) |
(664) |
Adjusted operating profit |
1,965 |
3,908 |
6,947 |
10,838 |
15,474 |
16,217 |
Operating margin (%) |
13.2 |
19.6 |
24.6 |
21.9 |
26.8 |
27.5 |
Growth (%) |
|
98.9 |
77.8 |
56.0 |
42.8 |
4.8 |
Associates |
(160) |
(62) |
(205) |
(500) |
0 |
500 |
Net interest |
(158) |
12 |
(357) |
(650) |
(600) |
(400) |
Profit before tax norm |
1,647 |
3,858 |
6,385 |
9,688 |
14,874 |
16,317 |
Amortisation of acquired intangibles |
(570) |
(1,203) |
(3,200) |
(3,200) |
(3,200) |
(3,200) |
Share-based payments |
(583) |
(776) |
(605) |
(1,200) |
(800) |
(900) |
Exceptional items |
(621) |
(665) |
(3,773) |
(4,200) |
(3,000) |
0 |
Profit before tax (reported) |
(127) |
1,214 |
(1,193) |
1,088 |
7,874 |
12,217 |
Taxation |
(35) |
(824) |
(1,000) |
(1,274) |
(2,231) |
(2,570) |
Adjusted diluted EPS (p) |
0.46 |
0.76 |
1.18 |
1.46 |
2.10 |
2.27 |
P/E - Adjusted EPS |
102.6 |
62.6 |
40.1 |
32.5 |
22.6 |
20.9 |
Source: Source: Learning Technologies Group (historicals), Edison Investment Research (forecasts).
Interest, tax and other costs: We forecast net interest expense to rise to £0.65m in FY17, and decline thereafter. We forecast £1.0m exceptional items relating to the integration of NetDimensions in FY17, all of which are cash. We forecast contingent acquisition costs of £3.2m in FY17 and £3.0m in FY18, which are treated as exceptional items and included in operating cash flow in the following years. We use a 12.5% tax rate in FY17 (normalised PBT), rising to 15% in FY18. We forecast share-based payments of £1.2m in FY17, falling to £0.8m in FY18. We forecast amortisation of acquired intangibles of £3.2m in FY17, before including NetDimensions, which we have ignored at this point, as this is a non-cash item.
Cash flow and balance sheet: We forecast free cash flow of £4.0m in FY17, rising to £9.6m in FY18 and to £10.0m in FY19. These numbers are after contingent acquisition payments, on our forecasts, of £2.2m in FY17, £3.2m in FY18 and £3.0m in FY19. We forecast net debt to reduce to £8.0m at the end of December 2017, after the acquisition of NetDimensions and the share placement. We forecast the group to move to zero net debt as at the end of FY18 and swing to £7.8m net cash a year later.
Reasons that operating margins should advance towards 30%
LTG is very focused on sustaining high utilisation rates and has proven that it can generate attractive operating margins. Indeed, margins achieved by LTG have been impressive for a services-based business (eg, Accenture, the professional services giant, has operating margins of c 17%). LTG has driven margins to 24.6% in FY16, though this was helped by the expansion of the group’s software offerings, Rustici (acquired in FY15) and gomo (developed in house). While NetDimensions will depress group margins in FY17, we forecast its margins to rise sharply as LTG’s management seeks to extract c $8m of cost savings from the business. The more conservative revenue recognition policy that LTG is taking in regard to NetDimensions’ services revenues will also help with the margin outlook. While NetDimensions has been loss making in recent years, following the accelerated investment plan of May 2013, it does have a highly cash-generative business model, with most customers paying annually in advance for the software. NetDimensions grew at a CAGR of 27.5% (including acquisitions) over the eleven years to FY15, though growth slowed dramatically in the last two years. If management can reignite revenue growth at NetDimensions, following the cost saving, that should boost margins further.
Exhibit 8: Impact of NetDimensions on margins
£000s |
2014 |
2015 |
2016 |
2017e |
2018e |
2019e |
LTG continuing |
||||||
Revenues |
14,920 |
19,905 |
28,263 |
35,700 |
39,189 |
39,071 |
Adjusted operating profit |
1,965 |
3,908 |
6,947 |
9,104 |
10,581 |
10,745 |
Operating margin |
13.2% |
19.6% |
24.6% |
25.5% |
27.0% |
27.5% |
NetDimensions |
|
|
|
|
|
|
Revenues |
|
|
|
13,846 |
18,462 |
19,938 |
Adjusted operating profit |
|
|
|
1,735 |
4,893 |
5,472 |
Operating margin |
|
|
|
12.5% |
26.5% |
27.4% |
Total group |
|
|
|
|
|
|
Revenues |
14,920 |
19,905 |
28,263 |
49,546 |
57,651 |
59,010 |
Adjusted operating profit |
1,965 |
3,908 |
6,947 |
10,838 |
15,474 |
16,217 |
Operating margin |
13.2% |
19.6% |
24.6% |
21.9% |
26.8% |
27.5% |
Source: Learning Technologies Group (historicals), Edison Investment Research (forecasts)
Sensitivities: Managing the growth
The industry is sensitive, relatively young, fragmented and highly competitive. There are challenges in managing an increasing global and diverse business and integrating acquisitions. There can be challenges for a fast-growing, technology-driven business in recruiting suitably experienced employees, and in the availability of freelancers when the company has a high level of projects.
We highlight the following sensitivities:
■
Economic backdrop: IT and HR budgets are subject to changes in economic cycles, although many of the group’s customers are required by regulation to offer training, which may provide some resilience.
■
Technological changes: The corporate e-learning market is characterised by an evolving technological backdrop and evolving industry standards, changes in customer needs, competition and frequent new product introductions. We note that rapid technological changes including the advent of the iPhone and tablet computing spurred the industry after the last downturn in 2008/09. The industry will also be supported by cost and productivity benefits. Rustici has developed a new standard in xAPI, which ultimately renders its traditional business in SCORM obsolete. NetDimensions competes with large US multi-tenant SaaS LMS competitors. However, its Secure SaaS technology gives it a competitive advantage in the compliance market and we note it is the fourth largest player in the proprietary LMS market.
■
Competitive environment: There are relatively low barriers to entry in the e-learning industry and the market is highly fragmented. There is a risk that the group’s software products could be bettered by its direct competitors. The LMS industry is competitive with c 500 LMS players globally and there is a potential threat from free open-source packages.
■
Project risk: There is the risk of fixed-price projects going over budget or deadlines not being met. LTG reviews its projects on a weekly basis and LTG concentrates assiduously on utilisation and delivering projects on budget. A few projects are more technically complex and have to be monitored. LTG says the group is very good at setting out exactly what it is delivering.
■
Key employees: The loss of a key employee could have a significant effect on the growth prospects of the company. There are relatively low barriers to entry, and there is always the risk that employees will leave to set up on their own.
■
Acquisition risk: There is implementation risk in the acquisition strategy.
Management: Highly experienced team
LTG has a very experienced management team who have worked in this area and related areas for many years and they have strong experience in acquiring and integrating businesses. This is evidenced by management’s biographies, which are outlined on page 17.
Directors and staff hold around 45% of the share capital.
Valuation: A unique position in the e-learning space
LTG has established a unique position as a pure-play mid-sized player in the e-learning space. It operates in a growth market and the industry is consolidating. While the rating looks punchy on an initial glance, LTG is a well-disciplined, highly profitable business with growing margins and healthy organic growth.
■
Traditional valuation measures: In traditional valuation terms, the stock trades on 32.5x our earnings forecasts in FY17, which falls to 22.6x in FY18 and to 20.9x in FY19.
■
Peer comparison: LTG has no direct quoted peers in the corporate e-learning content creation space. In Exhibit 9, we compare the stock with other project-based technology companies that also have related software offerings. We also compare it with the handful of human capital management software companies listed on AIM, as well as its larger human capital management software brethren in the US. There are other quoted companies that operate in corporate training/e-learning space, but are not comparable businesses such as large caps Pearson, RELX and Wolters Kluwer as well as some smaller caps including Wilmington (LSE:WIL), Tribal (LON:TRB) and Demos (EPA:ALDMO). The group’s punchy ratings reflect high and rising profit margins along with attractive organic growth rates.
Exhibit 9: Peer analysis
Share price |
Market cap |
EV/sales (x) |
EBITDA margins |
EV/EBITDA (x) |
P/E (x) |
||||||
m |
Year 1 |
Year 2 |
Year 1 |
Year 2 |
Year 1 |
Year 2 |
Year 1 |
Year 2 |
|||
Learning Technologies Group |
47.5 |
270 |
5.5 |
5.0 |
24.5% |
29.3% |
22.6 |
17.0 |
32.5 |
22.6 |
|
1) IT services businesses with significant own software offerings (local currency m's) |
|||||||||||
D4T4 (£) |
162.5 |
62.2 |
2.5 |
2.2 |
21.3% |
21.7% |
11.6 |
10.3 |
16.1 |
14.1 |
|
First Derivatives (£) |
2780 |
700.8 |
4.1 |
3.7 |
17.8% |
17.5% |
23.0 |
20.8 |
43.6 |
40.3 |
|
SCISYS (£) |
96.5 |
28.0 |
0.7 |
0.7 |
10.4% |
10.9% |
6.9 |
6.4 |
9.0 |
8.4 |
|
SNP Schneider (€) |
34.865 |
190.9 |
1.9 |
1.5 |
9.1% |
11.1% |
20.6 |
13.8 |
38.9 |
23.7 |
|
Medians |
2.2 |
1.9 |
14.1% |
14.3% |
16.1 |
12.0 |
27.5 |
18.9 |
|||
2) Human Capital Management software peers quoted on AIM (£'m) |
|||||||||||
Access Intelligence |
4.125 |
13 |
N/A |
N/A |
N/A |
N/A |
N/A |
N/A |
N/A |
N/A |
|
Dillistone Systems |
53 |
10 |
0.9 |
0.8 |
14.2% |
13.8% |
6.4 |
6.1 |
58.9 |
66.3 |
|
EG Solutions |
126.5 |
27 |
2.3 |
2.1 |
18.0% |
18.1% |
12.9 |
11.8 |
35.1 |
34.2 |
|
Tracsis |
420 |
118 |
3.1 |
2.9 |
24.1% |
24.6% |
12.9 |
12.0 |
18.9 |
18.1 |
|
Medians |
2.3 |
2.1 |
18.0% |
18.1% |
12.9 |
11.8 |
35.1 |
34.2 |
|||
3) North American Human Capital Management software peers ($'m) |
|||||||||||
Callidus Software |
25 |
1691 |
6.2 |
5.2 |
12.0% |
14.9% |
51.3 |
34.6 |
95.8 |
63.5 |
|
Cornerstone OnDemand |
35.86 |
2065 |
4.2 |
3.6 |
13.4% |
16.3% |
31.3 |
22.2 |
91.9 |
48.6 |
|
HealthStream |
23.71 |
756 |
2.6 |
2.4 |
14.7% |
15.9% |
17.5 |
14.9 |
104.4 |
88.8 |
|
Instructure |
30.15 |
886 |
5.6 |
4.3 |
(21.6%) |
(9.5%) |
N/A |
N/A |
N/A |
N/A |
|
Paycom Software |
74.77 |
4454 |
10.2 |
8.2 |
28.7% |
29.1% |
35.7 |
28.1 |
65.2 |
52.4 |
|
Paylocity |
48.49 |
2509 |
6.5 |
5.3 |
19.3% |
20.6% |
33.7 |
25.8 |
60.8 |
47.4 |
|
Ultimate Software |
199.81 |
5960 |
6.3 |
5.2 |
22.6% |
23.8% |
27.7 |
21.9 |
56.5 |
45.5 |
|
Workday |
108.84 |
22639 |
10.1 |
8.0 |
15.2% |
17.0% |
66.0 |
47.0 |
133.1 |
100.1 |
|
Medians |
6.2 |
5.2 |
15.0% |
16.7% |
33.7 |
25.8 |
91.9 |
52.4 |
|||
Source: Edison Investment Research (forecasts), Bloomberg (consensus data). Note: Prices as at 4 September 2017.
■
Free cash flow yield: LTG has reported positive cash flows since it was created in 2013. The working capital outflow in FY16 was due to two reasons: 1) bonus payments relating to the Rustici acquisitions; and 2) the large CSL contract, where costs have been prepaid but revenues not recognised – this will unwind over FY17 and FY18. Going forward, the business will benefit from NetDimensions’ cash-generative ‘payment in advance’ business model, along with growing high-margin recurring software revenue from gomo and Rustici, and we forecast the group to be strongly cash generative. On our forecasts, the group will generate free cash flow (after deferred consideration payments) of £4.0m in FY17, rising to £9.6m in FY18 and to £10.0m in FY19. These numbers translate to free cash flow yields of 1.5%, 3.5% and 3.7%, respectively. Ignoring deferred consideration payments, these FCF numbers would rise to c £6.2m, c £12.8m and c £12.0m.
Exhibit 10: Cash flow
£000s |
FY14 |
FY15 |
FY16 |
FY17e |
FY18e |
FY19e |
Adjusted operating profit |
1,965 |
3,908 |
6,947 |
10,838 |
15,474 |
16,217 |
Depreciation |
171 |
214 |
320 |
580 |
621 |
664 |
Amortisation of development costs |
89 |
216 |
405 |
700 |
800 |
899 |
Adjusted EBITDA |
2,225 |
4,338 |
7,672 |
12,118 |
16,895 |
17,780 |
Working capital |
(668) |
496 |
(4,578) |
(1,300) |
(0) |
(0) |
Exceptional items/misc |
(621) |
(99) |
(73) |
(3,200) |
(3,200) |
(3,000) |
Operating cash flow |
936 |
4,735 |
3,021 |
7,618 |
13,694 |
14,779 |
Net interest |
4 |
12 |
(274) |
(650) |
(600) |
(400) |
Tax paid |
(32) |
(483) |
(645) |
(800) |
(1,114) |
(2,082) |
Purchase tangible assets |
(123) |
(232) |
(422) |
(694) |
(692) |
(590) |
Software development |
(198) |
(310) |
(796) |
(1,474) |
(1,715) |
(1,756) |
Free cash flow |
587 |
3,722 |
884 |
4,000 |
9,573 |
9,951 |
Source: Learning Technologies Group (historicals), Edison Investment Research (forecasts)

■
Discounted cash flow scenarios: In Exhibit 11, we show our base case scenario (10% revenue growth), a WACC of 10% and operating margin of 30%, and the sensitivity of valuations to changes in WACCs, margins and growth assumptions around this. Starting from our base, the table shows that a 5% increase in the margin assumption increases the valuation by 18% from 49p to 58p, while a 2.5% rise in the growth assumption increases the valuation by 27% to 62p, and a 1% reduction in the WACC boosts the valuation by 18% to 58p. Additional upside to the valuation could come from value-accretive acquisitions, and developments at the Watershed associate, which we have included at cost.
Exhibit 11: DCF Scenario analysis (p/share)
|
|
WACC 9% |
WACC 10% |
WACC 11% |
|||||||
|
|
Long-term operating margin targets |
|||||||||
Revenue scenarios (see notes below) |
|
25.0% |
30.0% |
35.0% |
25.0% |
30.0% |
35.0% |
25.0% |
30.0% |
35.0% |
|
Out-performance 2 |
79p |
97p |
114p |
66p |
80p |
95p |
56p |
68p |
81p |
||
Out-performance 1 |
61p |
74p |
88p |
51p |
62p |
74p |
44p |
53p |
63p |
||
Base scenario |
47p |
58p |
68p |
40p |
49p |
58p |
34p |
42p |
50p |
||
Under-performance |
36p |
45p |
53p |
31p |
38p |
45p |
26p |
33p |
39p |
||
Revenue scenarios as follows: |
|
|
|
|
|
|
|
|
|
||
Out-performance 2: compound organic revenue growth of 15.0% over FY16-26 and growth fading thereafter to 2%. |
|||||||||||
Out-performance 1: compound organic revenue growth of 12.5% over FY16-26 and growth fading thereafter to 2%. |
|||||||||||
Base scenario: compound organic revenue growth of 10.0% over FY16-26 and growth fading thereafter to 2%. |
|||||||||||
Under-performance: compound organic revenue growth of 7.5% over FY16-26 and growth fading thereafter to 2%. |
|||||||||||
Source: Edison Investment Research. Note: WACC is weighted average cost of capital.
■
Sector M&A. Capita acquired e-learning company Brightwave, a direct competitor of LEO, in January 2016 for an undisclosed sum. City & Guilds acquired Kineo, another LEO competitor, in 2012 as part of its aim to create the world’s leading workplace learning company. City & Guilds has made additional e-learning acquisitions since then, including Kineo Pacific in 2013, Mindset in 2014 and e3Learning in 2016. In the US, StoneCalibre acquired e-learning company Trivantis in December 2016.
■
In NetDimensions’ space, there was a high level of M&A in the 2011-12 period, with SuccessFactors, Taleo and Kenexa acquired, by SAP, Oracle and IBM, respectively. Charterhouse acquired Skillsoft, a major US e-learning company, in 2014 for c $2bn and Skillsoft acquired software company SumTotal Systems later that same year. Canadian talent management company Halogen Software was acquired by SABA in February 2017 for c $293m. This follows the acquisition of SABA by Vector Capital in February 2016 for c $400m including debt.
■
On the AIM market, human capital management companies are becoming a rare breed, with Workplace Systems, Allocate Software, Bond International Software and ServicePower all taken over in recent years, along with NetDimensions.
Exhibit 12: Financial summary
£'000s |
2014 |
2015 |
2016 |
2017e |
2018e |
2019e |
|
Year end 31 December |
IFRS |
IFRS |
IFRS |
IFRS |
IFRS |
IFRS |
|
PROFIT & LOSS |
|||||||
Revenue |
|
14,920 |
19,905 |
28,263 |
49,546 |
57,651 |
59,010 |
EBITDA |
|
2,225 |
4,338 |
7,672 |
12,118 |
16,895 |
17,780 |
Adjusted Operating Profit |
|
1,965 |
3,908 |
6,947 |
10,838 |
15,474 |
16,217 |
Amortisation of acquired intangibles |
(570) |
(1,203) |
(3,200) |
(3,200) |
(3,200) |
(3,200) |
|
Exceptionals |
(621) |
(665) |
(3,773) |
(4,200) |
(3,000) |
0 |
|
Operating Profit |
774 |
2,040 |
(26) |
3,438 |
9,274 |
13,017 |
|
Associates |
(160) |
(62) |
(205) |
(500) |
0 |
500 |
|
Share based payments |
(583) |
(776) |
(605) |
(1,200) |
(800) |
(900) |
|
Net Interest |
(158) |
12 |
(357) |
(650) |
(600) |
(400) |
|
Profit Before Tax (norm) |
|
1,647 |
3,858 |
6,385 |
9,688 |
14,874 |
16,317 |
Profit Before Tax (Statutory) |
|
(127) |
1,214 |
(1,193) |
1,088 |
7,874 |
12,217 |
Tax |
(35) |
(258) |
(133) |
(1,274) |
(2,231) |
(2,570) |
|
Profit After Tax (norm) |
1,612 |
3,034 |
5,385 |
8,415 |
12,643 |
13,747 |
|
Profit After Tax (Statutory) |
(162) |
956 |
(1,326) |
(185) |
5,643 |
9,647 |
|
Average Number of Shares Outstanding (m) |
332.03 |
373.51 |
418.62 |
545.40 |
571.62 |
574.48 |
|
EPS - normalised (p) |
|
0.49 |
0.81 |
1.29 |
1.54 |
2.21 |
2.39 |
EPS - normalised & fully diluted (p) |
|
0.46 |
0.76 |
1.18 |
1.46 |
2.10 |
2.27 |
EPS - Statutory (p) |
|
(0.05) |
0.26 |
(0.32) |
(0.03) |
0.99 |
1.68 |
Dividend per share (p) |
0.10 |
0.15 |
0.21 |
0.28 |
0.38 |
0.52 |
|
EBITDA Margin (%) |
14.9 |
21.8 |
27.1 |
24.5 |
29.3 |
30.1 |
|
Op Margin (before GW and except.) (%) |
13.2 |
19.6 |
24.6 |
21.9 |
26.8 |
27.5 |
|
BALANCE SHEET |
|||||||
Fixed Assets |
|
12,337 |
19,502 |
45,558 |
89,571 |
87,358 |
84,941 |
Intangible assets and deferred tax |
11,982 |
18,959 |
41,667 |
85,367 |
83,082 |
80,739 |
|
Tangible Assets |
339 |
543 |
708 |
1,022 |
1,093 |
1,019 |
|
Investments & other |
16 |
0 |
3,183 |
3,183 |
3,183 |
3,183 |
|
Current Assets |
|
9,263 |
13,913 |
14,214 |
26,438 |
36,191 |
44,867 |
Stocks |
0 |
0 |
0 |
0 |
0 |
0 |
|
Debtors |
4,905 |
6,608 |
8,866 |
17,419 |
19,146 |
20,058 |
|
Cash |
4,358 |
7,305 |
5,348 |
9,018 |
17,046 |
24,809 |
|
Current Liabilities |
|
(5,184) |
(6,146) |
(13,058) |
(20,722) |
(22,605) |
(23,543) |
Creditors |
(5,184) |
(6,146) |
(9,806) |
(17,470) |
(19,353) |
(20,291) |
|
Short term borrowings |
0 |
0 |
(3,252) |
(3,252) |
(3,252) |
(3,252) |
|
Long Term Liabilities |
|
(2,007) |
(2,125) |
(16,004) |
(19,204) |
(19,204) |
(19,204) |
Long term borrowings |
0 |
0 |
(10,582) |
(13,782) |
(13,782) |
(13,782) |
|
Other long term liabilities |
(2,007) |
(2,125) |
(5,422) |
(5,422) |
(5,422) |
(5,422) |
|
Net Assets |
|
14,409 |
25,144 |
30,710 |
76,083 |
81,740 |
87,061 |
CASH FLOW |
|||||||
Operating Cash Flow |
|
936 |
4,735 |
3,021 |
7,618 |
13,694 |
14,779 |
Net Interest |
4 |
12 |
(274) |
(650) |
(600) |
(400) |
|
Tax |
(32) |
(483) |
(645) |
(800) |
(1,114) |
(2,082) |
|
Capex |
(321) |
(542) |
(1,218) |
(2,168) |
(2,407) |
(2,346) |
|
Acquisitions/disposals* |
(4,586) |
(7,779) |
(14,583) |
(46,826) |
0 |
0 |
|
Financing |
7,291 |
7,419 |
647 |
44,175 |
0 |
0 |
|
Dividends |
(107) |
(448) |
(712) |
(879) |
(1,546) |
(2,188) |
|
Net Cash Flow |
3,185 |
2,914 |
(13,764) |
470 |
8,027 |
7,764 |
|
Opening net debt/(cash) |
|
(1,170) |
(4,358) |
(7,305) |
8,486 |
8,016 |
(12) |
Other |
3 |
33 |
(2,027) |
() |
0 |
0 |
|
Closing net debt/(cash) |
|
(4,358) |
(7,305) |
8,486 |
8,016 |
(12) |
(7,775) |
Source: Learning Technologies Group (historicals), Edison Investment Research (forecasts). Note: *The outflow in FY17 represents the cost of acquiring NetDimensions less assumed net cash position on acquisition.
|
|||||||||||||||||||||||||||||||||||||||||||||
|
|
Marlborough Wine Estates Group (MWE), which was formed in March 2015, is targeting the development of premium New Zealand white wine brands in China and internationally. MWE came within 10% of all its key operating milestones (KOMs) for the year. However, it is now seeking to revise its KOM for international bottled wine sales revenue to include revenue from all international wine sales. It has set out its remaining FY18 KOMs, targeting growth in all three measures.