Last close As at 05/08/2026
—
— 0.00 (0.00%)
Market capitalisation
—
Research: Real Estate
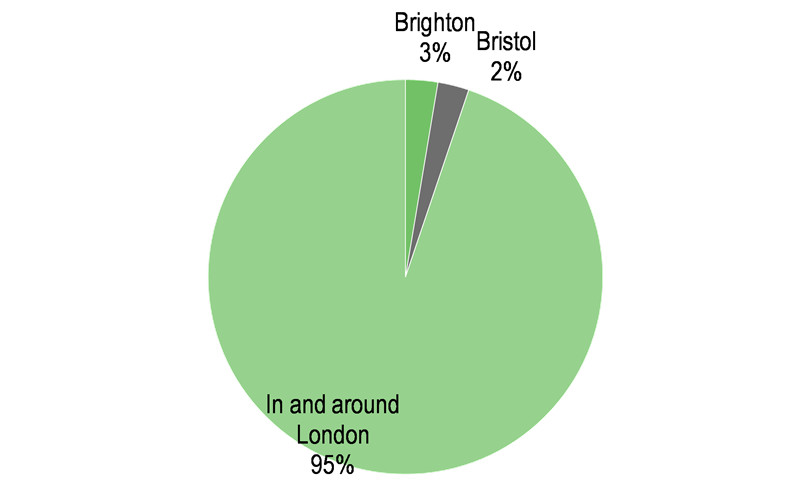
GCP Student Living (DIGS) REIT provides exposure to the specialist purpose-built student accommodation real estate sector, with a focus on London (95% of the investment portfolio value). The sector benefits from a positive demand-supply balance and good levels of rental growth, while being much less exposed to economic-led cycles than mainstream commercial real estate. With a growing student population and competing demands for space, the supply shortage in London is particularly acute. DIGS aims for regular sustainable dividends with RPI-inflation linked characteristics and modest capital appreciation. Shareholder returns since the IPO are well ahead of the 8–10% long-term target.
GCP Student Living |
Quality assets in and around London |
Real estate investment trusts |
31 May 2018 |
Initiation of coverage |
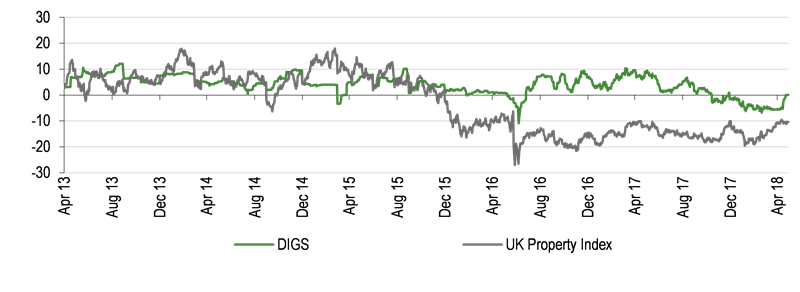
DIGS vs UK property index (3 years)
Gearing
Analysts
GCP Student Living is a research client of Edison Investment Research Limited |
|||||||||||||||||||||||||||||||||||||||||||||||||||||||||||||||||||||||||||||||||||||||||||||||||
GCP Student Living (DIGS) REIT provides exposure to the specialist purpose-built student accommodation real estate sector, with a focus on London (95% of the investment portfolio value). The sector benefits from a positive demand-supply balance and good levels of rental growth, while being much less exposed to economic-led cycles than mainstream commercial real estate. With a growing student population and competing demands for space, the supply shortage in London is particularly acute. DIGS aims for regular sustainable dividends with RPI-inflation linked characteristics and modest capital appreciation. Shareholder returns since the IPO are well ahead of the 8–10% long-term target.
Year end |
Rental income (£m) |
EPRA earnings* |
Diluted EPRA |
EPRA |
DPS** |
06/14 |
9.1 |
3.3 |
4.49 |
102.6 |
5.47 |
06/15 |
11.5 |
5.6 |
5.11 |
125.5 |
5.60 |
06/16 |
22.5 |
1.2 |
0.64 |
136.9 |
5.66 |
06/17 |
28.6 |
11.6 |
4.00 |
139.1 |
5.75 |
Note: *EPRA earnings are adjusted for property revaluation and gains/losses on disposal. FY16 affected by £7.6m of non-recurring refinancing costs. **06/14 DPD is pro-rata the 6.10p in dividends declared for the accounting period 20 May 2013 to June 2014 as published by DIGS.
High-quality portfolio in and around London
Growing numbers of international and post-graduate students are driving demand for purpose-built student accommodation (PBSA) in London while planning restrictions and competing demands limit supply. DIGS is achieving full occupancy and growing rents (4.1% this year) on its London-focused portfolio. Investor interest in London PBSA is strong and, with limited supply, prices have increased but, through its investment manager (Gravis) and asset manager (Scape Student Living), DIGS has built a c £760m portfolio of high-quality, purpose-built assets, 95% in and around London, with a pipeline of further opportunities in London and other locations with similar supply-demand characteristics.
Rental growth driving returns
EPRA NAV total return since the company listed in May 2013 (to 31 March 2018) was a compound 13.2% pa, exceeding the 8–10% long-term total shareholder return target. Dividends have continued to grow and should be fully covered by recurring earnings on a fully developed basis. Limited forward-funded developments/refurbishments provide access to high quality assets with attractive rental growth potential but limit immediate income. The investment manager indicates that the effect of completion and letting the two current projects that are under refurbishment and construction on reported earnings should be an annualised 2.8p per share.
Strong returns since IPO and positive outlook
At around NAV, the shares trade below the average c 4% premium since IPO. With continuing strong fundamentals in its chosen markets, above target returns and continuing DPS growth (covered on a fully operational basis), this may well represent an attractive entry point.
Exhibit 1: GCP Student Living at a glance
Investment objective and fund background |
Recent developments |
|||||||||||||||||||||||||||||||||||||||||||||||||||||||||||||||||||||||||||||||||||
GCP Student Living is a specialist UK real estate investment trust (REIT) investing in student residential assets, with a focus on London. The company seeks to provide shareholders with attractive total returns in the longer term, targeting 8–10% pa, through the payment of regular, sustainable, long-term dividends with the potential for modest capital appreciation. |
■ 30 April 2018: NAV and dividend announcement. ■ 22 March 2018 Interim results to 31 December 2017 – EPRA NAV 146.3p from 139.1p at year end, NAV total return +10.1% vs +10.7% benchmark return; 2.96p div +3.4%. ■ 23 February 2018: Gillian Day appointed non-executive director. ■ 11 December 2017: Acquisition of Podium at Royal Holloway London University for £29m. |
|||||||||||||||||||||||||||||||||||||||||||||||||||||||||||||||||||||||||||||||||||
Forthcoming |
Capital structure |
Fund details |
||||||||||||||||||||||||||||||||||||||||||||||||||||||||||||||||||||||||||||||||||
AGM |
November 2018 |
Ongoing charges |
1.3% (excluding direct property costs) |
Group |
Gravis Capital Management |
|||||||||||||||||||||||||||||||||||||||||||||||||||||||||||||||||||||||||||||||
Final results |
September 2018 |
Loan to value |
25% (March 2018) |
Manager |
Tom Ward and Nick Barker |
|||||||||||||||||||||||||||||||||||||||||||||||||||||||||||||||||||||||||||||||
Year end |
June |
Annual mgmt fee |
1.0% of NAV |
Address |
24 Savile Row, London W1S 2ES |
|||||||||||||||||||||||||||||||||||||||||||||||||||||||||||||||||||||||||||||||
Dividend paid |
Mar, Jun, Sep, Dec |
Performance fee |
None |
|||||||||||||||||||||||||||||||||||||||||||||||||||||||||||||||||||||||||||||||||
Launch date |
May 2013 |
Trust life |
Indefinite |
Phone |
020 3405 8500 |
|||||||||||||||||||||||||||||||||||||||||||||||||||||||||||||||||||||||||||||||
Continuation vote |
November 2018 |
Loan facilities |
£235m (fully drawn) |
Website |
www.graviscapital.com |
|||||||||||||||||||||||||||||||||||||||||||||||||||||||||||||||||||||||||||||||
Dividend policy and history |
EPRA NAV per share and EPRA NAV total return history |
|||||||||||||||||||||||||||||||||||||||||||||||||||||||||||||||||||||||||||||||||||
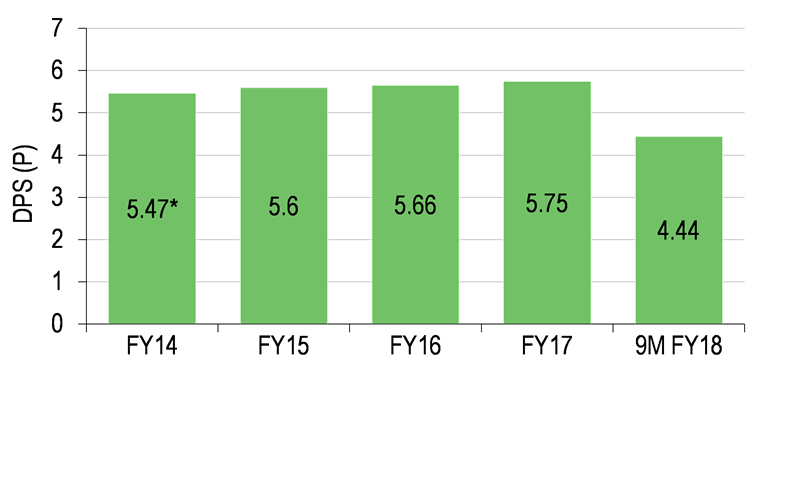
DIGS pays dividends quarterly. A key objective is to provide regular, sustainable, long-term dividends. FY14 pro-ratas the 6.10p in dividends declared for the accounting period 20 May 2013 to June 2014, as published by DIGS. |
The company is targeting an 8–10% pa total return over the longer term. EPRA NAV TR has been a compound 13.2% pa since IPO (calculated with dividends reinvested). |
|||||||||||||||||||||||||||||||||||||||||||||||||||||||||||||||||||||||||||||||||||
|
|
|||||||||||||||||||||||||||||||||||||||||||||||||||||||||||||||||||||||||||||||||||
Major shareholders (as at 11 May 2018). Source: Thomson Reuter |
Geographic exposure by property value (as at 31 December 2017) |
|||||||||||||||||||||||||||||||||||||||||||||||||||||||||||||||||||||||||||||||||||
|
|
|||||||||||||||||||||||||||||||||||||||||||||||||||||||||||||||||||||||||||||||||||
Portfolio summary (as at 31 March 2018) |
||||||||||||||||||||||||||||||||||||||||||||||||||||||||||||||||||||||||||||||||||||
|
||||||||||||||||||||||||||||||||||||||||||||||||||||||||||||||||||||||||||||||||||||
London-focused student accommodation
GCP Student Living (DIGS) was the first real estate investment trust (REIT) in the UK to focus on the specialist property asset class of student residential property. It was admitted to trading on the London Stock Exchange in May 2013, initially trading on the Specialist Fund segment of the Main Market, and transferring to the Premium segment in September 2016. The investment objective is to provide shareholders with attractive total returns in the longer term through the potential for modest capital appreciation and regular sustainable dividends with RPI-inflation linked characteristics. The external investment manager is Gravis, and the primary asset manager is Scape Student Living. We provide more information below.
|
Exhibit 2: Portfolio value and revenues since IPO |
Exhibit 3: Number of assets and beds since IPO |
|
|
|
Source: Company data. Note: *Revenue shows H118 annualised. |
Source: Company data |
|
Exhibit 2: Portfolio value and revenues since IPO |
|
|
Source: Company data. Note: *Revenue shows H118 annualised. |
|
Exhibit 3: Number of assets and beds since IPO |
|
|
Source: Company data |
The student housing sector has attracted investor interest for its favourable risk-adjusted yields, which benefit from a positive supply-demand situation, good levels of rental growth and less exposure to the economic-led cycles that affect traditional commercial property sectors such as offices, industrial and retail property. DIGS focuses on properties that are located primarily in or around London, where growing student numbers significantly outstrip student accommodation supply. This is a key strategic differentiating factor from other listed investment vehicles, such as Empiric Student Property (another REIT launched in 2014), and Unite Group, which is both a developer and investor across the UK that converted to REIT status on 1 January 2017. In London, a shortage of suitable accommodation, tight constraints on new supply and growing demand, particularly from overseas students, is a supportive back-drop to occupancy and rent levels, providing visibility over income but is a challenging environment in which to grow assets.
DIGS came to market with an investment pipeline agreement in place, providing it with the opportunity to source assets through future contractual arrangements with Scape Student Living and its owners. This arrangement has provided DIGS with access to high-quality, purpose-built assets in good locations, while avoiding development risk, and has allowed it to manage cash drag while building the portfolio. DIGS benefits from a similar arrangement in respect of the future acquisition of Scape Canalside, a high-specification, purpose-built, private student accommodation residence located immediately adjacent to Queen Mary, University of London. Scape Canalside is expected to be completed and then acquired by DIGS in time for the 2019/20 academic year, providing approximately 410 beds. The property is in the same locality as the group’s existing c 590-bed Scape East asset. Accordingly, should DIGS acquire this asset, its portfolio would include c 1,000 beds within walking distance of Queen Mary, University of London, providing the opportunity for it to benefit from further enhanced operational economies of scale.
As at 31 March 2018 (9M18), the portfolio comprised the 10 modern and high quality assets listed on page 2 (six acquired through Scape and operated under the Scape Student Living brand), with an aggregate valuation of £759m at an average net initial yield of 5.01%. By value, 95% of the portfolio is situated in and around London (see page 2), while looked at by numbers of beds, the in and around London share is 83%. The operational portfolio has been fully occupied since IPO and is again fully occupied for the 2017/18 academic year, let to students from more than 70 different higher education institutions (HEIs).
The portfolio value and rental income will increase further as development of the company’s second forward-funding agreement (Circus Street Brighton), and refurbishment of a key central London asset (Scape Bloomsbury) complete over the next 12–18 months. The investment manager has identified student accommodation markets in Bath, Bristol, Brighton, Oxford and Cambridge as having favourable supply/demand dynamics, which it believes are akin to those in London. However, with no specific balance sheet targets in terms of gross assets, and given the tightening of investment yields, DIGS says it will only invest where it, and the investment manager, believe these are supportive of long-term returns to shareholders through expected rental growth.
Company board
DIGS has a fully independent board that is responsible for the effective stewardship of the company’s affairs, including corporate strategy, corporate governance, risk assessment and overall investment policy. Robert Peto was appointed non-executive chairman prior to the DIGS IPO in 2013. He is also non-executive chairman of Standard Life Property Income Trust and DTZ Investment Management, and was formerly global president of RICS and a member of the Bank of England Property Advisory Group. The other four independent non-executive directors and their dates of appointment are Malcolm Naish (2013 IPO), Marlene Wood (March 2015), Peter Dunscombe (2013 IPO) and Gillian Day (February 2018).
DIGS has an unlimited life but at the fifth AGM of the company, which will be in November 2018, and every three years thereafter, the company’s articles require that a continuation vote be put to shareholders. Should the continuation vote not be passed, the directors are required to put forward proposals for reconstruction, reorganisation, or winding up. Given DIGS’s outperformance of the return targets set at IPO, and the continuing strong fundamentals of the markets in which it operates, shareholder support of the continuation vote would seem likely.
Investment manager – Gravis
DIGS has appointed Gravis to provide day-to-day investment management services. Gravis, which was established in 2008, is privately owned by its directors and founding members, and currently manages £2.3 billion in assets including two other listed closed-end vehicles: GCP Infra (market cap c £1bn), invested in long-term UK infrastructure projects; and GCP Asset Backed (market cap c £330m), investing in asset-backed lending.
Tom Ward and Nick Barker have day-to-day responsibility for the provision of investment advice to DIGS. Nick Barker is a qualified surveyor who joined Gravis in 2015 after eight years with Schroder Real Estate Management where he was head of alternatives for the real estate business and a member of the fund management team. Tom Ward qualified as a chartered accountant with Arthur Anderson and continued to work in practice with the Deloitte corporate finance division, focusing on asset-backed securitisation before joining DTZ to focus on funding and structuring property transactions on residential and student accommodation. Tom Ward is one of the founding members of Gravis and is also chief operating operator of Scape Student Living, the principal asset manager.
The current investment management agreement runs for six years from 25 September 2015. Fees are accrued daily and paid quarterly in arrears at 1% of NAV.
Asset and facilities management – predominantly Scape
Scape Student Living is the principal asset and facilities manager for DIGS and is closely aligned with Gravis, the directors of which own 50% of Scape. In addition to the asset management services provided by Scape, as noted above, the relationship with Scape provides DIGS with access to assets that may not otherwise be available to it, as well as a wider network of industry contact and investment opportunities. As a developer and manager, Scape has extensive expertise in the construction, design and operation of student accommodation. For its services, Scape receives 0.25% of NAV pa, which is paid by the investment manager out of its fee entitlement. Scape manages the facilities and the actual asset management costs (such as on-site staff, utilities, etc) are paid directly by DIGS, a structure that is both operationally and tax-efficient, avoiding additional non-deductible VAT expenses that may otherwise arise.
Capital and funding
As a REIT distributing substantially all of its income, asset growth is dependent upon additional periodic equity and debt funding. DIGS raised £70.1m at the time of its IPO with the proceeds used to fund the acquisition of the initial asset, Scape East. The company has since raised more than £400m in a series of equity placings and a C share issue to fund the growth of the portfolio. The most recent issue, in July 2017, raised £70m by way of a non-pre-emptive placing at 142p per share for the purpose of funding Circus Street, Brighton and Podium.
|
Exhibit 4: Equity funding and LTV |
|
|
Source: Company data |
Gearing, defined as borrowings as a percentage of gross assets, is limited to 55% at the time of investment, although it is DIGS’s current intention to target a level of not more than 30% over the long term. Debt facilities of £235m, all fixed rate, were fully drawn at 31 March 2018 (9M18) with gearing at 29%. DIGS also publishes loan-to-value (LTV), defined as debt net of cash as a percentage of the value of investment properties, a measure more commonly used by real estate investors. At 31 March 2018, this was 25%, implying a cash balance of c £45m.
The strategic drivers of performance
The key fundamental drivers of how the investment manager seeks to add value by maintaining high rates of occupancy, growing rental income and increasing asset valuations are summarised below, and we explore this in more detail in the sections that follow.
■
Where the assets are located. As discussed above, the primary focus remains on assets in and around London (95% by value), but within this, the manager looks for proximity to a suitable HEI and/or a major transport hub. Transport is important, as many of the assets will typically attract students from a wide range of HEIs and the appeal of studying in London includes access to the amenities and attractions that it offers. Assets with similar market characteristics to London are considered, particularly good levels of demand and high supply-side barriers. In central Brighton, for example, where DIGS has acquired a 450-bed property (with 30,000 sq ft of commercial space) on a forward funding basis, the market is characterised by significant supply constraints and a large international student population.
■
What the company buys. The company continues to target modern, purpose built accommodation, attractive to students today and offering longevity of income potential. Appropriate existing property, such as Scape Bloomsbury on Tavistock Square in central London, is also acquired where it can be refurbished to a similar standard. DIGS prefers larger-scale assets that can provide operational efficiencies in addition to those that are available through geographical clustering of the assets.
■
How the company operates. High specification facilities and “hotel levels” of service are at the core of the operational strategy. Affordable accommodation with modern design is the brand proposition of Scape. Each of the properties offers ample common space for students to socialise and study, high-speed internet and Wi-Fi are available throughout. Many offer additional private rooms for group study, recreational areas and a gym. In an under-supplied market, DIGS targets what it considers competitive pricing, adjusting rents in a predictable way that it believes will better serve long-term occupancy and revenue growth. What the investment manager refers to as ‘intelligent design’ also benefits long-term returns by optimising the appeal of the accommodation in relation to available floor space.
London focus generates higher occupancy and rents
Supported by the tight demand-supply position in London, where its assets are focused, DIGS has been able to maintain full occupancy on its operational assets. Common industry lease terms are a mix of direct lets, either directly to students or HEIs, or hard or soft nomination agreements. Direct lets are agreed annually, but have seen rental growth above RPI over the past 15 years or so. Hard nomination agreements are effectively a multi-year let, of variable length, whereby the HEI contracts to nominate its students to stay in the private accommodation. The management of the property is usually retained by the operator but occupancy risk transfers to the HEI. Rent levels are often lower as a result, but typically include an RPI uplift. Soft nomination agreements are effectively marketing agreements with an HEI for the latter to place their students with the operator. Another feature of the London market, and DIGS’s market position within that market, is that its rents are predominantly generated by direct lets to students (87% of student rental income and 78% of all gross revenue in FY17). The share of contractually RPI-linked rents will increase as Circus Street, Brighton comes on-stream for the 2019/20 academic year. It is let on a 21-year lease with upward-only rent adjustments linked to RPI plus 50bp (capped at 5% with a floor at 2%). Reflecting a higher share of overseas and post-graduate students, direct let agreements with students tend to be longer in London, c typically 51 weeks, rather than simply following the typical academic year with lets sometimes as short as 30 weeks. Overseas students represent 74% of DIGS tenants. Out-of-term, short lets are also possible in London, given the volume of visitors and the quality of the DIGS accommodation.
Not surprisingly, London rents are higher than rents outside of London and have been growing at a faster rate. Cushman & Wakefield estimates that across all room types London rents are on average 60% higher than those outside of the capital. For the 2017/18 academic year, DIGS achieved average rental growth across its operational portfolio of 4.1%, compared with the previous academic year, maintaining the trend of faster rental growth than the national average and above RPI.
|
Exhibit 5: GCP rent growth ahead of market & RPI |
Exhibit 6: Rent growth/RPI index (2012=100) |
|
|
|
Source: DIGS |
Source: DIGS |
|
Exhibit 5: GCP rent growth ahead of market & RPI |
|
|
Source: DIGS |
|
Exhibit 6: Rent growth/RPI index (2012=100) |
|
|
Source: DIGS |
London costs are higher too, but clustering supports efficiency
The direct cost of operating properties in and around London is also higher than elsewhere, but the difference is smaller than that seen in rents, with gross margins generally higher. Higher gross margins and the potential for continued rent growth are reflected in higher capital values and lower valuation yields.
DIGS generates a net operating/gross margin in the region of 80% and after the costs of running the fund, an operating margin (before valuation movements) of 55-60%. It is difficult to make direct comparisons across the quoted peers as cost ratios are affected by a variety of factors including regional mix, asset mix, tenancy structure, scale and operational efficiency. With that caveat, the DIGS margins, at both a net operating and operating profit level are above those reported by Empiric and Unite and this is likely to be driven by a combination of:
■
The focus on London and near-London
■
The focus on high specification/high value assets
■
An efficient internal operating structure supported by the benefits of geographic clustering
Exhibit 7: Sector margins
GCP |
Empiric |
Unite |
||||
£m |
2016 |
2017 |
2016 |
2017 |
2016 |
2017 |
Revenue |
22.5 |
28.6 |
31.4 |
51.2 |
120.7 |
119.3 |
Net operating profit |
17.9 |
22.5 |
19.8 |
29.0 |
75.8 |
78.2 |
Net operating margin (%) |
79.5% |
78.7% |
63.1% |
56.6% |
62.8% |
65.5% |
Operating profit |
12.2 |
16.5 |
10.4 |
15.5 |
50.8 |
51.3 |
Operating margin (%) |
54.1% |
57.5% |
33.1% |
30.3% |
42.1% |
43.0% |
Source: Company data, Edison Investment Research
Tightening yields as a result of continued strong investor interest in the student accommodation asset class has pushed up the price of assets in recent years, reducing the immediate yield available on new investment. This is particularly the case in central London where scarcity value and rental growth prospects are reflected in net initial yields of 4.25–5.25%. In such an environment, investment discipline and selectivity is called for if longer-term return targets are to be met.
Exhibit 8: Indicative yields
2017 |
2016 |
|
Prime London (Zones 1 and 2) |
4.25%/4.75% |
4.50%/5.00% |
Prime London (Zones 3 and 4) |
5.00%/5.25% |
5.00%/5.50% |
Super prime regions |
5.00%/5.25% |
5.25%/5.75% |
Prime regions |
5.75%/6.25% |
5.75%/6.25% |
Secondary |
6.50%/7.50% |
7.25%/8.00% |
Tertiary |
8.00%/10.00% |
8.00%/10.00% |
Source: Cushman & Wakefield UK Accommodation Report 2017/18
Forward funding provides a useful way to lock-in attractive assets
Forward funding agreements are a useful tool for securing desirable assets in locations where appropriate operational assets may otherwise be unavailable. While DIGS’s investment policy specifically excludes riskier development activity, it may commit up to 35% of gross assets to forward funding projects, with a limit of 20% of gross assets applied to land and 15% of gross assets applied to construction cost commitments. Forward funding allows DIGS to agree the purchase of an asset, at an agreed price, in return for providing funding to the developer during the construction phase. It has the added benefits of providing DIGS with greater control over the building design and specification, and enables it to secure assets where appropriate operational assets may not be available. Although development cost escalation risk stays with the developer, and license fees are earned on the funding extended, it is impossible to be fully protected against late delivery or contractor failure. However, we consider these risks to be relatively low, and if the location is well chosen, the operational risks (occupancy and rent levels) on completion and delivery should also be well managed. In 2016 DIGS entered into a forward funding agreement to acquire Scape Wembley, locking in at a book cost of £80m. It completed on schedule in September 2017 in time for the 2017/18 academic year and was valued at 31 December 2017 at £89.3m. Construction of a second forward funded development asset, Circus Street, Brighton, has commenced and is expected to complete ahead of the 2019/20 academic year. At 31 March 2018, DIGS had invested £24.5m in the project, out of a total expected cost of c £70m.
Dividend policy
Dividends are paid quarterly and DIGS seeks to pay regular sustainable long-term dividends with RPI inflation-linked characteristics. The company met its initial dividend target of a 5.5% yield on the issue price and has increased dividends per share each year since IPO. The first reporting period ran from 20 May 2013 to 30 June 2014, with the company declaring dividends of 6.1p during the period, or an annualised 5.47p (as shown on page 2), and annual dividends declared have grown at a compound 1.7% pa subsequently, with 5.75p declared in respect of FY17. The 2.96p declared in respect of H118 annualises at 5.92p, which would represent year-on-year growth of 3.0%.
One of the criteria for selecting assets is that there must be sufficient inflation linkage potential to enable the investment manager to structure direct let agreements and/or hard or soft nominations agreements in a way that provides acceptable inflation protection, and supports the aim of RPI inflation-linked dividend characteristics. This is not contractually locked in by annual direct let agreements, but is supported by historical rent growth and the continuing supply-demand imbalance in the markets in which DIGS operates, primarily in and around London.
When forward funding a development (such as Circus Street currently), or refurbishing an asset (Scape Bloomsbury), which the company believes is the best way to generate long-term returns, the immediate returns from those assets is reduced, and so too is dividend cover. Although EPRA earnings grew by 43% in H118, as a result of share issuance to fund portfolio growth, EPRA EPS, at 1.69p, was below the dividend declared of 2.96p. The investment manager calculates that dividends would be fully covered on the basis that the funds raised are deployed and the development/refurbishment is complete, with the assets becoming operational. To illustrate the point, the investment manager estimates that Scape Bloomsbury and Circus Street would add an annualised 2.8p to EPS once operational, while providing further potential for long-term rental growth.
London stands out in the student accommodation market
With demand for higher education remaining strong, the demand for student accommodation across the UK continues to outstrip supply. HEIs have been unable to meet the growing demand themselves, with the private sector continuing to provide the needed growth of modern purpose built student accommodation. Cushman & Wakefield estimates that the number of new, purpose built beds increased by 30,000 for the 2017/18 academic year, taking the total to 602,000 beds. It observes that while demand outstrips supply at a national level, there are pockets of oversupply where new developers are experiencing occupancy issues, particularly for studios, 43% of the 2017/18 growth. For London and a number of other core markets with similar demand-supply characteristics, the position of under-supply remains clear. For London in particular, increasing global demand for the world class educational facilities that it offers, combined with a significant under-supply), and substantial obstacles to new development, represent an attractive environment for investors.
The differentiating features of the London market can be summarised as:
■
London is home to more than 300,000 full-time students, more than any other city in the UK
■
Four of the top 50 universities in the world are in London as are five of the 24 Russell Group universities, widely perceived as representing some of the best universities in the country.
■
As a result of the high standard of education available, and the wider appeal of London as a place in which to live, a quarter of all international students studying in the UK are based there.
■
London universities are only able to supply accommodation to c 30% of their first year and international students.
Demand growth should continue
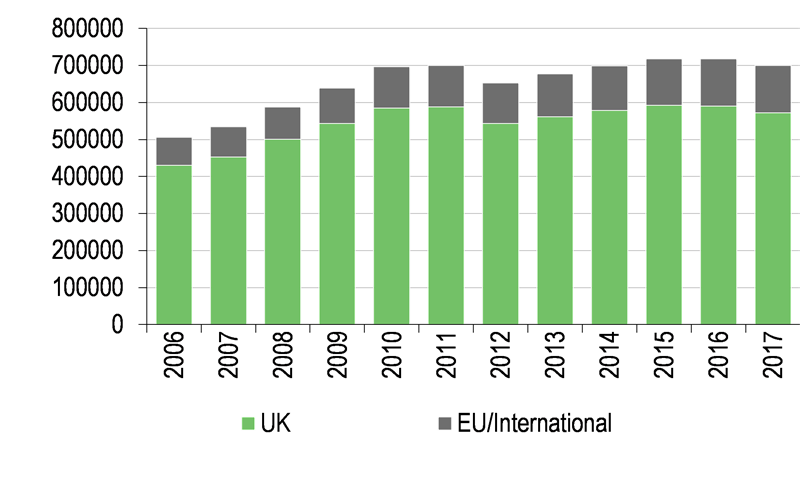
The dip in student applicants and acceptances in response to the introduction of £9,000 pa tuition fees in 2012/13 was short-lived. Student numbers have grown at a compound 2.9% from 2006 to 2017. For 2017/18, a slight drop (0.5%) in acceptances for UK domiciled students, and a 2.0% drop for other-EU domiciled students, was off-set by 5.0% growth in internationally (non-EU) domiciled students. Applications exceed acceptances by c 30%. March 2018 data from the Universities and Colleges Acceptance Service (UCAS) in respect of the upcoming 2018/19 academic year show other-EU applicants up by 2% on 2017/18 and international applicants up by 8%, but with UK applicants down 3% and overall applicants 2% lower.
|
Exhibit 9: Student applications and acceptances |
Exhibit 10: Student acceptances by domicile |
|
|
|
Source: UCAS |
Source: UCAS |
|
Exhibit 9: Student applications and acceptances |
|
|
Source: UCAS |
|
Exhibit 10: Student acceptances by domicile |
|
|
Source: UCAS |
UK-domiciled students represent the largest share of acceptances (87% in 2017), despite growing numbers of overseas students, and have grown at a 2.9% compound rate over the period despite a short-term demographic headwind that has seen the number of UK 18-year-olds steadily declining year-on-year. This demographic headwind should reverse in coming years, with the young population increasing by more than 20% over the next 10 years. With student numbers increasing, and the young population declining, participation rates have been trending upwards. The Higher Education Policy Institute (HEPI) estimates that with an unchanged participation rate, the demand for higher education places could increase by c 50,000 by 2030. Should participation continue to increase towards the higher rates seen in some other western countries, HEPI suggests the increase in demand could be up to 350,000 places.
|
Exhibit 11: Trend in population of UK 18 year olds |
Exhibit 12: UK higher education participation rates |
|
|
|
Source: ONS, Summary of key birth statistics, 1938-2016 |
Source: Department of Education |
|
Exhibit 11: Trend in population of UK 18 year olds |
|
|
Source: ONS, Summary of key birth statistics, 1938-2016 |
|
Exhibit 12: UK higher education participation rates |
|
|
Source: Department of Education |
Some Brexit uncertainty but unlikely to have a significant effect
Non-UK acceptances were 13% of the total in 2017, 5.7% from other-EU and 7.3% non-EU international students. There is no sign as yet that the UK EU referendum effect is having a negative impact, with other-EU acceptances remaining above their level prior to the referendum, but the full effect may not yet be apparent. The government has confirmed that other-EU students entering in the 2018/19 academic year are guaranteed the same fee rates as UK students, as well as access to student finance for the duration of the course. Longer term, international students are currently included within the government’s net migration figures, which may in future include other-EU students, and which the government has pledged to reduce. The sector is hopeful that a solution will be found that recognises the significant contribution that overseas students make to the UK economy. Universities UK, a representative organisation for UK universities, in 2017, assessed the net annual benefit of international students to the UK at £25.8bn and the Migration Advisory Committee is due to report on the issue in September.
Excluding unpredictable Brexit effects, the long-term outlook for the UK as a provider of educational services looks secure. Based on the increased mobility, the OECD estimates that globally the number of international students will increase from a current five to eight million by 2025 and London, with almost 100,000 student visitors, is one of their most popular destinations.
Remains a structurally under-supplied market, especially London
On university campuses, purpose-built student accommodation is still the exception rather than the rule with only c 600,000 beds available to a student population in excess of 1.8m. The universities themselves provide the largest share of this bed space (57% according to Cushman & Wakefield) with the private sector providing the remaining 43%. Given funding constraints for the HEIs, new supply of PBSA is dominated by the private sector. Most universities offer an accommodation guarantee to first year students and international students and with increasing numbers of UK students studying away from home, and increasing numbers of overseas students, demand continues to outstrip supply at a national level despite significant development activity in recent years. Under-supply is clear in some regions, such as London, but is patchy across the country, with significant development activity in certain locations leading to pressures on occupancy.
Cushman & Wakefield estimates that the national development pipeline remains at 150,000 new bed spaces, of which only 15,000 are in London, where planning constraints and pressures from alternative use of the land are strong. JLL estimates that London has c 89,000 PBSA beds, of which c 58% are provided by the private sector, a larger proportion than the national average. GCP, though a relatively small provider in a fragmented national market, will have an approximate 5% share of London beds including the Scape Bloomsbury refurbishment.
London has more than 300,000 full time students, including a high share of international and post-graduate students, and is home to four of the world’s top 50 universities (University College, Imperial College, Kings College and London School of Economics). Even though the number of beds has more than doubled over a 10 year period, this has been matched by the growth in student numbers, leaving the market significantly undersupplied.
Interim results showed continued growth
DIGS reports its results on an IFRS basis but provides supplementary disclosure on both an EPRA basis and including company specific adjustments. Both of the latter exclude property revaluation movements and disposal results.
The group-adjusted earnings also take into account the benefit of licence fees that are receivable on forward funded developments and other non-recurring items. Forward funding licence fees are payable on the amounts advanced during the construction phase, but roll up until completion. They are then offset against the purchase value and recognised within the post completion revaluation, never normally being captured within EPRA earnings, and hence the adjustment. Circus Street, Brighton benefits from a licensing fee that provides a 5.5% coupon on drawn funds though the construction phase. By recognising forward funding licence fees, adjusted earnings provide a better indication of the earnings potential on a fully developed basis, but not a complete picture; there is no adjustment for the potential income from the Scape Bloomsbury refurbishment, for example.
In Exhibit 13, we show the reported historical financials on a group-adjusted basis as described above, followed by reconciliation to group-adjusted and IFRS.
Exhibit 13: Summary of key financials
Year ending 30 June (£000s) |
2014 |
2015 |
2016 |
2017 |
H117 |
H118 |
H118/H117 |
|
Rental income |
9,132 |
11,505 |
22,482 |
28,611 |
13,035 |
17,317 |
32.9% |
|
Property operating expenses |
(1,664) |
(2,529) |
(4,600) |
(6,086) |
(2,742) |
(3,860) |
40.8% |
|
Gross profit |
7,468 |
8,976 |
17,882 |
22,525 |
10,293 |
13,457 |
30.7% |
|
Net operating margin/gross margin |
81.8% |
78.0% |
79.5% |
78.7% |
79.0% |
77.7% |
||
Administrative expenses |
(2,357) |
(2,001) |
(5,712) |
(6,072) |
(3,576) |
(3,614) |
1.1% |
|
Operating profit before gains on investment properties |
5,111 |
6,975 |
12,170 |
16,453 |
6,717 |
9,843 |
46.5% |
|
Operating margin |
56.0% |
60.6% |
54.1% |
57.5% |
51.5% |
56.8% |
||
Fair value gains on investment properties |
5,010 |
25,660 |
27,156 |
11,855 |
6,306 |
32,357 |
||
Operating profit |
10,121 |
32,635 |
39,326 |
28,308 |
13,023 |
42,200 |
||
Net finance expense |
(2,412) |
(1,336) |
(11,001) |
(4,794) |
(2,137) |
(3,354) |
56.9% |
|
PBT |
7,709 |
31,299 |
28,325 |
23,514 |
10,886 |
38,846 |
256.8% |
|
Tax charge |
0 |
(18) |
3 |
(40) |
(41) |
0 |
||
IFRS net earnings |
7,709 |
31,281 |
28,328 |
23,474 |
10,845 |
38,846 |
258.2% |
|
Fair value gains/(losses) on investment property |
(5,010) |
(25,660) |
(27,156) |
(11,855) |
(6,306) |
(32,357) |
||
Fair value movement on financial derivative & close out fees |
599 |
0 |
0 |
0 |
0 |
0 |
||
EPRA earnings |
3,298 |
5,621 |
1,172 |
11,619 |
4,539 |
6,489 |
43.0% |
|
Exceptional finance costs |
0 |
0 |
7,635 |
0 |
0 |
0 |
||
Other exceptional items |
0 |
0 |
884 |
394 |
867 |
0 |
||
License fees on forward funded developments |
0 |
0 |
0 |
1,421 |
0 |
876 |
||
Capitalised rental guarantee |
0 |
0 |
0 |
189 |
0 |
0 |
||
Group adjusted earnings |
3,298 |
5,621 |
9,691 |
13,623 |
5,406 |
7,365 |
36.2% |
|
Weighted average number of shares (m) |
73.4 |
109.9 |
183.0 |
290.5 |
263.3 |
383.5 |
45.6% |
|
IFRS EPS (p) |
10.50 |
28.46 |
15.48 |
8.08 |
4.12 |
10.13 |
145.9% |
|
Diluted EPRA EPS (p) |
4.49 |
5.11 |
0.64 |
4.00 |
1.72 |
1.69 |
-1.8% |
|
Group adjusted EPS (p) |
4.49 |
5.11 |
5.30 |
4.69 |
2.05 |
1.92 |
-6.5% |
|
DPS (p) |
6.10 |
5.60 |
5.66 |
5.75 |
2.86 |
2.96 |
3.5% |
|
EPRA NAV per share (p) |
102.6 |
125.5 |
136.9 |
139.1 |
138.2 |
146.3 |
5.9% |
|
LTV |
26.7% |
22.6% |
26.6% |
32.0% |
35.0% |
28.0% |
Source: Company data, Edison Investment Research
The last reported results cover the six month period to 31 December 2017, the first half of the FY18 financial year (H118). Rental income continued to grow, as it has done throughout the period since IPO, reaching £17.3m, up by one third on the prior year period. Including Scape Wembley and the Podium, there were 2,679 beds fully let for the 2017/18 academic year compared with 1,923 beds, fully let the year before, while rent increases average 4.1%, ahead of the national average (DIGS cites data from Cushman & Wakefield indicating a 2.9% national increase).
The net operating margin was consistent with previous periods and the operating margin after administrative costs (the costs of running the fund, including investment manager costs) was slightly lower during the period, but would be higher if licence fees are included.
The increase in finance costs reflects additional drawings against the expanded loan facilities, which increased from £130m at 31 December 2016 to £235m, fully drawn as at 31 December 2017. There are two debt facilities, both fixed rate, at a blended 2.96%.
IFRS earnings benefitted from portfolio valuation gains of £32.4m, reflecting rent growth at continued full occupancy, the completion of Scape Wembley, and continuing yield compression, with the blended net initial yield at 5.04% at end-H118 compared with 5.0% at end-FY17 (the 31 March NAV report shows the blended yield little changed, at 5.01%). The licence fee income in respect of forward funding is not included in IFRS (or EPRA) earnings.
Excluding these revaluation gains, EPRA basis earnings increased by 43% and with the weighted average number of shares in issue increasing slightly faster, EPRA EPS was down slightly, at 1.69p compared with H117. The net proceeds of £68.9m from the equity issuance were used to support the acquisitions of Circus Street, Brighton and Podium. However, a cash balance of c £62m remained at end-H118 to fund the remaining investment commitments, primarily related to completing the Scape Bloomsbury refurbishment and the construction of Circus Street. Completion of Scape Bloomsbury is scheduled in time for the 2018/19 academic year and Circus Street is expected to complete in time for the 2019/20 academic year. The investment manager has indicated that on a fully operational basis, these two assets would add c 2.8p to EPS on an annualised basis, suggesting that DIGS continues to invest in a manner that is consistent with full dividend cover on a stabilised basis. In practice, portfolio stabilisation will likely be deferred as the investment manager continues to review a number of investment opportunities that meet its investment criteria. This is in addition to the conditional acquisition agreement entered into in October 2017 for the acquisition of a c 400-bed asset located adjacent to the Queen Mary University of London.
Benefiting from the revaluation gains, EPRA NAV per share increased by 5.2%, or 7.2p, to 146.31p during the six-month interim period to 31 December 2017 and, combined with dividends paid of 2.94p, EPRA NAV total return was 7.3%. The Q318 NAV, as at 31 March 2018, has since been published, showing an increase to 146.92p (cum-income), and combined with dividends paid of 4.42p, EPRA NAV total return was 8.8% in the first nine months of FY18.
Fund performance track record
The last quarterly NAV data for DIGS are as of 31 March 2018. In the period since the company listed on 20 May 2013 to 31 March 2018, DIGS generated an EPRA NAV total return (dividends reinvested) of 83.3%, or an annualised compound return of 13.2% pa. The share price total return over the same period (dividends reinvested) was an aggregate 70.6%, or an annualised compound return of 11.6% pa, but this has since increased to an aggregate return of 82.3% or 12.7% annualised (as at 25 May 2018). Both the NAV and share price total return are well ahead of the 8-10% target for long-term shareholder returns set by DIGS at IPO, including growing dividends per share and modest long-term capital appreciation. To date, around one-third of the returns have been generated by dividends and two-thirds by capital appreciation, driven by full occupancy and rent growth, as well as the tightening in valuation yields (increasing asset prices). Looking forward, the prospects for rental growth continue to appear positive, and with continuing growth in the income generating asset base, it seems likely that the contribution of recurring income/dividends to returns will increase. Rental growth should continue to support capital values, but it seems less likely that yield tightening can continue at the same pace as in recent years and, depending on the course of long-term interest rates, they may even widen at some point in the future.
Exhibit 14: DIGS – returns since IPO
1 year |
3 years |
Since IPO of DIGS |
|
DIGS share price total return |
(3.5) |
11.0 |
11.6 |
DIGS NAV total return |
10.4 |
11.8 |
13.2 |
All-UK property index total return |
6.6 |
0.3 |
7.0 |
FTSE All-Share total return |
1.2 |
5.9 |
5.7 |
Benchmark UK 10-year bond total return |
(0.3) |
3.1 |
4.0 |
Source: Thomson Datastream, Edison Investment Research. Note: Data to 31 March 2018.
The DIGS NAV total return is ahead of the broad UK commercial property sector and the FTSE All-Share Index over three years and since inception, and ahead of UK gilt returns over all periods.
There has been some divergence between share price return and NAV return over the past year or so, which can best be seen in the following price/NAV chart. With the exception of the period immediately following the mid-2016 EU referendum result, DIGS had until fairly recently traded at a consistent premium to NAV, of up to 10%. However, from September 2017, the ratio dropped steadily from a c 6% premium to a discount of c 5%, before settling more recently at around par.
|
Exhibit 15: Share price premium/discount to NAV (including income) since IPO |
|
|
Source: Thomson Datastream |
To some extent the de-rating of DIGS compared with its NAV reflects a more general de-rating of the UK-listed property sector in recent months (Exhibit 16), coinciding with increased interest rate expectations and some loss of UK economic momentum. The effect has been more noticeable for those companies in the mainstream commercial property segment that are more dependent upon asset management initiatives to drive capital appreciation, and generally less so for income focused companies, which is how we would describe DIGS.
|
Exhibit 16: DIGS premium/discount to NAV compared with the UK property sector (%) |
|
|
Source: Bloomberg, Thomson Reuters |
In Exhibit 17, we look more closely at the three listed student accommodation companies, DIGS, Unite and Emperic. As the longest established and largest company in the sector, operating nationwide as both investor and developer, Unite has continued to perform strongly over the past 12 months, which appears to indicate that investor interest in the sector as a whole remains positive. Unite’s share price performance is ahead of both the FTSE All-Share Index and the UK property index and is only a little off its 12-month high. Empiric has been a weak performer by contrast, with significant management upheaval, and in November 2017 reduced its dividend guidance for the year to 31 December 2017 from 6.1p per share to 5.55p and signalled that it would target a 5.0p per share payout for 2018. An operational review had identified a number of operational inefficiencies which had adversely affected its performance, reflected in disappointing occupancy at some properties and poor cost control, partly related to the migration process of properties onto its in-house asset management platform. DIGS offers a higher dividend yield than Unite yet it trades on a lower P/NAV and its share price performance has been weaker over the past 12 months, broadly tracking the overall property sector. It may be that investors are focusing on the current lack of dividend cover even though the guidance provided by management suggests that this represents a temporary shortfall, during the construction/refurbishment phase of two key assets, rather than any structural over-distribution. With that in mind, the lower rating seems somewhat surprising given the fundamental strength of the London student accommodation market.
Exhibit 17: Student accommodation valuations and performance
Price |
Market cap. (£m) |
P/NAV |
Yield |
Share price performance |
||||
One month |
Three months |
12 months |
From 12-month high |
|||||
Unite |
851 |
231 |
1.18 |
3.3 |
2% |
10% |
33% |
-3% |
Empiric Student Properties |
88 |
528 |
0.84 |
5.7 |
3% |
5% |
-23% |
-24% |
GCP Student Living |
147 |
566 |
1.00 |
4.0 |
6% |
6% |
-2% |
-3% |
Average |
1.01 |
4.31 |
3% |
7% |
2% |
-10% |
||
UK property index |
4.1 |
-1% |
7% |
3% |
-2% |
|||
FTSE All-Share Index |
3.8 |
2% |
6% |
2% |
-3% |
|||
Source: Company data, Edison Investment Research, Bloomberg data as at 29 May 2018
|
|
The year to date has been highly productive for CollPlant. It has completed a new production facility in Rehovot to support its increased commercial efforts. These include both its BioInk product for 3D bioprinting of organs and tissue, as well as VergenixFG and VergenixSTR for wound care and tendinopathy respectively, which are expanding operations in Europe. In addition, the company has announced its intention to de-list from TASE to trade exclusively on NASDAQ.