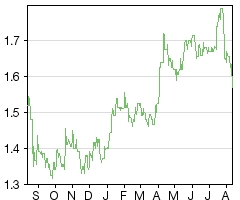
China Aviation Oil (Singapore) Corporation (CAO) has made good progress in the first half of the year, benefiting from favourable volume growth offset to a degree by FX and the non-recurrence of positive stock valuation. Trading conditions look more challenging in the second half with the jet fuel market having moved into backwardation since early July. We are thus taking a much more cautious view on the second half and have reduced our forecasts accordingly. It is important to recognise that cash generation has been far stronger than expected and should remain favourable in H2 as inventory is released and the main associate dividend is received. Thus, our fair value actually increases to US$1.55 (S$2.11) per share from US$1.45 (S$2.04) as a result.
Written by
China Aviation Oil (Singapore) |
Progress in a backward market |
H117 results update |
Aviation services |
14 August 2017 |
Share price performance
Business description
Next events
Analysts
China Aviation Oil (Singapore) is a research client of Edison Investment Research Limited |
|||||||||||||||||||||||||||||||||||||||||||||||
China Aviation Oil (Singapore) Corporation (CAO) has made good progress in the first half of the year, benefiting from favourable volume growth offset to a degree by FX and the non-recurrence of positive stock valuation. Trading conditions look more challenging in the second half with the jet fuel market having moved into backwardation since early July. We are thus taking a much more cautious view on the second half and have reduced our forecasts accordingly. It is important to recognise that cash generation has been far stronger than expected and should remain favourable in H2 as inventory is released and the main associate dividend is received. Thus, our fair value actually increases to US$1.55 (S$2.11) per share from US$1.45 (S$2.04) as a result.
Year end |
Revenue (US$m) |
PBT* |
EPS* |
DPS |
P/E |
Yield |
12/15 |
8,987 |
62.4 |
7.2 |
2.1 |
16.0 |
1.8 |
12/16 |
11,703 |
89.9 |
10.4 |
3.3 |
11.1 |
2.9 |
12/17e |
13,073 |
96.2 |
11.1 |
3.3 |
10.4 |
2.9 |
12/18e |
14,680 |
108.8 |
12.5 |
3.8 |
9.2 |
3.3 |
Note: *PBT and EPS are normalised, excluding amortisation of acquired intangibles, exceptional items and share-based payments.
Steady H1 progress
The core trading volumes expanded positively as revenues increased 55% in H1, or by US$2.5bn to US$7.0bn. The gross margin fell 14bps to 0.37% but gross profit was up almost 13% at US$26.0m. The main associate, SPIA, the largest contributor to group net income, experienced a flatter than expected first half. Trading volumes were strong but the absence of stock profit and the 5% decline in the renminbi against the US dollar offset this. Overall, the associates’ contribution fell by 1% to US$33.2m. Interest income rose as net cash balances increased ahead of expectations, but overall EPS progression of 4.5% was steady.
Second half challenging for core trading
The jet fuel market moving into backwardation has implications for the storage associates and the core trading business. Both are expected to experience tougher H2 trading conditions as inventory is sold down across the market. As a result, we have reduced our earnings forecasts by 7% for FY17 and FY18, as gross margins in trading are squeezed and storage utilisation rates fall. However, the US$83m increase in net cash to US$260m in H1 should be followed by an additional strong H2 inflow. This provides potential for M&A targeted at CAO’s supply chain to increase the efficiency of delivery of traded volumes in line with group strategy. With 47 airports now serviced outside of China, the expanded regional footprint of the core trading activity should provide new opportunities.
Valuation: Underpinned by healthy cash base
Although the trading outlook has tightened since the half year, the cash position is far better than anticipated. Our fair value of US$1.55 (S$2.11) per share is therefore 7% (3%) higher than when we initiated in February. A return to stronger growth in FY18 should permit further progress in the valuation.
Interim results
Exhibit 1: China Aviation Oil (Singapore) interim results summary
Six months to June (US$m) |
H116 |
H117 |
% change |
Revenues |
|||
Middle distillates |
3,309.5 |
4,881.3 |
47.5% |
Other oil products |
1,178.1 |
2,102.5 |
78.5% |
Group revenue |
4,487.6 |
6,983.8 |
55.6% |
Gross profit |
23.08 |
26.03 |
12.8% |
Gross margin |
0.51% |
0.37% |
|
EBITDA |
15.19 |
17.85 |
17.5% |
Associates |
33.55 |
33.20 |
-1.0% |
PBT |
49.64 |
52.01 |
4.8% |
Net income |
47.77 |
49.88 |
4.4% |
EPS (c) |
5.55 |
5.80 |
4.5% |
Net cash |
211.4 |
260.3 |
65.6% |
Source: China Aviation Oil (Singapore) reports
Core trading operations
The volume of products supplied and traded increased by 2.03mt to 15.66mt, of which the increase was evenly split between middle distillates and other oil products. Middle distillates volume in the period was up 11.6% or 0.99mt, representing 71% of the total traded. Jet fuel volumes grew 1.13mt (16.8%) with a small reduction in the supply of other middle distillates. Jet fuel supply accounted for 83% of middle distillates volume. Supply of other oil products increased by 20% to 6.12mt.
Exhibit 2: Volumes of oil products traded
Six months to June (mt) |
H116 |
H117 |
% change |
– Jet fuel |
6.74 |
7.87 |
16.8% |
– Other |
1.80 |
1.66 |
-7.8% |
Middle distillates |
8.54 |
9.53 |
11.6% |
Other oil products |
5.09 |
6.12 |
20.2% |
Total |
13.63 |
15.66 |
18.4% |
Source: China Aviation Oil (Singapore) H117 report
Revenues for the group increased by 56% in the first half to almost US$7bn, driven by higher oil prices and the 18% volume increase. Gross profit increased by US$2.9m to US$26.0m, (H116: US$23.1m), a margin of 0.37% (H116: 0.51%).
Associates surprisingly flat during H117
Exhibit 3: Share of associates’ contribution to profit before tax (US$000s)
Associate |
Activity |
Stake |
H116 |
H117 |
% change |
SPIA |
Sole jet fuel supplier and all infrastructure at Shanghai Pudong International Airport |
33% |
29,606 |
29,038 |
-1.9% |
TSN-PEKCL |
Pipeline transportation of jet fuel to Beijing Capital and Tianjin Binhai international airports |
49% |
1,806 |
1,563 |
-13.5% |
Xinyuan |
Tank storage facilities in Guangdong province China |
39% |
120 |
236 |
96.7% |
OKYC |
Largest independent storage tank terminal in South Korea |
26% |
2,499 |
2,739 |
9.6% |
CNAF HKR |
Plane refuelling at Hong Kong International Airport at Chek Lap Kok |
39% |
-484 |
-373 |
22.9% |
Total |
33,547 |
33,203 |
-1.0% |
Source: China Aviation Oil (Singapore) reports
The share of profits from associates before tax was lower than expected in the first half. The reason was largely the flat performance of the main associate, SPIA, in which CAO has a 33% interest. It runs the supply system of jet fuel at Shanghai Pudong International Airport, one of the fastest growing airports in the world. While volume growth was very strong, profits did not benefit from the positive mark to market of buffer inventory experienced in H116 due to the rise in jet fuel prices. In addition, the Chinese renminbi weakened by 5% against the US dollar, which adversely affected translation on consolidation. While the storage facilities investments and the Hong Kong refuelling performed well, these are much smaller, as is the jet fuel pipeline operator in China, which saw profits fall significantly due to lower volumes and other operating income.
The most positive feature of the first half was the strength of cash generation, largely due to working capital requirements and notably the reduction in inventory levels held for trading during the period of almost US$52.5m. As a result, the US$100m borrowing facility was paid down and net cash increased to US$260m from US$187m at the end of FY16. Overall, net bank interest income improved by US$1m to US$1.4m. Net income rose 4.4% to US$49.9m, which translated to a similar increase in H117 EPS to 5.80 US cents per share (H116: 5.55 US cents).
Outlook
Core trading activities face increased challenges in H2
The core strategy remains unaltered. Demand for air transport and thus for jet fuel continues to grow strongly, especially in China. CAO continues to expand its supply of jet fuel to an increasing number of airports globally, currently 47. It also continues to diversify into the supply of other oil products internationally. As the largest jet fuel trader in Asia, it mitigates its risk primarily through back-to-back supply contracts that account for around 90% of volumes traded, with the remainder essentially an opportunity to optimise margins. While the development of the core trading activity should provide an element of growth for CAO in the longer term, the movement into backwardation of the jet fuel market creates a less favourable environment for the oil trading activities as future prices are lower than spot. Essentially this leads to direct pass through trades to fill supply contracts, which tends to limit optimisation strategies with an adverse impact on gross margins.
Associate growth remains a key earnings and cash driver
When combined with the continued growth of the dividend stream from the associate investments in related supply areas around Asia, the core trading diversification strategy should continue to drive growth in shareholder returns in the longer term. In particular, the fundamentals that drive SPIA should continue to be favourable. Specifically, a fifth runway is due to open in Q417 and a new terminal hub in 2018. The expectation is that growth of demand for jet fuel in the rapidly growing airport will be very strong, driven by the resultant increase in air traffic volumes, and that SPIA should see corresponding growth in its performance with healthy margins in local currency terms. Meanwhile it should be noted that the South Korean storage associate is likely to see capacity utilisation drop, reversing some of the H117 improvement.
Financials
The balance sheet is going to continue to strengthen in H217 as inventories are released and as the company receives a significantly increased FY16 dividend from SPIA. The greater challenges in the trading operations have led us to reduce our earnings forecasts for both this year and next. This is despite higher net interest income and the expected improvement in SPIA’s contribution in H2.
Exhibit 4: Forecast revisions
Sales (US$bn) |
Net income (US$m) |
Net cash (US$m) |
|||||||
Old |
New |
% chg |
Old |
New |
% chg |
Old |
New |
% chg |
|
2017e |
13.23 |
13.07 |
-1 |
102.1 |
95.2 |
-7 |
225 |
320 |
+42 |
2018e |
14.92 |
14.68 |
-2 |
115.6 |
107.7 |
-7 |
269 |
378 |
+41 |
Source: Edison Investment Research estimates
Exhibit 5: Financial summary
US$m |
2014 |
2015 |
2016 |
2017e |
2018e |
|
Year end 31 December |
IFRS |
IFRS |
IFRS |
IFRS |
IFRS |
|
PROFIT & LOSS |
||||||
Revenue |
|
17,061 |
8,987 |
11,703 |
13,073 |
14,680 |
Cost of Sales |
(17,034) |
(8,952) |
(11,659) |
(13,028) |
(14,627) |
|
Gross Profit |
27.4 |
35.4 |
44.0 |
44.3 |
52.8 |
|
EBITDA |
|
14.7 |
25.9 |
30.2 |
31.3 |
41.4 |
Operating Profit (before amort. and except.) |
|
13.9 |
25.2 |
29.6 |
30.8 |
36.3 |
Intangible Amortisation |
(0.7) |
(0.7) |
(0.5) |
(0.2) |
(0.2) |
|
Net income from associates |
38.3 |
38.6 |
60.5 |
62.0 |
68.0 |
|
Exceptionals |
0.8 |
(0.8) |
(0.3) |
0.0 |
0.0 |
|
Other |
0.0 |
0.0 |
0.0 |
0.0 |
0.0 |
|
Operating Profit |
52.4 |
62.3 |
89.2 |
92.5 |
104.1 |
|
Net Interest |
(2.8) |
(0.7) |
0.3 |
3.7 |
4.7 |
|
Profit Before Tax (norm) |
|
48.8 |
62.4 |
89.9 |
96.2 |
108.8 |
Profit Before Tax (FRS 3) |
|
49.6 |
61.6 |
89.5 |
96.2 |
108.8 |
Tax |
(0.5) |
(0.4) |
(0.6) |
(1.0) |
(1.1) |
|
Profit After Tax (norm) |
48.3 |
62.0 |
89.2 |
95.2 |
107.7 |
|
Profit After Tax (FRS 3) |
49.2 |
61.3 |
88.9 |
95.2 |
107.7 |
|
Average Number of Shares Outstanding (m) |
860.2 |
860.2 |
860.2 |
860.2 |
860.2 |
|
EPS - normalised (c) |
|
5.6 |
7.2 |
10.4 |
11.1 |
12.5 |
EPS - normalised fully diluted (c) |
|
5.6 |
7.2 |
10.4 |
11.1 |
12.5 |
EPS - (IFRS) (c) |
|
5.7 |
7.1 |
10.3 |
11.1 |
12.5 |
Dividend per share (c) |
1.5 |
2.1 |
3.3 |
3.3 |
3.8 |
|
Gross Margin (%) |
0.2 |
0.4 |
0.4 |
0.3 |
0.4 |
|
EBITDA Margin (%) |
0.1 |
0.3 |
0.3 |
0.2 |
0.3 |
|
Operating Margin (before GW and except.) (%) |
0.1 |
0.3 |
0.3 |
0.2 |
0.2 |
|
BALANCE SHEET |
||||||
Fixed Assets |
|
279.3 |
273.7 |
288.2 |
296.7 |
306.2 |
Intangible Assets |
2.4 |
1.8 |
1.6 |
1.5 |
1.5 |
|
Tangible Assets |
6.8 |
6.2 |
5.7 |
5.5 |
5.4 |
|
Investments |
270.1 |
265.6 |
281.0 |
289.7 |
299.3 |
|
Current Assets |
|
1,099.4 |
571.9 |
1,056.2 |
915.6 |
1,033.0 |
Stocks |
38.1 |
56.8 |
170.7 |
65.4 |
71.2 |
|
Debtors |
823.1 |
296.0 |
316.0 |
326.8 |
356.0 |
|
Cash |
94.3 |
170.5 |
287.3 |
319.7 |
378.0 |
|
Other |
143.9 |
48.5 |
282.2 |
203.7 |
227.8 |
|
Current Liabilities |
|
(819.0) |
(246.7) |
(688.4) |
(489.6) |
(541.2) |
Creditors |
(819.0) |
(246.7) |
(588.4) |
(489.6) |
(541.2) |
|
Short term borrowings |
0.0 |
0.0 |
(100.0) |
0.0 |
0.0 |
|
Long Term Liabilities |
|
(6.2) |
(6.2) |
(6.3) |
(6.3) |
(6.3) |
Long term borrowings |
0.0 |
0.0 |
0.0 |
0.0 |
0.0 |
|
Other long term liabilities |
(6.2) |
(6.2) |
(6.3) |
(6.3) |
(6.3) |
|
Net Assets |
|
553.5 |
592.6 |
649.7 |
716.3 |
791.7 |
CASH FLOW |
||||||
Operating Cash Flow |
|
85.9 |
92.7 |
37.8 |
160.3 |
84.9 |
Net Interest |
(4.5) |
(2.8) |
(0.7) |
0.3 |
3.7 |
|
Tax |
(0.4) |
(0.5) |
(0.4) |
(1.0) |
(1.1) |
|
Capex |
(0.5) |
(0.4) |
(0.4) |
(0.6) |
(0.6) |
|
Acquisitions/disposals |
0.0 |
0.0 |
0.0 |
0.0 |
0.0 |
|
Financing |
0.0 |
0.0 |
0.0 |
0.0 |
0.0 |
|
Dividends |
(13.7) |
(12.8) |
(19.3) |
(26.7) |
(28.6) |
|
Other |
(0.4) |
(0.1) |
(0.4) |
0.0 |
0.0 |
|
Net Cash Flow |
66.6 |
76.2 |
16.8 |
132.4 |
58.3 |
|
Opening net debt/(cash) |
|
(27.7) |
(94.3) |
(170.5) |
(187.3) |
(319.7) |
HP finance leases initiated |
0.0 |
0.0 |
0.0 |
0.0 |
0.0 |
|
Other |
0.0 |
0.0 |
0.0 |
0.0 |
0.0 |
|
Closing net debt/(cash) |
|
(94.3) |
(170.5) |
(187.3) |
(319.7) |
(378.0) |
Source: China Aviation Oil (Singapore) reports, Edison Investment Research estimates
|
|
Paysafe’s H117 results show that organic constant currency growth is moderating to low double-digit rates, after an exceptional period of growth in 2016. Profitability was strong during the period, helped by the strong growth and margins of the Asia Gateway business. The sale of Asia Gateway and the acquisition of MCPS will both help reduce the group’s exposure to online gambling, and MCPS will strengthen the group’s position in bricks and mortar payment processing.