Paysafe’s H117 results show that organic constant currency growth is moderating to low double-digit rates, after an exceptional period of growth in 2016. Profitability was strong during the period, helped by the strong growth and margins of the Asia Gateway business. The sale of Asia Gateway and the acquisition of MCPS will both help reduce the group’s exposure to online gambling, and MCPS will strengthen the group’s position in bricks and mortar payment processing.
Paysafe Group |
Growth normalises |
H117 results |
Software & comp services |
11 August 2017 |
Share price performance
Business description
Next events
Analysts
For the purposes of the Takeover Code, Edison Investment Research is deemed to be connected with Paysafe. Paysafe Group is a research client of Edison Investment Research Limited |
|||||||||||||||||||||||||||||||||||||||||||||||
Paysafe’s H117 results show that organic constant currency growth is moderating to low double-digit rates, after an exceptional period of growth in 2016. Profitability was strong during the period, helped by the strong growth and margins of the Asia Gateway business. The sale of Asia Gateway and the acquisition of MCPS will both help reduce the group’s exposure to online gambling, and MCPS will strengthen the group’s position in bricks and mortar payment processing.
Year end |
Revenue ($m) |
EBITDA* |
EPS* |
DPS |
P/E |
EV/EBITDA |
12/13 |
253.4 |
53.1 |
15.1 |
0.0 |
50.2 |
74.2 |
12/14 |
365.0 |
82.9 |
22.0 |
0.0 |
34.5 |
47.5 |
12/15 |
613.4 |
152.6 |
25.6 |
0.0 |
29.7 |
25.8 |
12/16 |
1,000.3 |
300.8 |
42.1 |
0.0 |
18.0 |
13.1 |
Note: *EBITDA and EPS are normalised, excluding amortisation of acquired intangibles, exceptional items and share-based payments
Growth moderates in H117
Paysafe saw growth moderating across all divisions, with reported revenue growth of 11% and organic constant currency growth of 12% (H116: 20%, H216: 21%). Once the major merchant is excluded, this moderated to 10%. The company achieved an EBITDA margin of 31.4%, better than the company’s (pre-bid) guidance for a margin of at least 30.1%. The tax rate has trended up, as expected, as more revenues were generated in higher tax regions. Adjusted EPS increased 23% y-o-y to 25c. The company ended H117 with net debt (including deferred financing fees) of $259.9m.
Pro forma financials show potential impact of deals
Paysafe has provided pro-forma financials to show the financial performance of the Asia Gateway business (due to be sold when the takeover of Paysafe completes) and Merchants’ Choice Payment Solutions (MCPS - in the process of being acquired by Paysafe) during H117. The Asia Gateway business grew faster than the rest of the Payment Processing division, achieved a higher EBITDA margin (39.5%) and net margin (38.2%) than the Paysafe group and contributed 23% of group earnings in H117. MCPS showed 3% revenue growth, achieved a 15.0% EBITDA margin and 3.6% net margin, and if owned for the whole of H117, would have added 5% to H1 earnings before synergies.
Valuation: Reflects active payments M&A market
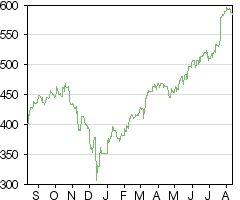
The formal offer of 590p is at a 9% premium to the closing price on 20 July but at a 34% premium to the volume weighted average price over the six months to 30 June, just prior to the start of sector M&A activity. Prior to 21 July (when the potential bid was announced), the stock had gained 46% year to date.
Review of H117 results
Exhibit 1: Financial highlights
$000 |
H117 |
H116 |
y-o-y |
Revenues |
538,656 |
486,739 |
10.7% |
Gross margin |
56.0% |
53.5% |
2.4pp |
Adjusted EBITDA |
169,242 |
144,180 |
17.4% |
EBITDA margin |
31.4% |
29.6% |
1.8pp |
Adjusted EBIT |
152,048 |
129,244 |
17.6% |
EBIT |
99,601 |
89,702 |
11.0% |
Net interest expense |
(10,554) |
(15,151) |
-30.3% |
Adjusted PBT |
141,494 |
114,093 |
24.0% |
PBT |
89,047 |
74,551 |
19.4% |
Tax |
(15,340) |
(10,012) |
53.2% |
Adjusted net income |
124,054 |
101,381 |
22.4% |
Net income |
73,707 |
64,539 |
14.2% |
Normalised EPS (c) |
24.7 |
20.1 |
23.0% |
EPS (c) |
15.2 |
13.4 |
13.2% |
Source: Paysafe
Paysafe reported H117 revenue growth of 10.7% y-o-y (+12% organic, constant currency) and an increase in gross margin of 2.4pp. Adjusted EBITDA increased by 17.4% generating an EBITDA margin of 31.4%, up 1.8pp from a year ago and 1.3pp from FY16.
Exceptional items totalled $21.9m in H117, including acquisition-related costs of $1.4m, foreign exchange losses totalling $7.0m and adjustments related to contingent consideration. In H117, the share-based contingent consideration owing to Meritus resulted in a fair value loss of $12.8m. During the period, the FANS consideration was renegotiated for certain vendors, with a cash payment of $3.3m agreed in place of share-based consideration that would have resulted in the issue of 790,908 shares over a three-year period. This resulted in an exceptional loss of $1.2m. Paysafe also recognised an exceptional gain of $0.7m due to MeritCard not hitting all of its post- acquisition targets.
The reported tax rate was 17.2% for the period, up from 13.4% in H116 but essentially flat compared to H216. The adjusted tax rate of 12.3% was higher than the 11.1% in H116 but lower than H216’s 12.7% rate. Intellectual property was transferred from the Isle of Man to the UK during H117 and this had a one-off positive impact on the rate – without that the rate would have been c 14%. The company switched its tax residence from the Isle of Man to the UK on 1 August 2017.
The company ended H117 with a net debt position (including deferred financing fees) of $259.9m, down from $279.8m at the end of FY16. This resulted in a net debt/LTM adjusted EBITDA ratio of 0.8x at the end of H117, down from 0.9x at the end of FY16. Adjusted cash conversion (adjusted free cash flow as a percentage of adjusted EBIT) was 98% in H117 (H116: 74%). Before payments working capital, cash conversion was 77% (H116: 78%).
The largest customer made up 19% of group revenues, down from 20% in H116 and FY16. Excluding Asia Gateway revenues, the group grew revenues 10% on an organic, constant currency basis.
Exhibit 2: Divisional performance
H115 |
H215 |
H116 |
H216 |
H117 |
|
Payment processing |
|||||
Reported revenue growth |
47% |
28% |
34% |
17% |
14% |
Pro forma constant currency revenue growth |
7% |
25% |
28% |
15% |
16% |
Pro forma constant currency revenue growth excl. major merchant |
24% |
33% |
32% |
10% |
11% |
Reported gross margin |
37% |
37% |
39% |
42% |
42% |
Digital Wallet |
|||||
Reported revenue growth |
20% |
127% |
195% |
50% |
8% |
Pro forma constant currency revenue growth |
20% |
14% |
28% |
33% |
9% |
Reported gross margin |
73% |
73% |
76% |
74% |
81% |
Prepaid |
|||||
Reported revenue growth |
N/A |
N/A |
N/A |
42% |
5% |
Pro forma constant currency revenue growth |
12% |
10% |
11% |
19% |
9% |
Pro-forma/reported gross margin |
50% |
51% |
52% |
53% |
52% |
Group |
|||||
Reported revenue growth |
40% |
90% |
118% |
32% |
11% |
Pro forma constant currency revenue growth |
12% |
14% |
20% |
21% |
12% |
Reported gross margin |
45% |
50% |
54% |
55% |
56% |
Source: Paysafe
Payment Processing
Payment Processing showed strong constant currency organic growth of 16% in H117. Excluding the major merchant, growth was 11%, moderating from the 32% achieved in H116 but similar to the 10% reported in H216. Volumes processed of $12.4bn were 10.7% higher than a year ago; the take rate of 2.1% was flat year-on-year. Gross margin increased year-on-year but was flat versus H216.
Digital Wallets
Digital Wallets also saw a moderating growth rate: in H117 constant currency organic growth fell to 9% from 28% in H116 and 33% in H216. Several factors reduced the growth rate: a) the company withdrew from servicing online gambling in Japan for regulatory reasons; b) the issuance of pre-paid cards was restricted in non-SEPA countries; and c) more rigorous KYC measures were enforced. In addition, 2016 saw the benefit of the UEFA championships and volume growth from the addition of new territories and payment methods. Volumes processed in H117 of $10.7bn were 6% lower than a year ago, although the take rate increased to 1.5% from 1.3% as a result of fee increases enacted over the last 12 months. Additionally, revenues from Income Access (acquired September 2016) and card issuing do not generate transaction volumes. Gross margin saw a significant uptick (81% vs 76% in H116 and 74% in H216), helped by the termination of lower-margin business and lower bad debts.
Prepaid
The Prepaid division achieved organic constant currency revenue growth of 9% in H117, down from 11% in H116 (once the impact of discontinued Ukash business is excluded). Volumes transacted were flat year-on-year at $1.4bn, with the take rate increasing marginally to 7.7% from 7.6% a year ago. Gross margin was substantially unchanged compared to H116 and H216.
Pro-forma financials
The company also provided pro-forma financials for H117 for the Asia Gateway (due to be sold at the same time as the takeover) and Merchants’ Choice Payment Solutions (MCPS – agreement to acquire announced 21 July).
Exhibit 3: Pro-forma financials for H117
$m |
Paysafe |
Asia Gateway |
MCPS |
Pro-forma group* |
Revenues |
538.7 |
76 |
167 |
629.7 |
Adjusted EBITDA |
169.2 |
30 |
25 |
164.2 |
Adjusted EBITDA margin |
31.4% |
39.5% |
15.0% |
26.1% |
Adjusted EBIT |
152.0 |
29 |
18 |
141 |
Adjusted EBIT margin |
28.2% |
38.2% |
10.8% |
22.4% |
Adjusted net income |
124.1 |
29 |
6 |
101.1 |
Adjusted net margin |
23.0% |
38.2% |
3.6% |
16.1% |
Source: Paysafe. Note: *Paysafe plus MCPS minus Asia Gateway.
The Asia Gateway grew revenues 20% y-o-y in H117 and generated an EBITDA margin of 39.5%, which implies that the remaining Paysafe business generated an EBITDA margin of 30.0% in H117. The Asia Gateway business paid no tax so generated a strong net margin of 38.2% compared to the group net margin of 23.0%.
MCPS saw growth in pro-forma revenues of 3% y-o-y in H117 and generated an EBITDA margin of 15%. MCPS incurs a higher tax charge than Paysafe as it is US-based. As previously stated, Paysafe is targeting annualised cost synergies of $7.5m by the end of FY18. This acquisition will substantially increase the proportion of Payment Processing revenues from bricks and mortar stores.
Exhibit 4: Financial summary
$'000s |
2013 |
2014 |
2015 |
2016 |
||
Year end 31 December |
IFRS |
IFRS |
IFRS |
IFRS |
||
PROFIT & LOSS |
||||||
Revenue |
|
|
253,367 |
364,954 |
613,392 |
1,000,282 |
Cost of Sales |
(121,484) |
(187,298) |
(316,922) |
(457,420) |
||
Gross Profit |
131,883 |
177,656 |
296,470 |
542,862 |
||
EBITDA |
|
|
53,106 |
82,946 |
152,620 |
300,825 |
Company EBITDA |
|
|
52,213 |
85,965 |
152,563 |
300,825 |
Operating Profit (before amort acq intang, SBP and except.) |
42,888 |
71,257 |
133,201 |
268,251 |
||
Amortisation of acquired intangibles |
(3,300) |
(9,200) |
(31,900) |
(51,900) |
||
Exceptionals |
(1,368) |
7,219 |
(60,986) |
(8,249) |
||
Share-based payments |
(4,512) |
(8,274) |
(14,089) |
(13,726) |
||
Operating Profit |
33,708 |
61,002 |
26,226 |
194,376 |
||
Net Interest |
(995) |
(2,024) |
(14,418) |
(26,383) |
||
Profit Before Tax (norm) |
|
|
41,893 |
69,233 |
118,783 |
241,868 |
Profit Before Tax (FRS 3) |
|
|
32,713 |
58,978 |
11,808 |
167,993 |
Tax |
(1,235) |
(1,303) |
(4,405) |
(25,972) |
||
Profit After Tax (norm) |
40,311 |
67,703 |
108,686 |
212,968 |
||
Profit After Tax (FRS3) |
31,478 |
57,675 |
7,403 |
142,021 |
||
Average Number of Shares Outstanding (m) |
252.2 |
277.7 |
399.8 |
483.6 |
||
EPS - normalised (c) |
|
|
15.1 |
22.0 |
25.6 |
42.1 |
EPS - FRS 3 (c) |
|
|
12.5 |
20.8 |
1.9 |
29.4 |
DPS (c) |
0.00 |
0.00 |
0.00 |
0.00 |
||
Gross Margin (%) |
52.1% |
48.7% |
48.3% |
54.3% |
||
EBITDA Margin (%) |
21.0% |
22.7% |
24.9% |
30.1% |
||
Company EBITDA Margin (%) |
20.6% |
23.6% |
24.9% |
30.1% |
||
Operating Margin (before am and except.) (%) |
16.9% |
19.5% |
21.7% |
26.8% |
||
BALANCE SHEET |
||||||
Fixed Assets |
|
|
65,551 |
295,955 |
1,569,269 |
1,552,326 |
Intangible Assets |
53,231 |
284,723 |
1,548,253 |
1,518,445 |
||
Tangible Assets |
12,320 |
10,114 |
18,492 |
23,452 |
||
Other Fixed Assets |
0 |
1,118 |
2,524 |
10,429 |
||
Current Assets |
|
|
184,490 |
177,275 |
259,045 |
420,313 |
Cash & cash equivalents |
|
|
164,379 |
109,893 |
117,875 |
231,157 |
Restricted NETELLER cash |
|
|
6,198 |
8,777 |
29,070 |
31,854 |
Cash held as reserves & settlement assets |
|
|
0 |
38,607 |
66,341 |
100,459 |
Receivable from Members & Merchants |
|
|
0 |
0 |
0 |
0 |
Trade and other debtors |
|
|
13,913 |
19,998 |
45,759 |
56,843 |
Current Liabilities |
|
|
117,634 |
114,410 |
170,943 |
232,617 |
Creditors |
107,524 |
58,240 |
121,070 |
175,464 |
||
Payable to Members/Merchant liability |
0 |
30,591 |
16,758 |
18,547 |
||
Short term borrowings |
10,110 |
25,579 |
33,115 |
38,606 |
||
Long Term Liabilities |
|
|
801 |
150,498 |
582,804 |
521,788 |
Long term borrowings |
801 |
107,205 |
494,410 |
456,570 |
||
Other long term liabilities |
0 |
43,293 |
88,394 |
65,218 |
||
Net Assets |
|
|
131,606 |
208,322 |
1,074,567 |
1,218,234 |
CASH FLOW |
||||||
Operating Cash Flow |
|
|
94,542 |
42,699 |
91,711 |
278,487 |
Net Interest |
(158) |
(1,873) |
(8,403) |
(12,459) |
||
Tax |
(1,191) |
(1,564) |
(4,929) |
(10,186) |
||
Capex |
(13,567) |
(11,094) |
(23,721) |
(53,698) |
||
Acquisitions/disposals |
(5,281) |
(169,192) |
(1,102,070) |
(43,827) |
||
Financing |
1,188 |
(4,939) |
670,173 |
(13,482) |
||
Dividends |
0 |
0 |
0 |
0 |
||
Net Cash Flow |
75,533 |
(145,963) |
(377,239) |
144,835 |
||
Opening net (debt)/cash |
|
|
85,829 |
118,389* |
(22,891) |
(409,650) |
HP finance leases initiated |
0 |
0 |
0 |
0 |
||
Other |
(1,697) |
4,683 |
(9,520) |
796 |
||
Closing net (debt)/cash |
|
|
159,665* |
(22,891) |
(409,650) |
(264,019) |
Source: Paysafe. Note: *Does not match as method of reporting was changed.
|
|
Research: Investment Companies
Schroder AsiaPacific Fund (SDP) invests in markets across the Asia Pacific region (excluding Japan) with the aim of achieving capital growth. Managed by Matthew Dobbs since launch in 1995, the trust is the largest and among the most liquid in its peer group. It has produced top-quartile NAV total returns over one, three and five years, also beating its benchmark MSCI AC Asia ex-Japan index over one, three, five and 10 years in both NAV and share price terms. In spite of this, it trades at a wider discount than the peer group average. The manager focuses on companies with visible earnings growth, strong management, sustainable cash flows and valuation support. While sector and geographical weightings are an output of stock selection, there is a significant allocation towards Greater China and the information technology sector. Reflecting the growing level of dividends from Asian companies, SDP has a yield of just over 1%.