Last close As at 06/08/2026
—
— 0.00 (0.00%)
Market capitalisation
—
Research: Real Estate
Town Centre Securities (TCS) says that FY18 ended positively with overall trading in line with the board’s expectations. Like-for-like property rental income increased, with a good level of occupancy maintained, and car parking revenues and profits grew further. In addition to refinancing existing bank debt facilities, TCS has also now completed an innovative refinancing of Merrion House in Leeds, which allows it to maintain its joint ownership, benefit from rental increases and receive a £26.4m cash injection. This will provide additional financial flexibility as TCS continues to invest for growth.
Town Centre Securities |
Positive trading update and innovative refinancing |
Trading updates |
Real estate |
23 July 2018 |
Share price performance
Business description
Next events
Analysts
|
||||||||||||||||||||||||||||||||||||||||||||||||||
Town Centre Securities (TCS) says that FY18 ended positively with overall trading in line with the board’s expectations. Like-for-like property rental income increased, with a good level of occupancy maintained, and car parking revenues and profits grew further. In addition to refinancing existing bank debt facilities, TCS has also now completed an innovative refinancing of Merrion House in Leeds, which allows it to maintain its joint ownership, benefit from rental increases and receive a £26.4m cash injection. This will provide additional financial flexibility as TCS continues to invest for growth.
Year end |
Net revenue (£m) |
EPRA |
EPRA |
EPRA NAV/ |
DPS |
P/NAV |
Yield |
06/16 |
18.6 |
6.6 |
12.4 |
357 |
11.0 |
0.81 |
3.8 |
06/17 |
19.4 |
7.0 |
13.2 |
359 |
11.5 |
0.80 |
4.0 |
06/18e |
19.7 |
6.9 |
13.1 |
387 |
11.5 |
0.74 |
4.0 |
06/19e |
20.0 |
7.3 |
13.7 |
399 |
12.2 |
0.72 |
4.2 |
06/20e |
20.6 |
7.9 |
14.9 |
412 |
12.7 |
0.70 |
4.4 |
Note: *EPRA EPS is adjusted to exclude revaluation movements, disposal gains/(losses) on investment property and exceptional items.
No changes in forecasts
Like-for-like passing rent increased by 4.1% or 1.9% excluding the post-completion step-up in rent at Merrion House and vacancy created by the previously reported exit of Homebase at Milngavie. Occupancy was maintained at a good level of 95% (FY17 99%) with the majority of the increase in voids attributable to Milngavie, with no obvious signs that retailer stress is having a material impact on the portfolio. CitiPark is benefiting from improved performance at newer sites. Progress with key developments – current and planned – continues, while the refinancing of bank debt and the innovative Merrion House refinancing provide added certainty and flexibility to investment funding for future growth. We will review our development assumptions and estimates with the full year results in September.
Unlocking value from a strong development pipeline
Capital recycling is a key element of strategy, with more than £85m recycled into new investments over the past five years. Opportunities with a developed value of up to £600m, and significant potential to enhance earnings and NAV over time remain and management is exploring how quickly to proceed and how best to fund these. The Merrion House refinancing provides additional flexibility, while additional capital recycling and joint ventures are likely to contribute. Additional equity is an option, but may require family shareholders to reassess their position.
Attractive returns and discount to NAV
Despite a strategy of investment to support long-term total return, TCS has increased or maintained DPS every year for 57 years. With a fully covered dividend, the FY18e yield is 4.0%. Benefiting from reinvestment, NAV total return was a compound 8.8% pa in the five years to end-FY17, and our forecasts imply 7.3% in the three years to end-FY21. Meanwhile, the shares trade at a significant 26% discount to FY18e EPRA NAV.
Brief company description
Town Centre Securities (TCS) is a UK Real Estate Investment Trust (REIT) operating across the UK, but with a regional focus, primarily in Leeds and Manchester, where management is able to exploit its strong and detailed knowledge of the local markets, Scotland and (mainly suburban) London. The company is a family-run business with strong income focus and a 57-year record of increased or maintained DPS. It owns a mixed-use portfolio, valued at c £384m as at 31 December 2017, including more than 900,000 sq ft of retail space, more than 360,000 sq ft of mostly prime office space, and key development sites in Leeds and Manchester. It also has a car parking operation (CitiPark), which provides a growing and complementary revenue and earnings stream, while monetising what would in some cases be empty, non-income producing development assets. Intensive asset management and active capital recycling are used to drive income growth and capital returns, and the company has a substantial pipeline of continuing development opportunities. For an in-depth overview of TCS, please see our April 2018 initiation note.
|
Exhibit 1: Portfolio by location |
Exhibit 2: Portfolio by sector |
|
|
|
Source: Town Centre Securities. Note: Split by value as at 31 December 2017 |
|
Exhibit 1: Portfolio by location |
|
|
Source: Town Centre Securities. Note: Split by value as at 31 December 2017 |
|
Exhibit 2: Portfolio by sector |
|
|
Source: Town Centre Securities. Note: Split by value as at 31 December 2017 |
FY18 trading in line with expectations
TCS has recently updated on company developments, including trading for the 12 months to 30 June 2018 (FY18), and will publish full year results on 26 September 2018. The year ended positively and overall trading was in line with the board’s expectations, with good levels of occupancy, an increase in like-for-like property rental income, and continued growth in car parking revenues and profits. In addition to refinancing its existing bank debt facilities, TCS has also now completed a formal agreement with Leeds City Council (LCC) for the refinancing of Merrion House in Leeds, a jointly owned office redevelopment that completed in February 2018. The refinancing will provide additional financial flexibility as the company enters a new phase in its strategy of intensive asset management and capital recycling to drive income growth and capital returns. The key features of the trading update are:
■
Like-for-like passing rent increased by 4.1% during the year, including the step-up in post-completion rental income from Merrion House (TCS share increasing from c £700k pa to c £1.66m pa) offset by the previously announced vacancy at the Milngavie property previously occupied by Homebase (c £600k pa) and now being subdivided for re-letting. Excluding Merrion House and Milngavie, the increase in like-for-like passing rent was 1.9%.
■
Occupancy remained at a good level of 95%, but lower than the 99% reported at end-FY17 and mid-year. The main element in the increase is Milngavie, which we estimate represents c 3% or c 75% of the increase, and there is also an impact from newly developed retail space in Merrion House that remains to be let. There is no obvious sign that the current weakness in the retail sector is having any significant impact on TCS. This will in part reflect investments, over several years, to diversify the Merrion Centre in Leeds into a truly mixed-use asset. Traditional retail “mall” income at the centre now accounts for less than 25% of the total. TCS has exposure, at the Merrion Centre, to struggling retailer Poundworld, although we do not believe that it is material and management has indicated that any vacancy would provide it with welcome flexibility.
■
In Manchester, the Burlington House joint venture residential development is proceeding to budget and is on schedule for completion targeted for May 2019. TCS has clarified that the asset will be held for private rental sector (PRS) use at completion.
■
The £9m acquisition of Ducie House, a multi-let office building with car park, first announced in early May, completed after end-FY18. The acquisition generates annual gross income of £675k and increases the size of the Piccadilly Basin site in Manchester, with the car park adding additional development potential.
■
Not previously announced, since end-FY18 TCS has also added to its suburban London portfolio with the £1.6m acquisition of a mixed residential/commercial asset on Chiswick High Road. The yield on the asset is approaching 5%, lower than other areas of the portfolio but reflecting the expected low volatility. On Princes Street in Edinburgh, a mature retail investment has been sold for £3.3m, significantly ahead of valuation and representing a yield 4.8%.
■
CitiPark, the car parking operation, has continued to grow revenues and profits with some of the newer sites continuing to deliver improving performance. We understand that the relationship with YourParkingSpace.co.uk (YPS) is generating increasing revenue for CitiPark, including in these newer sites, increasing the possibility that TCS may increase its investment in YPS from the current 15%.
■
The three bank debt facilities, c £103m in aggregate, have all been extended or renewed with no material impact on the cost of borrowing but with improved and more flexible terms. The two £35m facilities with Lloyds and Handelsbanken that were due to expire later in 2018 have both been renewed for three years and five years respectively. The exercise of an option on the £33m RBS facility has extended the facility by an additional year. Alongside the £106m long-term (2031), fixed rate (5.375%) debenture, the bank debt refinancing provides certainty for the next three to five years.
Merrion House refinancing adds financial flexibility
Merrion House is a 175k sq ft office building within the Merrion Centre, let on a 25-year lease with capped RPI increases to Leeds City Council (LCC) from its completion in February 2018. It was developed by a 50:50 joint venture (MH LLP) with LCC, with TCS contributing the existing building that it previously owned 100%, with a pre-development value of £20m, and then investing an addition £5m. TCS continued to receive £700k of rental income during the development phase and this increased to c £1.66m at completion. MH LLP, of which TCS owns 50%, is left with an asset that management expects to be valued at c £68m (TCS share £34m). Forming part of the Merrion Centre, this remains a core asset for TCS, but the joint venture ownership limited the options available to TCS to refinance its share of the asset and release capital for reinvestment. In an innovative financing solution, MH LLP has reached agreement for LCC to advance all of the base rent that would be due to it from 1 October 2018 until the end of the lease on 11 February 2043, discounted at an equivalent rate of 3.5% plus costs. As a result, TCS will receive £26.4m in cash. From an accounting perspective, the transaction will be treated as a financing agreement undertaken in MH LLP, which in turn is equity accounted within TCS. MH LLP will continue to recognise the contracted rent with LLC on a quarterly basis, but this will be partly offset by an interest charge calculated on an effective interest rate basis. TCS will continue to recognise its 50% share of MH LLP net income on an equity accounted basis.
The net asset value of TCS will be unaffected. Its cash resources will increase, while the value of its investment in MH LLP will reduce. The MH LLP balance sheet will reflect the full value of the property, less the deferred income balance, which will gradually reduce to zero by the maturity of the lease.
In addition to the base rent, the lease allows for capped RPI increases every five years. These will continue to apply but will flow as normal rental payments through MH LLP.
The agreement is made possible by the close working relationship between TCS and LCC. From the TCS perspective there is no risk attached other than to ensure that the building remains fully insured and capable of meeting the lease commitments until lease expiry.
In the short term the proceeds will be used to reduce debt but, more strategically, the transaction creates additional flexibility for TCS to invest in its acquisition and development programme for future growth.
We are not changing forecasts at this stage
Our multi-year forecasts for the period ending June 2020 were set out in detail in our initiation note, and we are not changing these on the back of the trading statement and recent developments. The trading update appears consistent with our FY18 forecast and we will review the future year forecasts with the full year results, when we expect management to provide and update on development, capital recycling and funding plans.
With the interim results, management provided details of a substantial pipeline of continuing development opportunities with an estimated developed value of up to £600m. In addition to the Burlington House development, to capture some of the potential that is available to TCS from this wide range of opportunities, we have assumed three further development projects in our current forecasts (from a pipeline that numbers 16). However, there is inevitably some uncertainty as to which projects will proceed, the timing of these projects, and the choices over funding between new debt/equity capital and/or recycling of capital from mature assets. The projects that we have assumed thus far are:
■
The development of an apart-hotel with retail units at George Street in Leeds in a joint venture with LCC.
■
The development of 126 residential units above ground floor commercial space at Eider House in Manchester, for which we have assumed a joint venture structure, similar to Burlington House.
■
The redevelopment of a wholly owned temporary car park in Leeds, providing permanent parking space in the context of larger, planned office development (not in forecasts).
For modelling purposes, our forecasts currently assume an increase in debt funding, although asset disposals remain likely and we have made no specific adjustment for the acquisitions and disposal noted above. The Merrion House refinancing has a similar economic impact to the debt that is currently assumed in our forecasts.
Valuation
Although TCS has a strong focus on growing portfolio income to support its long-term progressive dividend policy, its active asset management strategy, aimed at enhancing long-term total return, means it is not focused on yield maximisation over the shorter term. For this reason we think it useful to look at NAV total return performance (the change in NAV per share plus dividends paid), and in the five years ending June 2017 we calculate an aggregate return of 52.7%, or a compound annual return of 8.8% pa. Dividends contributed an aggregate 20% over the period and the growth in NAV per share the balance. The H118 NAV total return was 6.6% over the six-month period.
Exhibit 3: Five-year NAV total return
FY13 |
FY14 |
FY15 |
FY16 |
FY17 |
2013-17 |
|
Opening NAV per share (p) |
270 |
267 |
308 |
344 |
357 |
270 |
Closing NAV per share (p) |
267 |
308 |
344 |
357 |
359 |
359 |
Dividends paid per share (p) |
10.44 |
10.44 |
10.44 |
10.44 |
11.15 |
52.91 |
NAV total return |
2.8% |
19.4% |
15.0% |
6.9% |
3.8% |
52.7% |
Compound annual return |
8.8% |
Source: Company data, Edison Investment Research
Although the continuing investment in and redevelopment of the portfolio is a limiting factor on immediate dividend distributions, TCS has a long and consistent track record of dividend payments, increasing or at least maintaining DPS in each of the past 57 years. Our forecast for the final dividend in respect of the year that ended 30 June 2018 puts the shares on a yield of 4.0%, slightly below the median level for the broad group of property companies and REITs shown in Exhibit 4, but in line with yields on the FTSE All-Share Index and the UK property index.
|
Exhibit 4: Prospective yield comparison |
|
|
Source: Company data, Edison Investment Research, Bloomberg data as at 23 July 2018 |
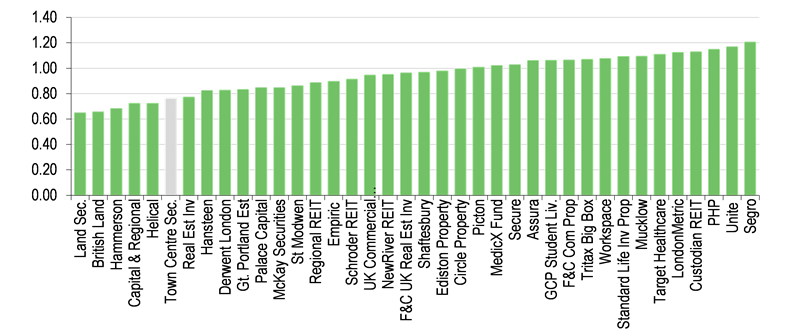
In terms of historic P/NAV, TCS shares sit well below the median which, when viewed in combination with the yield, would suggest that investors are factoring in little capital return potential relative to the broader group, despite TCS having a strong pipeline of development opportunities.
|
Exhibit 5: Historic P/NAV comparison |
|
|
Source: Company data, Edison Investment Research, Bloomberg data as at 23 July 2018 |
The broad group of companies shown in Exhibits 4 and 5 includes a wide variety of property companies, REITs and non-REITs, and specialist vehicles (healthcare property, student accommodation), and covers a wide range of strategies, from a pure focus on income and collecting rents to varying degrees of asset management and capital growth, extending to property development. In Exhibit 6 we show a summary valuation comparison of TCS with what we consider to be a closer group of peers, including companies focused on regional property and those with retail exposure.
Exhibit 6: Peer comparison table
Price (p) |
Market cap. (£m) |
P/NAV |
Yield |
Share price performance |
||||
One |
Three |
12 |
From 12-month high |
|||||
Capital & Regional |
49 |
353 |
0.73 |
7.7 |
-6% |
-5% |
-14% |
-17% |
Circle Property |
230 |
65 |
1.00 |
2.7 |
18% |
47% |
50% |
-10% |
Custodian REIT |
122 |
470 |
1.13 |
5.4 |
0% |
3% |
3% |
-1% |
Hammerson |
533 |
4236 |
0.69 |
4.9 |
1% |
0% |
-10% |
-10% |
Helical |
341 |
404 |
0.73 |
2.8 |
-3% |
-5% |
5% |
-15% |
McKay Securities |
274 |
258 |
0.85 |
3.7 |
4% |
3% |
19% |
-6% |
Mucklow |
556 |
352 |
1.10 |
4.1 |
-2% |
1% |
10% |
-3% |
NewRiver REIT |
279 |
846 |
0.96 |
7.8 |
3% |
-5% |
-20% |
-24% |
Palace Capital |
352 |
161 |
0.85 |
5.5 |
1% |
7% |
-5% |
-10% |
Picton |
91 |
492 |
1.01 |
3.9 |
-2% |
2% |
7% |
-3% |
Real Est Inv |
54 |
100 |
0.78 |
6.7 |
-1% |
-4% |
-11% |
-12% |
Regional REIT |
94 |
351 |
0.89 |
8.5 |
0% |
-5% |
-8% |
-11% |
St Modwen |
408 |
907 |
0.87 |
1.7 |
-4% |
1% |
14% |
-6% |
Schroder REIT |
63 |
325 |
0.92 |
4.0 |
0% |
5% |
-2% |
-4% |
Median |
0.88 |
4.5 |
0% |
1% |
1% |
-10% |
||
Town Centre Sec. |
288 |
153 |
0.77 |
4.0 |
3% |
2% |
-1% |
-9% |
UK property index |
1,824 |
3.9 |
-2% |
0% |
2% |
-3% |
||
FTSE All-Share Index |
4,225 |
4.0 |
0% |
3% |
3% |
-3% |
||
Source: Company data, Edison Investment Research, Bloomberg data as at 23 July 2018. Note: P/NAV is based on last reported NAV (H118 for Town Centre Securities).
The TCS share price performance has been similar to that of this narrower group of peers over the past year. However, in terms of valuation, TCS similarly shows a noticeably lower P/NAV than the median and slightly lower yield. Despite a more diversified portfolio, the TCS P/NAV valuation more closely resemble the retail property focused companies (Capital & Regional, Hammerson), where investor sentiment has been weakened by signs of stress among some retailers, and this again suggests that the TCS valuation is not challenging in a sector context.
Exhibit 7: Financial summary
Year ending 30 June (£000's) |
2015 |
2016 |
2017 |
2018e |
2019e |
2020e |
2021e |
INCOME STATEMENT |
|||||||
Gross revenue |
22,714 |
26,265 |
27,540 |
30,689 |
31,662 |
32,480 |
33,461 |
Total property expenses |
(5,248) |
(7,661) |
(8,148) |
(11,006) |
(11,631) |
(11,904) |
(12,213) |
Net revenue |
17,466 |
18,604 |
19,392 |
19,683 |
20,031 |
20,576 |
21,248 |
Administrative expenses |
(5,321) |
(5,493) |
(6,295) |
(6,618) |
(6,769) |
(6,924) |
(7,083) |
Other income |
1,468 |
599 |
707 |
647 |
400 |
400 |
400 |
Valuation movement on investment properties |
14,791 |
3,018 |
(2,085) |
5,269 |
2,728 |
4,775 |
2,823 |
Reversal of impairment of car parking assets |
0 |
500 |
1,000 |
800 |
0 |
0 |
0 |
Profit on disposal of investment property |
236 |
1,140 |
303 |
1,698 |
500 |
0 |
0 |
Share of post-tax profits from joint venture |
2,621 |
1,400 |
1,342 |
7,041 |
3,675 |
3,175 |
6,775 |
Operating profit |
31,261 |
19,768 |
14,364 |
28,520 |
20,564 |
22,002 |
24,163 |
Net finance costs |
(7,258) |
(7,847) |
(7,639) |
(7,804) |
(8,067) |
(8,413) |
(8,628) |
PBT |
24,003 |
11,921 |
6,725 |
20,716 |
12,498 |
13,589 |
15,534 |
Tax |
0 |
0 |
0 |
0 |
0 |
0 |
0 |
Net profit |
24,003 |
11,921 |
6,725 |
20,716 |
12,498 |
13,589 |
15,534 |
Adjustments to EPRA: |
|||||||
Valuation movement on investment properties |
(14,791) |
(3,018) |
2,085 |
(5,269) |
(2,728) |
(4,775) |
(2,823) |
Reversal of impairment of car parking assets |
(5,013) |
(500) |
(1,000) |
(800) |
0 |
0 |
0 |
Valuation movement on properties held in joint ventures |
0 |
(668) |
(471) |
(6,000) |
(2,000) |
(900) |
(4,000) |
Profit on disposal of investment/development properties |
(236) |
(1,140) |
(303) |
(1,698) |
(500) |
0 |
0 |
(Profit)/Loss on disposal of investment properties held in joint ventures |
2,488 |
0 |
0 |
0 |
0 |
0 |
0 |
EPRA earnings |
6,451 |
6,595 |
7,036 |
6,949 |
7,270 |
7,914 |
8,711 |
Average number of shares (m) |
53.2 |
53.2 |
53.2 |
53.2 |
53.2 |
53.2 |
53.2 |
Basic & fully diluted IFRS EPS (p) |
45.2 |
22.4 |
12.7 |
39.0 |
23.5 |
25.6 |
29.2 |
Basic & fully diluted EPRA EPS |
12.1 |
12.4 |
13.2 |
13.1 |
13.7 |
14.9 |
16.4 |
DPS declared (p) |
10.44 |
11.00 |
11.50 |
11.50 |
12.20 |
12.70 |
13.70 |
BALANCE SHEET |
|||||||
Investment properties |
336,982 |
346,388 |
349,266 |
353,068 |
362,796 |
374,571 |
379,394 |
Investment in joint ventures |
19,344 |
25,093 |
27,852 |
42,306 |
48,406 |
64,306 |
68,306 |
Goodwill |
4,024 |
4,024 |
4,024 |
4,024 |
4,024 |
4,024 |
4,024 |
Other non-current assets |
1,214 |
2,151 |
3,922 |
3,815 |
3,815 |
3,815 |
3,815 |
Total non-current assets |
361,564 |
377,656 |
385,064 |
403,213 |
419,041 |
446,716 |
455,539 |
Investments (listed equities) |
1,962 |
2,070 |
2,394 |
2,542 |
2,542 |
2,542 |
2,542 |
Non-current assets held for sale |
3,450 |
0 |
0 |
0 |
0 |
0 |
0 |
Trade & other receivables |
6,871 |
7,388 |
3,311 |
3,688 |
3,793 |
3,953 |
4,038 |
Cash & equivalents |
1,515 |
0 |
3,124 |
3,714 |
4,427 |
3,055 |
3,063 |
Total current assets |
13,798 |
9,458 |
8,829 |
9,944 |
10,763 |
9,550 |
9,643 |
Total assets |
375,362 |
387,114 |
393,893 |
413,157 |
429,803 |
456,266 |
465,182 |
Trade & other payables |
(11,857) |
(11,496) |
(10,846) |
(12,294) |
(12,644) |
(13,178) |
(13,460) |
Financial liabilities |
(38,668) |
(887) |
0 |
0 |
0 |
0 |
0 |
Total current liabilities |
(50,525) |
(12,383) |
(10,846) |
(12,294) |
(12,644) |
(13,178) |
(13,460) |
Non-current financial liabilities |
(141,959) |
(184,874) |
(191,969) |
(195,034) |
(205,034) |
(223,934) |
(223,934) |
Total liabilities |
(192,484) |
(197,257) |
(202,815) |
(207,328) |
(217,678) |
(237,112) |
(237,394) |
Net assets |
182,878 |
189,857 |
191,078 |
205,830 |
212,125 |
219,154 |
227,788 |
Period end shares in issue (m) |
53.2 |
53.2 |
53.2 |
53.2 |
53.2 |
53.2 |
53.2 |
NAV per share (p) |
344 |
357 |
359 |
387 |
399 |
412 |
428 |
CASH FLOW |
|||||||
Net cash flow from operating activity |
2,191 |
5,656 |
10,108 |
6,367 |
6,740 |
6,913 |
7,034 |
Investment in investment properties |
(37,045) |
(17,014) |
(23,246) |
(2,172) |
(7,000) |
(7,000) |
(2,000) |
Proceeds from disposal of investment property |
26,821 |
16,050 |
21,574 |
7,587 |
500 |
0 |
0 |
Purchase of fixtures, equipment and motor vehicles |
(532) |
(1,496) |
(586) |
(580) |
(900) |
(900) |
(900) |
Proceeds from sale of fixed assets |
0 |
54 |
61 |
0 |
0 |
0 |
0 |
Investments and loans to JV |
0 |
(4,916) |
(4,250) |
(8,294) |
(4,100) |
(15,000) |
0 |
Distributions received from joint ventures |
0 |
567 |
1,031 |
881 |
1,675 |
2,275 |
2,775 |
Proceeds from sale of joint ventures |
0 |
0 |
0 |
0 |
0 |
0 |
0 |
Payment for the acquisition of non-listed investments |
0 |
0 |
(1,950) |
(150) |
0 |
0 |
0 |
Cash flow from investing activity |
(10,756) |
(6,755) |
(7,366) |
(2,728) |
(9,825) |
(20,625) |
(125) |
Proceeds from borrowing |
17,475 |
4,247 |
7,197 |
3,065 |
10,000 |
18,900 |
0 |
Dividends paid |
(5,550) |
(5,550) |
(5,928) |
(6,114) |
(6,202) |
(6,560) |
(6,900) |
Cash flow from financing activity |
11,925 |
(1,303) |
1,269 |
(3,049) |
3,798 |
12,340 |
(6,900) |
Change in cash |
3,360 |
(2,402) |
4,011 |
590 |
713 |
(1,373) |
8 |
Opening cash |
(1,845) |
1,515 |
(887) |
3,124 |
3,714 |
4,427 |
3,055 |
Closing cash |
1,515 |
(887) |
3,124 |
3,714 |
4,427 |
3,055 |
3,063 |
Bank overdraft |
0 |
887 |
0 |
0 |
0 |
0 |
0 |
Cash as per balance sheet |
1,515 |
0 |
3,124 |
3,714 |
4,427 |
3,055 |
3,063 |
Debt |
(176,147) |
(181,281) |
(187,507) |
(190,572) |
(200,572) |
(219,472) |
(219,472) |
Net debt |
(174,632) |
(181,281) |
(184,383) |
(186,858) |
(196,145) |
(216,417) |
(216,409) |
Net LTV |
49.7% |
49.5% |
49.3% |
47.7% |
48.1% |
49.6% |
48.7% |
Source: Company data, Edison Investment Research
|
|
The new management team has a clear focus on improving financial and operational performance across the group and individual business units. H1 results bear testament to a number of challenges faced in the period but also showed signs that actions are beginning to take effect. We have reduced our EPS estimates (by c 20% this year, c 10% in the following two) to reflect more conservative margin assumptions.