Last close As at 05/08/2026
—
— 0.00 (0.00%)
Market capitalisation
—
Research: Real Estate
A confident trading update from Town Centre Securities (TCS) points to a stable financial performance, supported by robust operational metrics, across its increasingly diversified regional commercial property portfolio. Against the backdrop of a challenging retail sector, and the economic and political uncertainty of recent months, we view this positively, justifying the recent share price strength. We make no changes to our forecasts and will review these with the interim results due 26 February.
Town Centre Securities |
Positive trading update |
Trading update |
Real estate |
27 January 2020 |
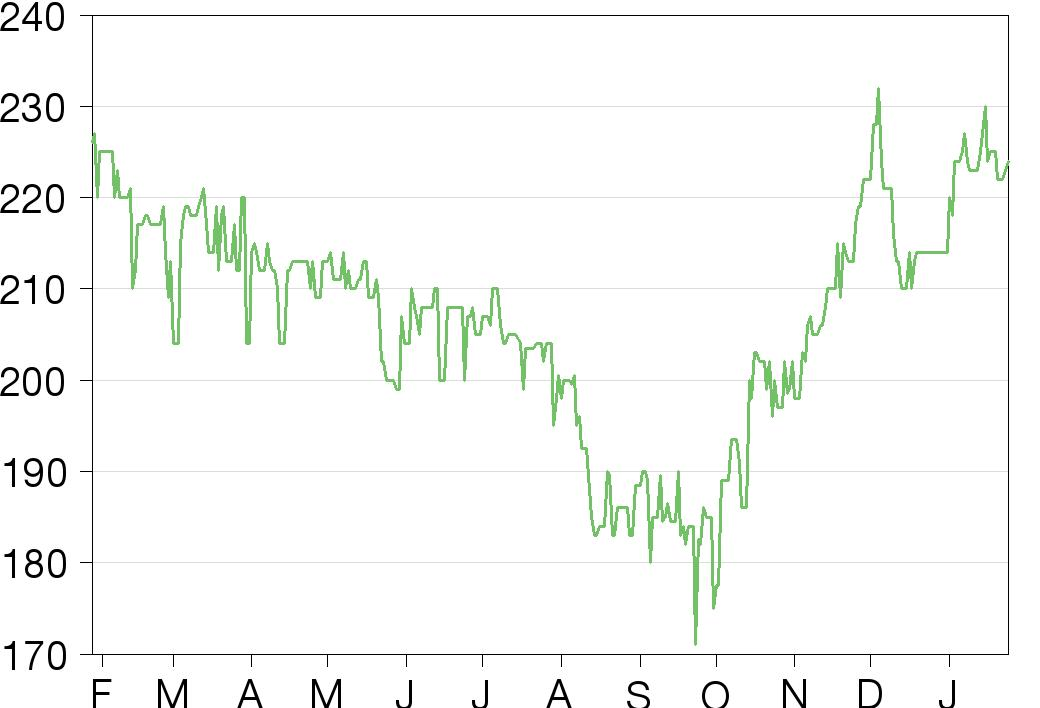
Share price performance
Business description
Next events
Analyst
Town Centre Securities is a research client of Edison Investment Research Limited |
|||||||||||||||||||||||||||||||||||||||||||||||
A confident trading update from Town Centre Securities (TCS) points to a stable financial performance, supported by robust operational metrics, across its increasingly diversified regional commercial property portfolio. Against the backdrop of a challenging retail sector, and the economic and political uncertainty of recent months, we view this positively, justifying the recent share price strength. We make no changes to our forecasts and will review these with the interim results due 26 February.
Year end |
Net revenue (£m) |
EPRA |
EPRA EPS* |
EPRA NAV/ |
DPS |
P/NAV |
Yield |
06/18 |
19.3 |
6.9 |
13.0 |
384 |
11.8 |
0.58 |
5.2 |
06/19 |
19.6 |
6.4 |
12.0 |
354 |
11.8 |
0.63 |
5.2 |
06/20e |
19.4 |
6.0 |
11.4 |
342 |
11.8 |
0.66 |
5.2 |
06/21e |
20.6 |
7.0 |
13.2 |
352 |
11.8 |
0.64 |
5.2 |
Note: *EPRA EPS is adjusted to exclude revaluation movements, disposal gains/(losses) on investment property and exceptional items.
Continuing robust performance…
In H120, a good level of occupancy further increased, while like-for-like passing rent increased 0.4% year-on-year on an underlying basis excluding the impact of significant development projects. With redevelopment of The Cube underway, passing rent is temporarily reduced by £1.2m, partly offset by the £0.6m uplift from fully re-letting Milngavie. Including these development impacts, like-for-like passing rent was 2.8% lower. Reflecting the increasingly diversified regional portfolio and the defensive nature of the remaining retail exposure (less than 50% by value with a lack of big high street names and a focus on discount formats), rent collection remains strong and there was only one additional retail administration (and no new CVAs) in the period. CitiPark continued to grow revenues and earnings. The update appears consistent with our recurring income forecasts and supportive of our capital value assumptions. We expect a robust but lower income performance in FY20 and a rebound in FY21 as developments complete and are re-let.
…supporting repositioning and development
TCS is a family-run business with a strong focus on dividends, increasing or maintaining DPS in each of the last 59 years while recycling capital and actively managing assets for long-term growth. An extensive pipeline of potential development projects with an estimated gross value – once funded and developed – of more than £600m, represents both a significant long-term growth opportunity not captured by stated NAV and a differentiating factor for the group. Borrowing headroom (£26m at end-FY19) and proceeds from further retail divestment is likely to be targeted at development investment and/or acquisitions. Management signals that it is also open to potential accretive share repurchases.
Valuation: Strong dividend commitment
TCS has a strong dividend commitment while continuing to invest for growth and, despite the recent rise in the share price, the yield remains attractively above 5% while the share price discount to NAV per share is more than 30%.
Further details from the trading update
As noted above, we make no changes to our forecasts and will review these when the interim results are published. Those forecasts are set out in detail in our October 2019 update note.
Increased occupancy and underlying rental growth
Portfolio occupancy has improved from an already good level, rising to 96.7% at end-H120 compared with 95.8% at end-FY19. On an underlying basis, excluding the effects of two significant redevelopment projects (Milngavie and The Cube), like-for-like (ie adjusted for acquisitions and disposals) rental growth was 0.4% compared with a year earlier (portfolio passing rent of £20.5m). The re-letting of the retail asset on Main Street at Milngavie, previously occupied by Homebase, subsequently sub-divided and re-let to Aldi and Home Bargains at an 8% higher rent, added c £0.6m pa to passing rent compared with end-H119. Commencement of redevelopment of The Cube, a mixed-use property situated opposite the Merrion Centre in Leeds acquired in October 2018 for £12m, has temporarily reduced annualised passing rent by £1.2m. Including these two properties, like-for-like passing rent was 2.8% lower year-on-year. Our forecasts allow for the additional income from Milngavie, which had already been re-let by year-end FY19, and the temporary loss of income from The Cube. We forecast a rebound in income in FY21 as redevelopment of The Cube completes and the vacant space is re-let.
Little additional impact from retail sector stress
Although not immune to the pressures on the high street and the increase in company voluntary arrangements (CVAs), TCS has continued to demonstrate a resilience that is based on:
■
A focus on food retailers and discount formats, and a lack of exposure to department stores or the big-name high street retailers and fashion stores.
■
The location and positioning of the Merrion Centre in Leeds, TCS’s largest asset, accounting for around half of the retail portfolio value. With £70m invested over the past 10 years, the asset has become a truly mixed-use destination, well situated adjacent to the First Direct Arena entertainments facility. Around 50% of Merrion Centre rents are retail and leisure, of which c 50% is derived from the supermarket let to Morrisons. Most of the remaining retail tenants operate in the more resilient discount and convenience segments, well suited to the needs of a large and fast-growing student population within the Arena quarter of Leeds. Footfall at the Merrion Centre was marginally up in the 12 months to end-H120 compared with the prior 12-month period, with a good end to the year; footfall in the last 10 weeks of the year was ahead by 6.7% compared with the prior year period.
This resilience of the retail assets was demonstrated in FY19 when TCS was able to significantly mitigate the impact of eight tenant administrations/CVAs through active asset management. Four of the properties affected in FY19 were re-let during the year to new tenants with rent levels at least being maintained, while in the case of three of the properties the incumbent tenant chose to remain at the same rent. The final property was in the process of being re-let at end-FY19. As noted above, H120 has seen just one new tenant administration and no further CVAs. The administration related to a small leisure unit in Leeds with annual rent of £125,000.
Portfolio repositioning continuing
TCS has an increasingly diverse, mixed-use and regionally focused portfolio, with an emphasis on Leeds and Manchester, which together represented 77% of the portfolio by value at end-FY19.
Retail and leisure remains the single largest sector weight in the portfolio, but has been actively reduced to below 50% from 55% at end-FY18 and 70% at end-FY16. Pure retail exposure is lower still, 36% at end-FY19. As retail has been reduced, offices, hotels and private rented sector (PRS) residential assets have increased share are likely to do so.
Exhibit 1: End-FY19 portfolio summary
Passing rent (£m) |
ERV |
ERV |
Value |
Value |
Initial |
Reversionary yield (%) |
|
Retail & Leisure |
3.7 |
4.2 |
15 |
62.7 |
16 |
5.6% |
6.3% |
Merrion Centre (exc office) |
7.1 |
7.8 |
28 |
92.5 |
23 |
7.3% |
7.9% |
Offices |
5.5 |
6.0 |
22 |
80.4 |
20 |
6.5% |
7.1% |
Hotel |
1.2 |
1.6 |
6 |
25.8 |
7 |
4.3% |
6.0% |
Out-of-town retail |
1.8 |
2.5 |
9 |
41.8 |
11 |
4.0% |
5.6% |
Distribution |
0.4 |
0.4 |
1 |
6.1 |
2 |
6.3% |
6.6% |
Residential |
1.2 |
1.3 |
5 |
21.8 |
6 |
5.1% |
5.7% |
Total investment properties |
20.9 |
23.8 |
87 |
331.0 |
84 |
6.0% |
6.8% |
Development property (car park income) |
2.1 |
2.1 |
8 |
36.5 |
9 |
||
Car parks |
1.5 |
1.5 |
5 |
26.7 |
7 |
||
Total portfolio |
24.5 |
27.4 |
100 |
394.2 |
100 |
Source: Town Centre Securities, 30 June 2019
During H120, TCS exchanged contracts (in December) to sell a retail unit in Shandwick Place in Edinburgh, completing in January 2020. The 6,000 sq ft unit was empty but let for a remaining eight years to Morrisons, and was been sold for £2m. The sale price represents a 5% uplift on the valuation and a yield of 7%. Management continues to explore opportunities to dispose of further retail assets, but is not a forced seller and says that it will only do so on terms that it finds acceptable. The proceeds from further retail divestment are likely to be targeted at further investment in the development pipeline and/or acquisitions. TCS is currently continuing to invest in assets in Leeds and Manchester including existing asset redevelopment projects at The Cube in Leeds and Ducie House in Manchester, and is about to commence stage four design work for the George St JV development with Leeds City Council, expecting construction work to commence in the next six months. In the context of the broader sector, among the factors that should continue to support the shares and represent potential catalysts for a further relative re-rating are the attractive yield, with a strong management commitment to dividends and an alignment of interest between management and shareholders. Additionally, we note TCS’s focus on better performing regional markets (Leeds and Manchester) and its increasingly diversified portfolio. Longer-term growth is supported by the company’s significant pipeline of development opportunities.
Valuation has improved but upside potential remains
In Exhibit 2 we show a summary valuation comparison of TCS with what we consider to be a group of peers from within the broad property sector, including companies focused on regional property and those with retail exposure. Starting from a low valuation, TCS shares have performed strongly in recent months, but still offer an attractive dividend yield of more than 5% with a discount to last published NAV of more than 30%. TCS appears to have successfully decoupled from the purer retail peers and has begun to more closely track the more diversified regional property peers.
Exhibit 2: Peer comparison
Price |
Market cap |
P/NAV* |
Yield** |
Share price performance |
||||
1 month |
3 months |
12 months |
From 12M high |
|||||
Capital & Regional |
237 |
247 |
0.55 |
6.7 |
-4% |
-10% |
-14% |
-29% |
Custodian |
115 |
476 |
1.11 |
5.7 |
1% |
0% |
1% |
-4% |
Hammerson |
256 |
1962 |
0.37 |
10.1 |
-18% |
-16% |
-28% |
-35% |
Helical |
500 |
599 |
1.03 |
2.0 |
5% |
30% |
54% |
0% |
Intu |
19 |
255 |
0.08 |
0.0 |
-43% |
-59% |
-83% |
-85% |
McKay Securities |
271 |
255 |
0.81 |
3.8 |
-4% |
15% |
5% |
-5% |
NewRiver |
190 |
583 |
0.78 |
11.3 |
-7% |
-8% |
-11% |
-23% |
Palace Capital |
326 |
150 |
0.83 |
5.8 |
0% |
14% |
8% |
-6% |
Picton |
100 |
550 |
1.07 |
3.5 |
4% |
8% |
18% |
-7% |
Real Estate Investors |
55 |
103 |
0.80 |
6.8 |
2% |
1% |
7% |
-5% |
Regional REIT |
115 |
496 |
1.01 |
7.1 |
1% |
9% |
17% |
-1% |
St Modwen |
494 |
1097 |
1.00 |
1.5 |
-3% |
11% |
19% |
-5% |
Schroder REIT |
54 |
281 |
0.79 |
4.8 |
-4% |
-5% |
-1% |
-9% |
Average |
0.79 |
5.3 |
-6% |
-1% |
-1% |
-16% |
||
Town Centre Securities |
224 |
119 |
0.62 |
5.2 |
1% |
14% |
-3% |
-4% |
UK property index |
1,924 |
3.5 |
-1% |
6% |
17% |
-2% |
||
FTSE All-Share Index |
4,151 |
4.5 |
-2% |
3% |
11% |
-3% |
||
Source: Company data, Edison Investment Research. Note: *Based on last reported EPRA NAV. **Based on trailing 12-month DPS declared. Prices as at 27 January 2020.
Exhibit 3: Financial summary
Year ending 30 June (£000's) |
2015 |
2016 |
2017 |
2018 |
2019 |
2020e |
2021e |
2022e |
INCOME STATEMENT |
||||||||
Gross revenue |
22,714 |
26,265 |
27,540 |
30,178 |
31,189 |
30,885 |
32,382 |
32,610 |
Total property expenses |
(5,248) |
(7,661) |
(8,148) |
(10,896) |
(11,600) |
(11,441) |
(11,762) |
(12,188) |
Net revenue |
17,466 |
18,604 |
19,392 |
19,282 |
19,589 |
19,443 |
20,620 |
20,423 |
Administrative expenses |
(5,321) |
(5,493) |
(6,295) |
(6,574) |
(6,857) |
(6,766) |
(6,940) |
(7,148) |
Other income |
1,468 |
599 |
707 |
888 |
574 |
400 |
400 |
400 |
Valuation movement on investment properties |
14,791 |
3,018 |
(2,085) |
5,932 |
(18,308) |
(6,402) |
0 |
0 |
Reversal of impairment of car parking assets |
0 |
500 |
1,000 |
1,300 |
200 |
0 |
0 |
0 |
Profit on disposal of investment property |
236 |
1,140 |
303 |
1,677 |
(709) |
0 |
0 |
0 |
Share of post tax profits from joint venture |
2,621 |
1,400 |
1,342 |
3,757 |
1,067 |
1,034 |
6,084 |
2,403 |
Operating profit |
31,261 |
19,768 |
14,364 |
26,262 |
(4,444) |
7,709 |
20,164 |
16,077 |
Net finance costs |
(7,258) |
(7,847) |
(7,639) |
(7,887) |
(8,025) |
(8,063) |
(8,400) |
(8,527) |
PBT |
24,003 |
11,921 |
6,725 |
18,375 |
(12,469) |
(354) |
11,764 |
7,550 |
Tax |
0 |
0 |
0 |
0 |
0 |
0 |
0 |
0 |
Net profit |
24,003 |
11,921 |
6,725 |
18,375 |
(12,469) |
(354) |
11,764 |
7,550 |
Adjustments to EPRA: |
||||||||
Valuation movement on investment properties |
(14,791) |
(3,018) |
2,085 |
(5,932) |
18,308 |
6,402 |
0 |
0 |
Reversal of impairment of car parking assets |
(5,013) |
(500) |
(1,000) |
(1,300) |
(200) |
0 |
0 |
0 |
Valuation movement on properties held in joint ventures |
0 |
(668) |
(471) |
(2,561) |
8 |
0 |
(4,750) |
0 |
Profit on disposal of investment/development properties |
(236) |
(1,140) |
(303) |
(1,677) |
709 |
0 |
0 |
0 |
(Profit)/Loss on disposal of investment properties held in joint ventures |
2,488 |
0 |
0 |
0 |
0 |
0 |
0 |
0 |
EPRA earnings |
6,451 |
6,595 |
7,036 |
6,905 |
6,356 |
6,048 |
7,014 |
7,550 |
Average number of shares (m) |
53.2 |
53.2 |
53.2 |
53.2 |
53.2 |
53.2 |
53.2 |
53.2 |
Basic & fully diluted IFRS EPS (p) |
45.2 |
22.4 |
12.7 |
34.6 |
(23.4) |
(.7) |
22.1 |
14.2 |
Basic & fully diluted EPRA EPS (p) |
12.1 |
12.4 |
13.2 |
13.0 |
12.0 |
11.4 |
13.2 |
14.2 |
DPS declared (p) |
10.44 |
11.00 |
11.50 |
11.75 |
11.75 |
11.75 |
11.75 |
11.75 |
BALANCE SHEET |
||||||||
Investment properties |
336,982 |
346,388 |
349,266 |
359,734 |
348,694 |
348,292 |
350,292 |
352,292 |
Investment in joint ventures |
19,344 |
25,093 |
27,852 |
39,742 |
13,387 |
23,575 |
37,762 |
37,762 |
Goodwill |
4,024 |
4,024 |
4,024 |
4,024 |
4,024 |
4,024 |
4,024 |
4,024 |
Other non-current assets |
1,214 |
2,151 |
3,922 |
3,669 |
4,119 |
4,119 |
4,119 |
4,119 |
Total non-current assets |
361,564 |
377,656 |
385,064 |
407,169 |
370,224 |
380,009 |
396,197 |
398,197 |
Investments (listed equities) |
1,962 |
2,070 |
2,394 |
3,530 |
5,871 |
5,871 |
5,871 |
5,871 |
Non-current assets held for sale |
3,450 |
0 |
0 |
0 |
0 |
0 |
0 |
0 |
Trade & other receivables |
6,871 |
7,388 |
3,311 |
6,288 |
5,354 |
3,795 |
3,911 |
3,925 |
Cash & equivalents |
1,515 |
0 |
3,124 |
23,149 |
23,692 |
30,259 |
24,859 |
24,197 |
Total current assets |
13,798 |
9,458 |
8,829 |
32,967 |
34,917 |
39,924 |
34,641 |
33,993 |
Total assets |
375,362 |
387,114 |
393,893 |
440,136 |
405,141 |
419,934 |
430,837 |
432,189 |
Trade & other payables |
(11,857) |
(11,496) |
(10,846) |
(37,954) |
(34,739) |
(36,132) |
(36,518) |
(36,567) |
Financial liabilities |
(38,668) |
(887) |
0 |
0 |
0 |
0 |
0 |
0 |
Total current liabilities |
(50,525) |
(12,383) |
(10,846) |
(37,954) |
(34,739) |
(36,132) |
(36,518) |
(36,567) |
Non-current financial liabilities |
(141,959) |
(184,874) |
(191,969) |
(198,057) |
(182,152) |
(202,152) |
(207,152) |
(207,152) |
Total liabilities |
(192,484) |
(197,257) |
(202,815) |
(236,011) |
(216,891) |
(238,284) |
(243,670) |
(243,719) |
Net assets |
182,878 |
189,857 |
191,078 |
204,125 |
188,250 |
181,649 |
187,167 |
188,470 |
Period end shares in issue (m) |
53.2 |
53.2 |
53.2 |
53.2 |
53.2 |
53.2 |
53.2 |
53.2 |
NAV per share (p) |
344 |
357 |
359 |
384 |
354 |
342 |
352 |
355 |
CASH FLOW |
||||||||
Net cash flow from operating activity |
2,191 |
5,656 |
10,108 |
6,348 |
3,412 |
8,867 |
6,850 |
6,081 |
Investment in investment properties |
(37,045) |
(17,014) |
(23,246) |
(2,859) |
(29,512) |
(6,000) |
(2,000) |
(2,000) |
Proceeds from disposal of investment property |
26,821 |
16,050 |
21,574 |
7,534 |
17,089 |
0 |
0 |
0 |
Purchase of fixtures, equipment and motor vehicles |
(532) |
(1,496) |
(586) |
(340) |
(814) |
(900) |
(900) |
(900) |
Proceeds from sale of fixed assets |
0 |
54 |
61 |
0 |
23 |
0 |
0 |
0 |
Investments and loans to JV |
0 |
(4,916) |
(4,250) |
(8,809) |
(723) |
(10,188) |
(9,438) |
0 |
Distributions received from joint ventures |
0 |
567 |
1,031 |
676 |
28,145 |
1,034 |
1,334 |
2,403 |
Proceeds from sale of joint ventures |
0 |
0 |
0 |
0 |
0 |
0 |
0 |
0 |
Payment for the acquisition of non-listed investments |
0 |
0 |
(1,950) |
(175) |
(385) |
0 |
0 |
0 |
Cash flow from investing activity |
(10,756) |
(6,755) |
(7,366) |
(3,973) |
13,823 |
(16,053) |
(11,003) |
(497) |
Proceeds from borrowing |
17,475 |
4,247 |
7,197 |
6,088 |
(16,252) |
20,000 |
5,000 |
0 |
Dividends paid |
(5,550) |
(5,550) |
(5,928) |
(6,114) |
(6,247) |
(6,247) |
(6,247) |
(6,247) |
Cash flow from financing activity |
11,925 |
(1,303) |
1,269 |
(26) |
(22,499) |
13,753 |
(1,247) |
(6,247) |
Change in cash |
3,360 |
(2,402) |
4,011 |
2,349 |
(5,264) |
6,567 |
(5,400) |
(662) |
Opening cash |
(1,845) |
1,515 |
(887) |
3,124 |
5,473 |
209 |
6,776 |
1,376 |
Closing cash |
1,515 |
(887) |
3,124 |
5,473 |
209 |
6,776 |
1,376 |
714 |
Balance cash netting adjustment* |
0 |
887 |
0 |
17,676 |
23,483 |
23,483 |
23,483 |
23,483 |
Cash as per balance sheet |
1,515 |
0 |
3,124 |
23,149 |
23,692 |
30,259 |
24,859 |
24,197 |
Financial liabilities (including finance leases) |
(180,627) |
(185,761) |
(191,969) |
(198,057) |
(182,152) |
(202,152) |
(207,152) |
(207,152) |
Net debt |
(179,112) |
(185,761) |
(188,845) |
(192,584) |
(181,943) |
(195,376) |
(205,776) |
(206,438) |
Net LTV |
49.7% |
49.5% |
49.3% |
47.5% |
49.4% |
51.6% |
52.1% |
52.1% |
Source: Town Centre Securities data, Edison Investment Research forecasts
|
|
Research: Healthcare
Today’s 2019 business and trading update highlights a landmark year for Shield Therapeutics. Feraccru/Accrufer (oral ferric maltol) is making inroads in Europe, with sales volumes growing 67% through commercialisation partner, Norgine. Importantly, the AEGIS head-to-head study proved Feraccru/Accrufer to be non-inferior to IV iron therapy, a strong marketing tool for an oral treatment. In July 2019, the FDA approved the product for the treatment of iron deficiency in patients with any underlying cause – the broadest possible label. Momentum has continued into 2020 with an out-licensing deal with China-based Beijing Aosaikang Pharmaceutical (ASK Pharm) that covers China, Hong Kong, Macau and Taiwan. The next key inflection point is a US partnering deal, which we assume will occur in the next 12 months. We value Shield at £345m.