Last close As at 05/08/2026
—
— 0.00 (0.00%)
Market capitalisation
—
Research: Real Estate
The results for the year ended 31 March 2021 (FY21) provided the detail on Civitas Social Housing’s resilient performance through the pandemic. The portfolio continued to perform in line with expectations, operationally and financially, delivering consistent positive returns. With rents indexed to inflation and gearing in place to fund accretive portfolio acquisitions, we forecast further consistent growth in earnings and DPS.
Civitas Social Housing |
Positive outcomes drive consistent returns |
Post-FY21 outlook |
Real estate |
21 July 2021 |
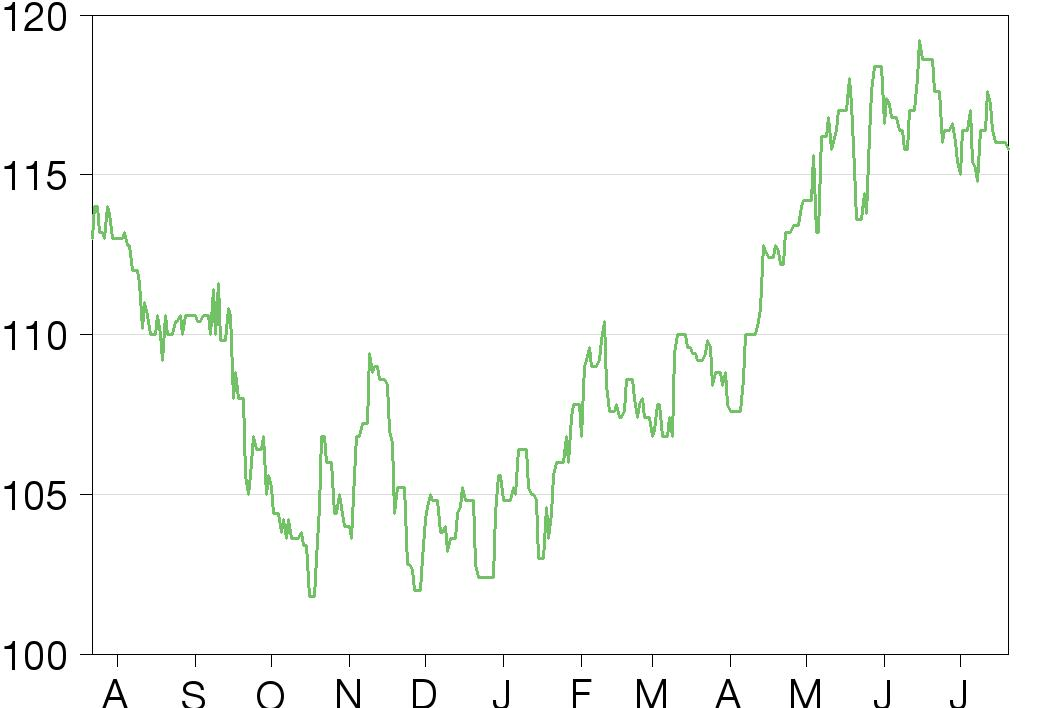
Share price performance
Business description
Next events
Analyst
Civitas Social Housing is a research client of Edison Investment Research Limited |
|||||||||||||||||||||||||||||||||||||||||||||||
The results for the year ended 31 March 2021 (FY21) provided the detail on Civitas Social Housing’s resilient performance through the pandemic. The portfolio continued to perform in line with expectations, operationally and financially, delivering consistent positive returns. With rents indexed to inflation and gearing in place to fund accretive portfolio acquisitions, we forecast further consistent growth in earnings and DPS.
Year end |
Net rental income (£m) |
EPRA |
EPRA |
EPRA NTA/ share* (p) |
DPS |
P/NAV |
Yield |
03/20 |
45.9 |
28.8 |
4.6 |
107.9 |
5.30 |
1.07 |
4.6 |
03/21 |
47.8 |
30.6 |
4.9 |
108.4 |
5.40 |
1.07 |
4.7 |
03/22e |
54.0 |
34.3 |
5.5 |
109.8 |
5.55 |
1.06 |
4.8 |
03/23e |
56.6 |
36.7 |
5.9 |
112.4 |
5.68 |
1.03 |
4.9 |
Note: *EPRA earnings and NAV are fully diluted.
Consistently meeting expectations
Earnings growth since IPO has been driven by acquisitions, bringing much-needed private capital to the social housing sector, inflation-indexed rent increases, economies of scale. Continuing the trend, FY21 EPRA earnings and EPRA EPS grew c 6% and, with rents collected in full, underlying operational cash flow grew c 10%. In each year since IPO in 2016, DPS has increased (the company targets a 2.8% increase to 5.55p for FY22) and NAV total return has been positive (FY21: 5.4%). This consistency reflects the contribution of the properties to the provision of an essential service, secured by long-term lease and care arrangements, providing good visibility of income with little correlation to the wider property market or economy, capable of delivering stable inflation-indexed dividend growth. We forecast continuing growth in earnings and DPS, including £50m of further acquisitions as the £85m proceeds of the M&G debt facility, agreed in February and fully drawn by end-FY21, are fully deployed.
Funding in place for diversified growth
During the pandemic, the healthcare and housing sectors in which Civitas operates have proved to be operationally resilient and demand has remained strong. The company has a strong pipeline of potential investment opportunities (amounting to more than £200m), much of which is under active discussion. This includes opportunities within the existing core of specialised social housing (SSH) provision and also advanced homelessness, as part of its planned diversification, meeting a wider range of care-based accommodation needs with a broader base of lessees. Our assumed acquisitions are just a part of this opportunity; additional capital, both equity and debt (utilising the strong investment grade credit rating to target longer-term, attractively priced debt) would enable further investment while offering scale and diversification benefits.
Valuation: Stable income and attractive yield
The shares offer an attractive c 4.8% FY22 prospective yield and trade at around EPRA NAV. Dividends are backed by stable income, uncorrelated with the wider economy, with good inflation-linked growth prospects.
Investment summary
Positive outcomes drive consistent returns
Throughout the pandemic, Civitas has demonstrated its ability to deliver consistent and attractive financial returns for its shareholders while continuing to deliver a strong positive social return, providing much needed private investment capital to support the delivery of care-based community housing for some of the most vulnerable in society. From IPO in November 2016 to 31 March 2021 (end-FY21) Civitas has generated an aggregate net asset value (NAV) total return of 29.6% or an annual average 6.1%. Dividends have increased each year since IPO and represent two-thirds of the total return in the period. This strong performance reflects the vital role of portfolio properties in the provision of an essential service, secured by long-term lease and care arrangements, creating good visibility of income with little direct correlation to the wider property market or economy, capable of delivering stable inflation-indexed dividend growth.
Financials: Growth embedded in the current portfolio
Earnings growth since IPO has been driven by acquisitions, rent increases indexed to CPI inflation and economies of scale reflected in a steadily reducing EPRA cost ratio. We expect this trend to continue and is reflected in our FY22 and FY23 forecasts. In addition to the £22.0m of committed investment announced in Q122 we assume £50m (before costs) of additional commitment as the company continues to deploy the c £85m proceeds of the M&G debt facility. This represents just a part of Civitas’s substantial pipeline of investment opportunities, amounting to over £200m, of which a significant part is under active discussion. Taking full advantage of what we believe to be an accretive further opportunity will require additional capital, both equity and debt.
Stable income, attractive yield and measurable impact
The targeted 5.55p aggregate FY22 DPS represents a prospective yield of 4.8%, supporting the c 7% premium to end-FY21 net assets per share, with good prospects for inflation-linked dividend growth. Compared with its closest peers (Exhibit 16), investors in social housing and healthcare, Civitas shares trade at a similar yield to the average and lower P/NAV. With performance during the pandemic demonstrating the resilience of the sector and the business model, we consider that Civitas offers an attractive yield while also delivering a material social benefit. The latest social impact report prepared by The Good Economy estimates that Civitas’s portfolio generated a total social value of £127.0m during FY21, including £75.9m of fiscal savings for public budgets and £51.2m in respect of social impact through improved outcomes for residents.
Sensitivities
Long, inflation-linked leases provide considerable visibility of contractual rent income, while the rents of those living in homes that meet the criteria for SSH are funded by central government and paid via local authorities directly to the housing providers that lease the properties from Civitas and manage them. SSH is an essential service and demand is not directly linked to the economy; as a result, the asset class is little correlated with the broader residential and commercial property sectors. On page 15 we identify the key sensitivities to the company outlook as:
■
The ability of lessees to meet their long-term, indexed lease obligations to Civitas. In response to regulatory scrutiny the sector is generally showing increased financial strength and improved operational management and governance.
■
Changes in the funding structure. With cross-party support for SSH, widely recognised as offering value for money and positive outcomes, we can foresee no immediate threat.
A leading investor in care-based community housing
Civitas invests across the UK in care-based community housing and healthcare facilities for the benefit of working aged adults with long-term care needs. It is externally managed by Civitas Investment Managers (CIM), whose growing team brings significant direct experience in social housing, healthcare and fund management. Civitas shares are a constituent of the FTSE EPRA NAREIT Global Real Estate Index.
Civitas aims to deliver positive financial returns for investors by targeting assets that benefit from inflation-adjusted, long-term leases, with a low historical correlation to the general economy, or residential or commercial property. It also delivers a measurable positive social return, providing much needed private investment capital to approved providers0F1 so that they may provide and manage additional, care-based quality accommodation to some of the most vulnerable in society, improving tenant life outcomes in a cost-effective manner.
This may include housing associations, local authorities, charities and other not-for-profit organisations. Civitas homes are leased to approved providers, who manage the properties and make them available to ‘care providers’, contracted by local authorities to provide care services for residents within the homes. In some cases, the care provider may also provide and manage the property although local authorities have increasingly shown a preference for separate property and care providers.
Since the company’s IPO in November 2016 portfolio growth has been focused on SSH for vulnerable adults with complex care needs. A broader investment remit in place since May 2020 will see future investment additionally targeted at a wider range of lease counterparties, meeting a broader range of care-based needs, including homelessness, addiction, and NHS step-down. In all cases, Civitas acquires the properties and leases them to housing providers to manage.
|
Exhibit 1: Increasing provision of care-based homes |
Exhibit 2: Growth generating scale efficiencies |
|
|
|
Source: Civitas Social Housing data |
|
Exhibit 1: Increasing provision of care-based homes |
|
|
Source: Civitas Social Housing data |
|
Exhibit 2: Growth generating scale efficiencies |
|
|
Source: Civitas Social Housing data |
There is a chronic shortage of all forms of social housing including SSH, and it is widely expected that the demand will continue to increase 1F2, driven by greater penetration of the existing population in need and the further growth of that population, primarily driven by improved post-natal care and increased life expectancy. At both the national and local level it is government policy to offer SSH to more people. In part, this reflects the value for money that it provides compared with the alternatives of residential care or long-stay hospitals, a consideration that is not simply cost related, but also recognises the enhancement to quality of life that SSH can provide. Nonetheless, recent data from Mencap point to the fact that around half of individuals with long-term care needs live with elderly parents and will increasingly be in need of alternative support; that more than 3,000 individuals with a learning disability are currently placed in inpatient units, often far away from family; and that 82% of local authorities have a shortage of suitable housing for adults with a learning disability. For investors requiring more information regarding the SSH market, our detailed initiation note can be found here.
In a December 2015 research paper (Supported housing: Understanding need and supply), the National Housing Federation estimated a then shortfall of c 16,000 homes, with an expectation that this would increase to c 29,000 by 2019/20 and to c 47,000 by 2024/25. The Mencap-commissioned research estimated the total number of SSH units at 22,000–30,000, with an expectation that the demand will increase to 25,500–33,500 units by 2021/22 and 29,000–37,000 units by 2027/28.
Up to 31 March 2021 (end-FY21) Civitas had deployed £803m of capital, at an average purchase yield of 5.84%, into a portfolio of 619 properties that were independently valued at £916m, reflecting a net initial yield of 5.24%. The properties were let to 16 different approved providers on long leases (a WAULT2F3 of 22.6 years), providing homes for almost 4,300 individuals, receiving an average 43 hours per week of care from 118 different care providers. Around a third of the homes acquired by Civitas have been homes brought into the sector for the first time, adding much needed new capacity, and with growth, Civitas has achieved economies of scale, reflected in a steadily declining EPRA cost ratio. We forecast the cost ratio to decline further as available capital is deployed.
Weighted average unexpired lease term.
Consistent, income-driven returns
Civitas has consistently delivered positive total returns3F4 each quarter since IPO. With operational and financial resilience continuing during the pandemic, rents have continued to be received in full, quarterly dividend payments have been uninterrupted, and there has been no discernible impact on portfolio valuations. This strong performance reflects the vital role of portfolio properties in the provision of an essential service; secured by long-term lease and care arrangements; providing good visibility of income with little direct correlation to the wider property market or economy; and capable of delivering stable inflation-indexed dividend growth. The impact of COVID-19 infection has been low within homes, reflecting the relatively low average age of residents (an average of 32 years), less likely to suffer from the types of underlying health conditions categorised as ‘high risk’ by the NHS, and the configuration of much of the modern housing stock, around self-contained apartments and small housing clusters, which supports infection control and management. Further insulating the approved provider lessees from the pandemic impact, the care provider generally takes responsibility for voids (unoccupied units) and pays for all of the personal healthcare equipment required by residents, for which it is paid by local authorities.
Change in IFRS NAV per share during the period with dividends paid added back (but not assuming reinvestment of dividends).
From IPO in November 2016 to 31 March 2021 (end-FY21) Civitas has generated an aggregate NAV total return of 29.6% or an annual average 6.1%. Dividends have increased each year since IPO and represent two-thirds of the total return in the period. The slight slowdown in FY21 total return (5.4%) primarily reflects the relative pause in portfolio growth, partly due to the pandemic but also the time taken to put in place additional long-term borrowing facilities.
Exhibit 3: Annual total return analysis
FY18 |
FY19 |
FY20 |
FY21 |
From IPO to end-FY21 |
|
Opening NAV per share (p) |
98.0 |
105.5 |
107.1 |
107.9 |
98.0 |
Closing NAV per share (p) |
105.5 |
107.1 |
107.9 |
108.3 |
108.3 |
Dividends paid (p) |
3.0 |
5.0 |
5.3 |
5.4 |
18.7 |
NAV total return |
7.9% |
6.2% |
5.7% |
5.4% |
29.6% |
Annualised total return |
6.1% |
Source: Civitas Social Housing data, Edison Investment Research
Authentic ‘impact investor’ with broader focus on ESG
Alongside the financial results Civitas published the latest, and fourth, independent social impact report on the company, prepared by the specialist social impact consultancy, The Good Economy. The report confirms that Civitas continues to be an authentic ‘impact investor’ in accordance with the International Finance Corporation (IFC) operating principles4F5 and is proactive in its approach to asset management, taking well defined steps to improve the quality of existing homes, especially in terms of improving environmental performance. It estimates that Civitas’s portfolio generated a total social value of £127.0m during FY21, including £75.9m of fiscal savings for public budgets and £51.2m in respect of social impact through improved outcomes for residents, and that Civitas generates £3.51 of social value is created for every £1 of annual investment.
Impact investing aims to generate a measurable, beneficial social or environmental impact alongside a financial return. The IFC is a member of the World Bank Group and its operating principles set a market standard for impact measurement, management and reporting.
The fiscal savings arise from the lower cost associated with SSH compared with the alternatives of residential care or long-stay hospitals. Mencap-commissioned research (Funding supported housing for all, April 2018), estimated the average rent cost of SSH accommodation (including the service charges) at £232 per week within an overall average weekly cost of SSH (including the cost of the care package at an average £1,337 per week) at £1,569. This compared with its estimate of the average cost of registered care (residential care) at £1,760 per week or £3,500 per week for in-patient hospital care. Its findings are consistent with National Housing Federation data, which estimated the annual saving resulting from SSH for people with learning difficulties and mental disabilities at £15,500 or c £300 per week.
As part of its broader environment, social, and governance (ESG) focus, Civitas has set the goal of becoming carbon neutral across its portfolio by 2030, although the timing of this being achieved partly depends on developments in the availability of government grants. The company recently entered into a national framework agreement with E.ON, one of the UK’s leading energy providers, to undertake environmental enhancements aimed at improving energy efficiency and reducing carbon emissions across the portfolio. The initial focus will be on 55 properties within the portfolio that have lower EPC ratings, building on successful pilot projects that Civitas and E.ON have already undertaken, including the installation of solar panels and air source heat pumps.
Managed by Civitas Investment Management
Overall management and supervision of Civitas is provided by the independent board, consisting of five non-executive directors. The chairman is Michael Wrobel who, with more than 30 years of experience in the investment industry, has held senior positions in the investment management industry, has served as a director of various investment trusts, is a pension fund trustee and a former director of the Association of Investment Companies. The other directors are Alastair Moss, Peter Baxter, Caroline Gulliver and Alison Hadden, who collectively bring extensive experience in areas such as property law, investment management, accountancy, local government, social housing and charities and listed investment company boards. Detailed biographies can be found on the company’s website.
The external investment adviser is CIM, an impact investor focused on community-based assets that can deliver sustainable returns and positive social outcomes. CIM is led by its founder directors and brings to Civitas a growing, specialised team with significant experience and a proven track record in social housing, healthcare and fund management. In our view, CIM’s industry knowledge and relationships are important factors, not only in managing the Civitas portfolio but also in sourcing investments, particularly in less competitive off-market transactions. During the past year CIM has recruited additional experienced staff to provide a detailed control framework for the Civitas portfolio and to provide additional oversight and direction of third-party property management providers. It is also investing in new web-based asset management and billing systems.
Advisery fees are calculated quarterly, based on net assets, with a tiered structure under which the marginal advisery fee reduces with increasing net assets. This increases the potential for scale economies and increases the attractiveness of asset growth for shareholders. There are no other transaction fees or performance fees.
Exhibit 4: Investment advisery fee schedule
Net assets |
Marginal fee rate per annum (%) |
Up to an including £250m |
1.0 |
£250m to £500m |
0.9 |
£500m to £1,000m |
0.8 |
Above £1,000m |
0.7 |
Source: Civitas Social Housing
Portfolio and growth opportunities
Exhibit 5 provides a summary of the Civitas portfolio at end-FY21 and shows its development since IPO. Civitas only invests in completed properties and does not engage in development or the forward funding of developments. Properties have mostly been acquired from selected developers and from care providers, including many with which Civitas has built strategic relationships.
Exhibit 5: Portfolio summary and development
FY18 |
FY19 |
FY20 |
FY21 |
|
31-Mar-18 |
31-Mar-19 |
31-Mar-20 |
31-Mar-21 |
|
Investment (£m) |
472 |
758 |
789 |
803 |
Portfolio valuation (£m) |
517 |
827 |
879 |
916 |
Properties |
414 |
591 |
613 |
619 |
Tenancies |
2,621 |
4,072 |
4,216 |
4,295 |
Local authorities |
109 |
157 |
164 |
164 |
Housing Associations |
11 |
15 |
15 |
16 |
Care providers |
64 |
113 |
117 |
116 |
WAULT (years) |
24.1 |
24.1 |
23.7 |
22.6 |
Source: Civitas Social Housing data
Acquisition activity during the past year was relatively low compared with previous years, in part due to the pandemic but primarily reflecting the time taken to arrange additional debt financing. During FY21, six properties were acquired, providing 79 homes, for an aggregate cost of c £15m (before acquisition costs). This included two high-acuity, purpose-built facilities in Wales.
As Civitas has begun to deploy the proceeds from the c £85m M&G debt facility, since end-FY21, a further 29 properties have been acquired for an aggregate £22.0m (before costs), all specially adapted to provide long-term support for a further c 100 individuals with disabilities, learning difficulties and mental health care needs.
Alongside acquisitions, investment has also continued in the existing portfolio with the aim of ensuring that properties continue to meet the needs of tenants. In some cases, changing resident needs dictate changes to a property, often involving minor works carried out by the tenant. Under certain circumstances Civitas funds the works, enhancing the longevity and sustainability of the portfolio. During FY21 capital expenditure funded by Civitas amounted to c £4.0m (FY20: c £1.8m) including property improvement works, renovations and scheduled post-completion works. We expect capex to continue at a broadly similar rate, including energy efficiency measures linked to the E.ON arrangement. The latter is likely to be spread over several years with much of the gross capex, but not all, funded by government grant programmes; Civitas anticipates its own contribution to the energy efficiency capex to be well below £1m pa.
Historically focused on SSH
To date, Civitas has been primarily focused on SSH and similar specialist housing that falls into five main categories:
■
SSH for individuals with a range of complex care needs.
■
Mental health care facilities for those requiring supervision in carrying out daily tasks.
■
Step-down accommodation for those transitioning from NHS care to more independent living.
■
Accommodation for those with addictions.
■
Accommodation for the homeless or those at risk of homelessness.
Civitas has a focus on homes that are suitably adapted to support the provision of medium to high acuity care, evidenced by the average 43 hours per week of care received by residents within its homes. The investment adviser indicates that around two-thirds of the portfolio supports mid-acuity SSH and similar specialised housing and one-third supports the provision of high acuity residential care.
In addition to the continuing strong demand from local authorities for Civitas’s traditional core activity, the broadening of Civitas’s investment remit approved by shareholders in May 2020 has further increased the range and scale of the potential investment opportunities available to the company. This will enable Civitas to diversify into working with a broader range of counterparties and with new client groups, expanding from the current focus on local authorities and housing associations to include the NHS, major charities and community interest companies. Over the coming one to two years, Civitas aims to position itself as a strategic partner with these to provide a wide range of community based social assets with similar dynamics to SSH5F6, to meet an expanding range of needs. The near-term focus is on meeting the substantial demand for suitable housing for those who have suffered homelessness, combined with additional support aimed at preventing them from returning to homelessness.
High long-term structural demand, extensive care requirements and positive social outcomes.
|
Exhibit 6: New opportunities and additional counterparties |
|
|
Source: Civitas Social Housing |
Targeting ‘advanced homeless provision’
The concept of ‘advanced homeless provision’ goes beyond simply providing temporary housing and involves integrating a significant level of care and support aimed at breaking the cycle of homelessness.
Civitas is already providing accommodation to several local authorities in London which have identified the need for adapted specialist housing for homelessness provision, provided in properties that are suitably designed to provide a significant level of care and support.
Approved SSH is funded by government
All funding for accommodation that meets the strict requirements for SSH6F7 comes from central government and is distributed via the local authorities that commission the services. SSH provision is therefore not reliant on the level of local authority funding. Civitas works with more than half of all local authorities in the UK.
Qualifying SSH rents are set on a bespoke basis and are exempt from the social rent rules that normally apply to housing benefit awards. Although Civitas’s high acuity residential care does not meet the strict definition of SSH, the contract terms are effectively the same.
|
Exhibit 7: Contract structure for SSH |
|
|
Source: Civitas Social Housing |
Landlords (like Civitas) are not usually contracted directly with the local authority. Rather, local authorities contract with care providers, which is responsible for the provision of care to residents. The care provider in turn enters into a service level agreement with the approved provider that manages the property leased from the property owners (eg Civitas). Civitas’s portfolio is fully let on long-term leases (average WAULT of 22.6 years) to a diversified group of 16 approved providers, which in turn work with 116 care providers. Historically, the service level agreements between the care providers and the approved providers have been much shorter than the property lease agreements. Technically, this mismatch could represent a risk to approved providers should a care provider not renew a service level agreement, although in practice it is highly unlikely that either local authority or care provider would wish to relocate a resident from a carefully selected long-term home. Although this is only a technical risk, Civitas has sponsored the adoption of 25-year ‘back-to-back’ agreements between care providers and approved providers, to match long-term leases, and more than one-third of the portfolio is now on this basis. Government funding for SSH is disbursed via the local authorities, with care costs paid directly to the care provider, while rents and property service charge payments are made directly to the approved provider (not the resident). While the properties are fully let by Civitas to the approved providers, the latter may have unoccupied accommodation from time to time, often reflecting: the fact that it may take up to a year to fill a newly opening home for clinical reasons; the complexity of transfers from long-stay hospitals; delays in setting up individual care packages; that introducing a compatible new tenant into a vacancy in an existing home needs to be handled with care. The cost to approved provider’s that vacancy/voids represent are in most cases allowed for within the care contract and are covered by the care provider. Civitas says that voids within the homes that it owns are limited and the latest impact report produced by The Good Economy indicates that the level is consistent with the overall sector.
|
Exhibit 8: Diversified tenant base, by share of annualised rent roll |
Exhibit 9: Diversified by region, by share of market value |
|
|
|
Source: Civitas Social Housing REIT. Note: Data as at 31 March 2021. *Others comprises New Walk (2.8%), My Space (1.2%), IKE (1.1%), Hilldale (1.0%, Blue Square (0.1%), and Qualitas Housing (0.02%). |
Source: Civitas Social Housing REIT. Note: Data as at 31 March 2021. |
|
Exhibit 8: Diversified tenant base, by share of annualised rent roll |
|
|
Source: Civitas Social Housing REIT. Note: Data as at 31 March 2021. *Others comprises New Walk (2.8%), My Space (1.2%), IKE (1.1%), Hilldale (1.0%, Blue Square (0.1%), and Qualitas Housing (0.02%). |
|
Exhibit 9: Diversified by region, by share of market value |
|
|
Source: Civitas Social Housing REIT. Note: Data as at 31 March 2021. |
Working with a spread of approved providers, across a broad range of local authorities and regions, facilitates occasional lease reassignments (or transfers of properties from one approved provider to another). This may be to optimise the efficiency of care provided (eg transferring the management of a property to an alternative provider with a stronger presence in an alternative location), but also provides an additional opportunity to manage tenant exposures, where good quality assets in strong locations are the key to successful lease reassignment. There were no lease reassignments in FY21 although in FY20 a significant number of the assets leased to Westmoreland Housing Association were reassigned to Auckland Home Solutions, supporting Westmoreland’s significant stock rationalisation programme as it seeks to meet the requirements of the Regulator of Social Housing (RSH). In 2018, properties leased by Civitas to First Priority Housing Association were successfully reassigned to alternative providers within a few weeks when the latter became financially distressed. The reassignments were on similar terms, with no material financial impact on Civitas and no impact on the care provided to residents.
Exhibit 10: Portfolio development by tenant (number of properties)
Approved provider |
Mar-21 |
Mar-20 |
Mar-19 |
FY21 |
FY20 |
FY19 |
|
Auckland |
103 |
103 |
30 |
Falcon |
117 |
117 |
115 |
BeSt |
74 |
72 |
71 |
Inclusion |
72 |
69 |
60 |
Westmoreland |
41 |
41 |
108 |
Encircle |
16 |
16 |
16 |
Trinity |
43 |
43 |
43 |
Pivotal |
27 |
27 |
27 |
Harbour light |
27 |
27 |
26 |
Chrysalis |
23 |
23 |
20 |
New Walk |
41 |
41 |
41 |
Hilldale |
15 |
15 |
15 |
IKE |
10 |
10 |
10 |
MySpace |
8 |
8 |
8 |
Blue Square |
1 |
1 |
1 |
Qualitas |
1 |
N/A |
N/A |
Total number of properties |
619 |
613 |
591 |
Source: Civitas Social Housing data
Auckland was the founder member of The Social Housing Family CIC, a not-for-profit community interest company (CIC) that was sponsored by Civitas. Although independent of Civitas and governed by an independent board, the CIC is intended to benefit Civitas and the sector by pooling skills and experience and promoting best-practice amongst its members. Since joining the CIC Auckland has enhanced its board, management and processes. Qualitas Housing, also a Civitas lessee, has become a second member of the CIC and Civitas expects other providers to join soon.
Regulatory oversight provides stability and enhances care
The social housing sector has traditionally had a low financial risk profile, in part due to the ongoing monitoring presence of the RSH and the fact that much of the rent is funded by central government through housing benefit and latterly, universal credit. Civitas’s lessees are regulated by the RSH, but Civitas is not, although it interacts with the RSH on a regular basis. The RSH seeks to identify potential issues in the sector and is active in resolving these. Historically, in a small number of cases where a registered provider7F8 has faced financial or other challenges, the regulator has stepped in to facilitate a solution, preventing any general loss of confidence across the sector. This may involve a strengthening of corporate governance, assisting with moving properties to a different provider that may be better placed to manage them (as was the case with First Priority), or a financial merger.
Registered providers are specifically regulated by the RSH. Our use of the term ‘approved providers’ refers to a wider group of lease counterparties which may be regulated by another body.
For some SSH providers, the pace of growth has outstripped the development of their management and governance structures as well as their capital resources, resulting in greater regulatory attention, and leading to several providers being issued with regulatory notices and judgements8F9. For those deemed non-compliant by the RSH there are clear signs of progress being made in terms of governance, management and financial strength, although there is more work to be done. Following a pause in regulatory action during the lockdown, allowing providers to focus on operational issues, regulatory engagement with the lease-based providers has recommenced. As one of the leading private sector investors in the supported housing sector, working with some of the fastest-growing providers, nine9F10 Civitas lessees are the subjects of regulatory judgements or notices. Civitas, through CIM, has supported these providers in addressing the specific concerns of the RSH. More generally, it has taken steps to address regulatory concerns about the long-term risk planning of providers by introducing caps and collars on rent indexation (typically of between 1% and 4%) and ‘force majeure’ clauses, setting out appropriate steps in the unlikely event of a formal change in government policy and funding.
Regulatory judgements represent the regulator’s view on a provider’s compliance with governance and the viability requirements. For providers with less than 1,000 units the RSH may publish a regulatory notice if there is evidence that a provider is in breach of regulatory requirements.
Auckland, BeST, Encircle, Hilldale, Inclusion, MySpace, Pivotal, Trinity, and Westmoreland.
While the nine lessees subject to regulatory judgements and notices collectively account for around two-thirds of Civitas rents it is important to stress that there has been no impact on rent collection or negative impact on the external valuations of the properties owned by Civitas. We expect this to remain the case. In our view, regulatory interventions in the SSH segment of social housing are primarily aimed at identifying, assessing, and making clear the risks, so that these may be adequately managed, as a means to safeguarding this financial resilience and maintaining the operational standards of the sector. There may be cases where some approved providers are unable to satisfy the RSH and over time we would expect concentration amongst the providers (perhaps through mergers and other amalgamations), leading to a smaller number of stronger providers. As has been demonstrated, quality properties, in the right locations, adequately adapted, and supporting an appropriate level of care are attractive to alternative providers in their efforts to meet the strong and growing need for accommodation.
FY21 financial performance
Despite the pandemic, there were no surprises in the FY21 results. Although acquisition activity was modest in the year, rental income increased, costs were well-controlled, and 100% collection of rents supported good growth in underlying operational cash flow of almost 10%.
Exhibit 11: Summary of FY21 financial performance
Year to 31 March (£m unless stated otherwise) |
FY21 |
FY20 |
FY21/FY20 |
Edison FY21e |
Net rental income |
47.8 |
45.9 |
4.2% |
48.5 |
Total administrative expenses |
(9.5) |
(9.9) |
-3.7% |
(9.8) |
Operating profit/(loss) before revaluation of properties |
38.3 |
36.0 |
6.4% |
38.7 |
Change in fair value of investment properties |
5.5 |
9.4 |
6.5 |
|
Operating profit/(loss) |
43.9 |
45.4 |
-3.5% |
45.2 |
Net finance expense |
(7.7) |
(7.2) |
(7.9) |
|
Change in fair value of interest rate derivatives |
(0.1) |
(0.5) |
(0.9) |
|
PBT |
36.1 |
37.7 |
-4.4% |
36.3 |
Tax |
0.0 |
0.0 |
0.0 |
|
IFRS net earnings |
36.1 |
37.7 |
-4.4% |
36.3 |
Adjust for: |
||||
Change in fair value of investment properties |
(5.5) |
(9.4) |
(6.5) |
|
Change in fair value of interest rate derivatives |
0.1 |
0.5 |
0.9 |
|
EPRA earnings |
30.6 |
28.8 |
6.3% |
30.7 |
Basic IFRS EPS (p) |
5.80 |
6.06 |
5.84 |
|
Diluted EPRA EPS (p) |
4.93 |
4.63 |
6.4% |
4.94 |
DPS declared (p) |
5.40 |
5.30 |
1.9% |
5.40 |
Dividend cover (x) |
0.92 |
0.87 |
0.92 |
|
Investment portfolio |
893.7 |
868.0 |
3.0% |
906.0 |
Diluted EPRA NAV per share (p) |
108.4 |
107.9 |
0.4% |
108.6 |
Net debt |
(253.2) |
(231.1) |
(244.9) |
|
Gross LTV (gross debt/gross assets) |
34.5% |
28.7% |
34.3% |
Source: Civitas historical data, Edison Investment Research FY21e
In particular, we note that:
■
Net rental income increased by 4.2% to £47.8m year-on-year, a result of rent indexation and acquisitions, and including a c £0.3m non-cash provision against an undisputed but outstanding receivable, driven by IFRS requirements.
■
Administrative costs were well controlled and reduced by 3.7% versus FY20. Investment advisery fees, based on net assets, were flat and the decline in other administrative expenses was broadly spread.
■
On an underlying basis10F11 operational cash flow, a key metric for Civitas, increased to £36.1m (FY20: 32.9m).
Adjusting for the c £10m follow-on investment in one asset, accounted for as a lease incentive
■
Net finance expense increased in line with average borrowing during the year.
■
EPRA earnings and EPRA EPS both increased by a little over 6%. DPS cover was 92% on a reported basis but had reached 100% on an annualised run-rate basis by the year end.
■
Including a positive £5.5m gain on the valuation of investment properties, driven by rent-indexation and a slight tightening of valuation yields, and after DPS paid, EPRA NTA per share increased slightly to 108.4p.
■
The new £85m M&G debt facility was fully drawn at year-end and available for investment.
Financial forecasts
The FY21 results were very close to the estimate that we published in May 2021 (Exhibit 11) and our updated FY22 forecasts are modestly reduced in aggregate. We have also introduced an FY23 estimate.
Exhibit 12: Forecast update
Net rental income (£m) |
EPRA earnings (£m) |
EPRA EPS (p) |
EPRA NAV/share (p) |
DPS (p) |
|||||||||||
New |
Old |
% chg |
New |
Old |
% chg |
New |
Old |
% chg |
New |
Old |
% chg |
New |
Old |
% chg |
|
03/22e |
54.0 |
54.2 |
(0.4) |
34.3 |
34.8 |
(1.3) |
5.5 |
5.6 |
(1.3) |
109.8 |
111.3 |
(1.4) |
5.55 |
5.55 |
0.0 |
03/23e |
56.6 |
N/A |
N/A |
36.7 |
N/A |
N/A |
5.9 |
N/A |
N/A |
112.4 |
N/A |
N/A |
5.68 |
N/A |
N/A |
Source: Edison Investment Research
The slight reduction in our FY22 forecast is driven by the weighted impact of a lower level of new investment commitment than previously assumed, partly offset by a higher annualised rent roll than we had allowed for at the end of FY21 (£50.8m versus £50.4m).
In addition to the £22.0m of committed investment announced in Q122 we now assume £50m (before costs) of additional commitment (£72m in FY22 in total compared with £100m previously). This is consistent with full utilisation of existing debt capital, the maintenance of a c £30m cash buffer and 35% gross gearing (gross debt as a percent of IFRS gross assets). Our previous assumption for capital commitment had explicitly assumed either a lower cash float or additional borrowing. Based on the strong pipeline of investment opportunities we have no doubt that capital commitments will continue well beyond our assumptions, funded by a balance of new equity and debt capital resources, including utilisation of the strong investment-grade credit rating that Civitas received in March 2021 (see next section).
Our investment assumptions also allow for £4.5m pa of capex directed at existing properties, a similar level to FY21. Otherwise, our forecasts assume:
■
Like for like growth in rental income driven by inflation indexation with an assumption that CPI rises to 2.5% by end-FY22 and through FY23.
■
Investment adviser fees as per the fee schedule shown in Exhibit 4 (above) and other administrative expenses growing modestly with inflation. On this basis the EPRA cost ratio continues to decline, reaching 17.3% in FY23 as shown in the financial summary (Exhibit 17).
■
Within finance costs, a full year impact of the fully drawn M&G debt facility and a related increase in loan arrangement fee amortisation to £1.5m pa (FY21: £1.3m).
■
Property revaluation gains driven by rent indexation, adjusted for acquisition costs and capex. Although driven by rent indexation, we have assumed gross revaluation gains at a slightly lower level (c 1.9% versus 2.5% rent indexation), which implies a slight uptick in net initial yield (from 5.24% to c 5.30%). The income statement gain per share increases in FY23 because we have assumed no acquisitions and related costs; in reality, we would expect Civitas to continue to grow through acquisition, funded by an increase in capital resources.
Exhibit 13: Reconciliation of reported property revaluation movement
FY20 |
FY21 |
FY22e |
FY23e |
|
Gross property revaluation |
20.4 |
21.8 |
17.7 |
19.2 |
Adjust for: |
||||
IFRS adjustments |
3.9 |
11.2 |
(0.1) |
(0.1) |
Capex |
1.8 |
4.1 |
4.5 |
4.5 |
Acquisition costs written off |
5.3 |
1.1 |
4.7 |
0.0 |
Income statement revaluation |
9.4 |
5.5 |
8.6 |
14.8 |
Gross revaluation as % opening portfolio value |
2.5% |
2.5% |
1.9% |
1.9% |
Gross revaluation per share (p) |
3.3 |
3.5 |
2.8 |
3.1 |
Income statement revaluation per share (p) |
1.5 |
0.9 |
1.4 |
2.4 |
Property acquisition costs |
16.9% |
7.0% |
6.8% |
N/A |
Source: Civitas Social Housing historical data, Edison Investment Research forecasts
■
We have assumed that DPS grows further in FY23, up by 2.3% on the FY22 target of 5.55p per share. We expect the FY22 DPS to be fully covered by EPRA earnings (1.00x) and for cover to increase in FY23 (1.04x). Although the DPS was already fully covered on a run-rate basis by end-FY21, FY22 includes a full year of cost from the M&G debt while the property acquisitions that it funds will not make a full-year contribution until FY23. Our forecasts imply NAV total returns of 6.4% in FY22 and 7.5% in FY23.
Funding the investment pipeline
Civitas raised initial equity of £350m in its oversubscribed IPO in November 2016 and raised an additional £302m in November 2017 through the issue of C shares that converted into new ordinary shares in December 2018. As at 31 March 2021 (end-FY21), group equity was c £674m and fully drawn debt facilities amounted to £357m. Gross loan to value (LTV)11F12 was 34.5% compared with the company’s medium-term target of c 35% (with a maximum of 40%). Debt included the drawdown of the recently arranged £84.5m M&G facility, the proceeds of which were available for deployment12F13. We estimate that including our assumed further investment commitment outlined above, the company will have fully deployed its existing equity and debt capital resources by later in FY22. Given the strong pipeline of investment opportunities, we expect Civitas to seek additional equity and debt capital over time. The company plans to leverage its investment grade credit rating13F14 and access the sterling bond market. This would be complementary to any increase in equity capital and should provide access to attractively priced longer-term debt.
Defined as gross debt as a percentage of IFRS gross assets.
31 March 2021 unrestricted cash was c £104m.
In March 2021, Civitas announced that Fitch Ratings had awarded the company an investment grade high credit quality rating of A (senior secured) and a long-term issuer default rating of A- with a stable outlook.
The debt portfolio has a weighted average cost of 2.4% with a weighted average maturity of four years14F15, enhanced by the seven-year M&G facility agreed in February 2021. The M&G facility is priced at margin over Libor of 2.75% above a fixed Libor swap rate of 0.39% (an effective 3.137% above Libor). The upward movement in long-term rates during the period when the M&G loan was being finalised slightly increased the overall margin on the facility, but Civitas was nevertheless pleased to further diversify its sources of finance by adding a good quality insurance lender.
At 31 March 2021.
Exhibit 14: Debt portfolio
Lender |
M&G |
Scottish Widows |
NatWest |
Lloyds |
HSBC |
Facility |
Loan notes |
Loan notes |
Loan notes |
RCF |
RCF |
Facility size |
£84.5m |
£52.5m |
£60.0m |
£60.0m |
£100.0m |
Drawn |
£84.50 |
£60.0m |
£60.0m |
£100.0m |
|
Term |
7 years |
10 years |
5 years |
2 years |
3 years |
Maturity |
Feb-28 |
Nov-27 |
Aug-24* |
JUL-23 |
Nov-22** |
Cost |
Libor + 3.137% |
2.9936% fixed |
Libor + 2.0%* |
Libor + 1.5% |
Libor + 1.70% |
Security pool value*** |
£225.2m |
£170.8m |
£131.3m |
£149.7m |
£219.6m |
LTV covenants (max.) |
55% |
40% |
50% |
55% |
60% |
Interest cover covenant (min.) |
250% |
325% |
250% |
250% |
250% |
Source: Civitas Social Housing REIT data, Note: *With two one-year extension options and £40m accordion option subject to NatWest agreement. Borrowing cost hedged with five-year swaps at an average 0.6%. **One-year extension option subject to HSBC agreement. ***At 31 March 2021.
All LTV covenants were comfortably met over the past year and the weighted average interest cover across the facilities was c 550%.
Valuation
Based on the targeted 5.55p aggregate FY22 DPS, the prospective yield is 4.8%, supporting the c 7% premium to end-FY21 EPRA NTA per share.
|
Exhibit 15: Price to NAV history since IPO |
|
|
Source: Company NAV data, Refinitiv prices |
Since IPO in November 2016 the average discount to NTA has been around 3% (Exhibit 14) but this includes two periods of temporary weakness. The first of these occurred from late-2018 to mid-2019, reflecting initial investor caution in response to increased regulatory intervention in the sector. As the issues became better understood, the share price began to move higher, only for the improvement to be punctuated by COVID-19 fears at the beginning of the lockdown. An appreciation of the critical role that the sector performs, the factors that mitigate the operational risks of COVID-19 and the robustness of rent payments have contributed to a recovery in the share price.
In Exhibit 16 we show a share price performance and valuation comparison with a group of companies that we would consider to be the closest peers to Civitas, investing in housing and healthcare properties. Over the past 12 months the group has shown a weaker share price development than the broader UK property sector and UK market as stocks and sectors that were hardest hit early in the pandemic have been rebounding. For comparative purposes, the valuation data in the table is based on trailing DPS and NAV data. On this basis Civitas is trading with a yield and that is similar to the average, and with a lower P/NAV. With performance during the pandemic demonstrating the resilience of the sector and the business model, we consider that Civitas offers an attractive yield while also delivering a material social benefit.
Exhibit 16: Peer valuation and performance comparison
Price (p) |
Market cap. (£m) |
P/NAV* (x) |
Yield** (%) |
Share price performance |
||||
1 month |
3 months |
12 months |
From 12M high |
|||||
Assura |
77 |
2,055 |
1.37 |
3.7 |
0% |
3% |
0% |
-8% |
Impact Healthcare |
115 |
367 |
1.04 |
5.5 |
4% |
0% |
12% |
-2% |
Primary Health Properties |
160 |
2,259 |
1.41 |
3.7 |
2% |
6% |
7% |
-1% |
Residential secure Income |
104 |
177 |
0.99 |
4.8 |
2% |
9% |
11% |
-4% |
Triple Point Social Housing |
104 |
421 |
0.98 |
5.0 |
-1% |
0% |
0% |
-8% |
Target Healthcare |
119 |
546 |
1.09 |
5.6 |
5% |
1% |
13% |
-2% |
Average |
1.15 |
4.7 |
2% |
3% |
7% |
-4% |
||
Civitas Social Housing |
116 |
722 |
1.07 |
4.7 |
-2% |
3% |
6% |
-3% |
UK property sector index |
1,819 |
3% |
6% |
25% |
-3% |
|||
UK equity market index |
4,003 |
0% |
0% |
15% |
-3% |
|||
Source: Company data, Refinitiv prices as at 20 July 2021. Note: *Based on last reported EPRA NAV. **Based on trailing 12-month DPS declared.
Sensitivities
SSH assets, the core of the existing portfolio, are let on long inflation-indexed leases and the rents of those individuals living in homes that meet the criteria for SSH fully funded by central government. This is paid via local authorities directly to the approved providers that lease the homes from Civitas. The company indicates that the lease terms applicable to its planned broader investment in care-based social housing are likely to be similar in nature. The SSH sector provides an essential service to some of the most vulnerable members of society, receives widespread political support for the improved tenant outcomes and value for money that it provides, and benefits from a strict regulatory regime that contributes towards long-term stability. The sector has demonstrated operational resilience throughout the pandemic to date. As a result of these factors, the sector has a low correlation with the general economy or the wider residential or commercial property sectors.
We see the key sensitivities as:
■
The failure of one or more approved provider to meet its long-term lease obligations would have the potential to negatively affect income and property valuations. Historically within the social housing sector, where operators have faced financial difficulties, these have been managed via amalgamations, asset transfers and lease reassignments, as was the case with First Priority (a Civitas lessee) in 2019. In the case of reassignment, the impact of a tenant failure (there was no material impact on Civitas in the case of First Priority) depends on credit exposure, the speed with which a lease may be reassigned, and the terms on which this may be achieved. In this respect, the security of income is substantially based on the quality and location of the properties, their suitable adaption to the long-term needs of the tenants, and the level of rents being set at a suitable level in relation to care needs and the wider SSH market.
■
Significant changes in the way the sector is funded have the potential to materially affect investors such as Civitas. We would not anticipate any move towards ‘nationalising’ the provision of SSH given the capital commitment this would require and expect private investment capital to continue to play a significant role. This need for private investment capital also mitigates the risk of any form of ‘rent caps’ that would significantly impair the ability of approved providers to meet their long-term lease obligations. Neither do we expect a removal of the rent cap exemption that applies to SSH given the widespread recognition that the current system offers value for money, providing care at a lower cost than the alternatives while generating clearly enhanced outcomes for those in need.
■
Asset growth and acquisition yields. Our forecasts assume material further asset growth and failure to achieve this, or acquisitions made at materially lower yields than we have assumed would have a limited negative impact on our forecast income growth and dividend cover. Beyond the forecast deployment of existing capital resources, Civitas’s ability to further address the acute shortage of care-based social housing, grow its portfolio with accretive acquisitions, and generate economies of scale, will be dependent on access to additional equity and debt capital.
■
Valuation yields have tightened from c 7% in 2015. We estimate that Civitas is currently acquiring assets at c 5.6% on average. As a relatively recent alternative property asset class, although uncorrelated with the broader sector, it is not entirely clear how yields would develop in a cyclical property sector downturn. Any increase in yields would negatively affect NAV and LTV, although recurring income from existing assets would be unaffected and cash yields on acquisitions would improve.
Exhibit 17: Financial summary
Period ending 31 March (£m) |
2018 |
2019 |
2020 |
2021 |
2022e |
2023e |
INCOME STATEMENT |
||||||
Net rental income |
18.6 |
35.7 |
45.9 |
47.8 |
54.0 |
56.6 |
Directors' remuneration |
(0.2) |
(0.2) |
(0.2) |
(0.2) |
(0.2) |
(0.2) |
Investment advisery fees |
(5.8) |
(6.5) |
(6.2) |
(6.1) |
(6.2) |
(6.3) |
General & administrative expenses |
(2.9) |
(3.0) |
(3.5) |
(3.2) |
(3.2) |
(3.3) |
Total expenses |
(8.9) |
(9.6) |
(9.9) |
(9.5) |
(9.6) |
(9.8) |
EPRA cost ratio |
47.8% |
27.0% |
21.5% |
20.3% |
17.7% |
17.3% |
Operating profit/(loss) before revaluation of properties |
9.7 |
26.1 |
36.0 |
38.3 |
44.4 |
46.8 |
Change in fair value of investment properties |
30.6 |
3.7 |
9.4 |
5.5 |
8.6 |
14.8 |
Operating profit/(loss) |
40.3 |
29.7 |
45.4 |
43.9 |
53.0 |
61.6 |
Net finance expense |
(0.6) |
(3.5) |
(7.2) |
(7.7) |
(10.1) |
(10.1) |
Change in fair value of interest rate derivatives |
0.000 |
0.000 |
(0.5) |
(0.1) |
0.0 |
0.0 |
C share amortisation |
(2.8) |
(6.4) |
0.0 |
0.0 |
0.0 |
0.0 |
PBT |
36.9 |
19.9 |
37.7 |
36.1 |
42.9 |
51.5 |
Tax |
0.0 |
0.0 |
0.0 |
0.0 |
0.0 |
0.0 |
Net profit |
36.9 |
19.9 |
37.7 |
36.1 |
42.9 |
51.5 |
Adjusted for: |
||||||
Change in fair value of investment properties |
(30.6) |
(3.7) |
(9.4) |
(5.5) |
(8.6) |
(14.8) |
Fair value change in interest rate derivatives |
0.0 |
0.0 |
0.5 |
0.1 |
0.0 |
0.0 |
C share amortisation |
2.8 |
6.4 |
0.0 |
0.0 |
0.0 |
0.0 |
EPRA earnings |
9.1 |
22.6 |
28.8 |
30.6 |
34.3 |
36.7 |
Average number of shares (m) |
350.0 |
425.4 |
622.1 |
621.7 |
622.3 |
622.5 |
Average diluted shares (m) |
633.1 |
622.5 |
622.1 |
621.7 |
622.3 |
622.5 |
Basic IFRS EPS (p) |
10.6 |
4.7 |
6.1 |
5.8 |
6.9 |
8.3 |
Diluted EPRA EPS (p) |
1.4 |
3.6 |
4.6 |
4.9 |
5.5 |
5.9 |
DPS declared (p) |
4.25 |
5.08 |
5.30 |
5.40 |
5.55 |
5.68 |
DPS paid (p) |
3.00 |
5.00 |
5.30 |
5.38 |
5.51 |
5.65 |
Dividend cover (x) |
0.87 |
0.91 |
0.87 |
0.92 |
1.00 |
1.04 |
BALANCE SHEET |
||||||
Investment properties |
516.2 |
820.1 |
868.0 |
893.7 |
980.4 |
999.7 |
Other non-current assets |
0.0 |
6.8 |
10.8 |
21.9 |
21.9 |
21.8 |
Total non-current assets |
516.2 |
826.9 |
878.7 |
915.6 |
1,002.3 |
1,021.5 |
Cash & equivalents |
249.6 |
54.3 |
58.4 |
107.1 |
31.8 |
30.4 |
Other current assets |
3.3 |
5.7 |
10.8 |
12.8 |
13.9 |
14.2 |
Total current assets |
252.9 |
60.1 |
69.2 |
119.9 |
45.7 |
44.6 |
Bank loan & borrowings |
0.0 |
0.0 |
(59.7) |
(59.9) |
0.0 |
0.0 |
Other current liabilities |
(308.9) |
(15.3) |
(7.7) |
(9.3) |
(11.1) |
(11.4) |
Total current liabilities |
(308.9) |
(15.3) |
(67.5) |
(69.3) |
(11.1) |
(11.4) |
Bank loan & borrowings |
(90.8) |
(205.2) |
(209.4) |
(292.2) |
(353.6) |
(355.1) |
Other non-current liabilities |
0.0 |
0.0 |
(0.5) |
(0.5) |
(0.5) |
(0.5) |
Total non-current liabilities |
(90.8) |
(205.2) |
(209.9) |
(292.7) |
(354.2) |
(355.7) |
Net assets |
369.4 |
666.5 |
670.6 |
673.5 |
682.8 |
699.1 |
Adjust for: |
||||||
C shares |
298.8 |
0.0 |
0.0 |
0.0 |
0.0 |
0.0 |
Fair value of interest rate derivatives |
0.0 |
0.0 |
0.5 |
0.5 |
0.5 |
0.5 |
Diluted EPRA NTA |
668.1 |
666.5 |
671.0 |
674.0 |
683.3 |
699.7 |
Period-end basic number of shares (m) |
350.0 |
622.5 |
621.6 |
621.9 |
622.5 |
622.5 |
Period end diluted number of shares (m) |
633.1 |
622.5 |
621.6 |
621.9 |
622.5 |
622.5 |
Basic IFRS NAV per share (p) |
105.5 |
107.1 |
107.9 |
108.3 |
109.7 |
112.3 |
Diluted EPRA NTA per share (p) |
105.5 |
107.1 |
107.9 |
108.4 |
109.8 |
112.4 |
CASH FLOW |
||||||
Net cash flow from operating activity |
8.1 |
23.3 |
32.9 |
26.1 |
45.2 |
46.8 |
Cash flow from investing activity |
(483.9) |
(302.6) |
(61.9) |
(6.2) |
(78.2) |
(4.5) |
Net proceeds from equity issuance |
343.0 |
(0.1) |
0.0 |
0.0 |
0.0 |
0.0 |
Net proceeds from C share issuance |
296.0 |
0.0 |
0.0 |
0.0 |
0.0 |
0.0 |
Loan interest paid |
(0.4) |
(3.0) |
(5.8) |
(6.0) |
(8.6) |
(8.6) |
Bank borrowings drawn/(repaid) |
92.5 |
116.0 |
64.1 |
84.6 |
0.0 |
0.0 |
Share repurchase/reissue |
0.0 |
0.0 |
(0.7) |
0.0 |
0.7 |
0.0 |
Dividends paid |
(10.1) |
(27.6) |
(32.9) |
(33.3) |
(34.3) |
(35.2) |
Other cash flow from financing activity |
(1.8) |
(2.4) |
(2.1) |
(2.8) |
(7.9) |
(8.6) |
Cash flow from financing activity |
719.2 |
83.0 |
23.3 |
42.4 |
(42.2) |
(43.7) |
Change in cash |
243.3 |
(196.2) |
(5.7) |
62.4 |
(75.3) |
(1.5) |
Opening cash |
0.0 |
243.3 |
47.1 |
41.4 |
103.8 |
28.6 |
Closing cash (excluding restricted cash) |
243.3 |
47.1 |
41.4 |
103.8 |
28.6 |
27.1 |
Restricted cash |
6.3 |
7.2 |
16.9 |
3.3 |
3.3 |
3.3 |
Cash as per balance sheet |
249.6 |
54.3 |
58.4 |
107.1 |
31.8 |
30.4 |
Debt as per balance sheet |
(90.8) |
(205.2) |
(269.2) |
(352.1) |
(353.6) |
(355.1) |
Unamortised loan arrangement costs |
(1.6) |
(3.3) |
(3.3) |
(4.9) |
(3.4) |
(1.9) |
Total debt |
(92.5) |
(208.4) |
(272.5) |
(357.1) |
(357.1) |
(357.1) |
Net (debt)/cash excluding restricted cash |
150.9 |
(161.3) |
(231.1) |
(253.2) |
(328.5) |
(329.9) |
Gross LTV (gross debt/gross assets) |
12.0% |
23.5% |
28.7% |
34.5% |
34.1% |
33.5% |
Source: Civitas Social Housing historical data, Edison Investment Research forecasts
|
||||||||||||||||||||||||||||||||
|
|
Research: TMT
Centaur Media’s H121 results show revenue and EBITDA margin picking up strongly, with the group on track to meet its FY23 targets, as set out in January in its MAP23 strategy. This envisages group revenue of £45m, with a 23% EBITDA margin. The Flagship 4 brands are leading the way, posting 26% revenue growth over H120. Econsultancy’s blended learning is achieving good traction, while events across the group are benefiting from attractive digital propositions. We have edged our revenue forecast up by £1m in both FY21e and FY22e, retaining earlier expectations on adjusted EBITDA. The H121 cash performance was particularly strong, and we now expect year-end net cash of £11.0m (was £8.3m).