Last close As at 05/08/2026
—
— 0.00 (0.00%)
Market capitalisation
—
Research: Investment Companies
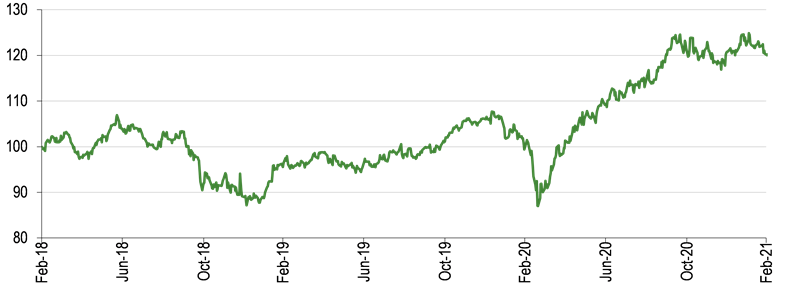
Fidelity Japan Trust (FJV) targets long-term capital growth, via investment in Japanese companies. Manager Nicholas Price adopts a bottom-up stock -picking approach aimed at identifying, ahead of other investors, the next generation of great growth companies in Japan. He believes the Japanese market offers many investment opportunities, especially among mid- and small-cap companies that are often not covered by other analysts. The trust has performed strongly in absolute and relative terms since the Q120 sell-off and has outperformed its index, the TOPIX, and the average of its peers, over one, three, five and 10 years.
Fidelity Japan Trust |
Outperformance driven by skilled stock selection |
Investment trusts |
3 March 2021 |
Analysts
|
|||||||||||||||||||||||||||||||||||||||||||||||||||||||||||||||||||||||||||||||||||||||||||||||||||||||||||
Fidelity Japan Trust (FJV) targets long-term capital growth, via investment in Japanese companies. Manager Nicholas Price adopts a bottom-up stock -picking approach aimed at identifying, ahead of other investors, the next generation of great growth companies in Japan. He believes the Japanese market offers many investment opportunities, especially among mid- and small-cap companies that are often not covered by other analysts. The trust has performed strongly in absolute and relative terms since the Q120 sell-off and has outperformed its index, the TOPIX, and the average of its peers, over one, three, five and 10 years.
|
FJV’s trend of NAV outperformance accelerates after Q120 sell-off |
|
|
Source: Refinitiv, Edison Investment Research. Total returns in sterling. |
Why invest in Japan now?
Japan is a cyclical market, highly geared to global growth and well-positioned to perform as the virus-related negatives fade and the global recovery takes hold. Furthermore, the Japanese government is implementing reforms to digitalise the economy, further improve corporate governance and transition to a net zero carbon economy. Despite recent market gains, Japanese equities continue to trade at a discount to global markets (Exhibit 1, right-hand side). Assuming Japan’s structural reforms support productivity gains and growth, the current relatively low valuations suggest Japanese equities remain attractively priced versus other markets.
The analyst’s view
This fund will appeal to investors seeking exposure to the Japanese market, especially those interested in taking advantage of investment opportunities among less well-covered, mid- and smaller-cap stocks with decent runways of growth. Japan’s relatively low valuations and structural changes may also appeal to UK investors seeking to diversify away from their home market.
Discount on a long-term narrowing trend
FJV’s share price discount to cum-income NAV narrowed in late 2020, supported by the board’s active management. This extended a long-term trend of reduction. The trust is presently trading at a discount of 6.6% and the discount has scope to continue narrowing if performance remains strong and/or investor interest in the Japanese market increases.
Market outlook: Reforms improve medium-term outlook
When Prime Minster Yoshihide Suga took over from his predecessor, Shinzo Abe, in September 2020, he was welcomed as a leader who would continue Abe’s macroeconomic and foreign policies. However, Suga’s focus on domestic structural issues has raised the possibility of accelerated reform and deregulation in certain areas. His drive to modernise the apparatus of government by digitalising the public sector is setting an example for private companies to enhance their digital capabilities after years of underinvestment in IT infrastructure. Suga is also implementing reforms to Japan’s corporate governance system, to reduce cross-shareholdings and increase the independence of boards, and he has inspired a greater focus on environmental issues, by recently committing Japan to carbon neutrality by 2050. The Japanese government has also implemented aggressive fiscal stimulus to support the economy, and several of the initiatives included in the latest stimulus package are intended to support the government’s reform agenda - the third supplementary budget announced in December 2020 included ¥40tn of initiatives to encourage the adoption of digital technology and reduce carbon emissions via the development of alternative, low-carbon energy options.
Equity markets around the world have performed strongly in recent months, supported by the arrival of several viable COVID-19 vaccines and an associated improvement in the global economic outlook. However, Japanese equities appeared to have been given extra momentum thanks to Suga’s reform agenda. Since the beginning of 2021, the Nikkei 225 index has risen 10%, outpacing gains in US and European markets, and in mid-February, the Nikkei breached 30,000 for the first time in 30 years. Yet despite these recent gains, Japanese equities continue to trade at a discount to global markets (Exhibit 1, right-hand side). Assuming Japan’s structural reforms deliver the productivity gains and growth they promise, the current relatively low valuations suggest the Japanese market remains attractively priced compared to the world market.
|
Exhibit 1: Market performance and valuation |
|
Total return performance of TOPIX and UK equities over 10 years (£) |
Valuation metrics of Datastream indices |
|
|
|
Source: Refinitiv, Edison Investment Research. Note: Valuation data at 2 March 2021, based on Datastream indices. |
|
The fund manager: Nicholas Price
The manager’s view: Structural changes creating opportunities
FJV’s manager, Nicholas Price, believes that the structural reforms being ushered in by Prime Minister Suga are creating additional tailwinds to changes underway in the private sector. Foremost among these reforms is the drive to digitalise. Corporations are rapidly increasing their spending on digital transformation initiatives and Price expects that businesses will continue to prioritise these areas as profits recover from the effects of the pandemic. To capitalise on this trend, Price is focused on technology and software companies, including those in the mid- and small-cap spaces, that he believes have great growth potential, but that are not owned by other investors. Many of these stocks, especially smaller-cap software-as-a-service (SAAS) firms were oversold in the early stages of the pandemic, providing Price with a rare buying opportunity at the time.
Prime Minister Suga’s zero carbon commitment is also creating new markets in areas such as renewable and clean energy and environmental efficiency. Price believes Japan has some very competitive companies in this sphere, that have scope to supply solutions to companies around the world looking to meet regulatory requirements and make productivity gains. In addition, in Price’s view, the Japanese government’s push to improve corporate governance will provide additional opportunities for the trust to invest in companies, particularly conglomerates and industrials, where business reorganisation and consolidation could drive a re-rating, or at least act as a share price catalyst. Market reforms by the Tokyo Stock Exchange should drive further consolidation in 2021.
In general, Price looks for under-researched companies that have a long runway for growth and competitive advantages in new or growing markets over three to five years, including those at the pre-IPO stage, and he is enthusiastic about the size and diversity of the opportunity set on offer in Japan. As he points out, only a fraction of the c 3,800 listed Japanese companies are well-covered by sell-side analysts, especially in the mid- to small-cap space. This represents a great opening for bottom-up managers like Price, who are willing to do the legwork and identify the most attractive business cases. Being on the ground in Japan is key for Price because, he says, it allows him and his team ‘to see first-hand a lot of the new ideas and business models that are coming to the market’. With a global economic recovery gathering momentum, Price says he is also ‘widening the net a bit further’, looking for companies with recovery potential in areas such as leisure and travel. ‘As we start to see better earnings announcements in fiscal 2021, there will be an opportunity to pick up companies that are changing into or returning as growth names’ he says.
In summary, the manager is ‘cautiously optimistic’ on the investment outlook this year, and ‘very positive’ on the medium-term outlook for Japanese growth stocks. ‘In an uncertain world, Japan, with its structural reform agenda and a wealth of under-researched companies, represents a significant source of potential alpha (excess return relative to the benchmark) for long term investors’ he concludes.
Asset allocation
Current portfolio positioning
Exhibit 2: Top 10 holdings (at 31 January 2021)
Company |
Country |
Sector |
Portfolio weight % |
Benchmark |
Active weight vs benchmark |
|
31 Jan 2021 |
31 Jan 2020* |
|||||
Misumi Group |
Japan |
Wholesale trade |
5.5 |
4.5 |
0.2 |
5.3 |
Z Holdings |
Japan |
Information & communication |
5.0 |
N/A |
0.4 |
4.6 |
Koito Manufacturing Co |
Japan |
Electric appliances |
4.9 |
N/A |
0.2 |
4.7 |
Murata Manufacturing |
Japan |
Electric appliances |
4.6 |
8.1 |
1.2 |
3.4 |
Recruit Holdings |
Japan |
Services |
4.0 |
N/A |
1.3 |
2.7 |
JustSystems |
Japan |
Information & communication |
4.0 |
5.5 |
0.0 |
4.0 |
Orix Corporation |
Japan |
Other financing business |
3.9 |
N/A |
0.4 |
3.5 |
Keyence Corporation |
Japan |
Electric appliances |
3.4 |
4.9 |
2.2 |
1.2 |
Ryohin Keikaku |
Japan |
Retail trade |
3.4 |
N/A |
0.1 |
3.3 |
Shimano |
Japan |
Transportation equipment |
3.3 |
3.9 |
0.4 |
2.9 |
Top 10 (% of holdings) |
42.0 |
50.8 |
||||
Source: Fidelity Japan Trust, Edison Investment Research. Note: *N/A where not in end-January 2020 top 10. **TOPIX Total Return Index.
Consistent with Japan’s global competitiveness in key electronic components, the drive to digitalise and the growth opportunities he sees in related areas, FJV’s manager has maintained the portfolio’s relatively large tilt towards technology companies, which fall within the electric appliances, information and communications and wholesale trade categories of the index (Exhibit 3). Key holdings in these sectors include top 10 positions in factory automation specialists Misumi Group and Keyence, Z Holdings, a leading internet company, JustSystems, an educational software company, and component maker, Murata Manufacturing, which is benefiting from 5G content growth and automobile electrification. Examples driven by this theme include efficiency enablers and companies supplying services to facilitate corporate digital transformation, for example through the use of online and cloud computing. The manager holds positions in Sansan, which provides business-to-business and business-to-consumer contact management services and Hennge, an SAAS provider.
Exhibit 3: Portfolio sector exposure versus TOPIX (% unless stated)
Portfolio end- Jan 2021 |
Portfolio end- Jan 2020 |
Change (pp) |
Index weight |
Active weight vs index (pp) |
Trust weight/ index weight (x) |
|
Electric appliances |
26.5 |
29.8 |
(3.3) |
18.1 |
8.4 |
1.5 |
Info & communication |
20.0 |
12.5 |
7.4 |
9.3 |
10.7 |
2.1 |
Services |
10.5 |
8.2 |
2.2 |
5.6 |
4.9 |
1.9 |
Retail trade |
5.9 |
3.1 |
2.8 |
4.8 |
1.1 |
1.2 |
Wholesale trade |
5.3 |
4.9 |
0.5 |
4.5 |
0.8 |
1.2 |
Machinery |
4.4 |
4.8 |
(0.4) |
5.8 |
(1.4) |
0.8 |
Other Financing Business |
4.2 |
N/S |
N/A |
1.1 |
3.1 |
3.8 |
Chemicals |
3.8 |
2.7 |
1.0 |
7.7 |
(3.9) |
0.5 |
Precision Instruments |
3.4 |
9.2 |
(5.9) |
2.7 |
0.7 |
1.2 |
Transport Equipment |
3.1 |
6.8 |
(3.7) |
6.8 |
(3.7) |
0.5 |
Other sectors |
11.7 |
16.7 |
(5.0) |
33.7 |
(22.0) |
0.3 |
Other index/unclassified |
1.4 |
1.2 |
0.2 |
0.0 |
1.4 |
N/A |
100.0 |
100.0 |
100.0 |
Source: Fidelity Japan Trust, Edison Investment Research. Note: Adjusted for gearing. N/S =not separately stated; may be included in other sectors.
The trust also holds names in the ecommerce sphere, including Giftee, an online gifting platform, along with an interesting unlisted company that offers an online consumer-to-consumer platform to buy knowledge, skills and experience from those willing to sell these services for a fee. This company has seen enormous growth as people have sought second jobs and alternative means of working remotely and the manager expects this trend to continue in the medium term. At the end of December 2020, this was one of three unlisted positions in the portfolio. The manager has scope to invest up to 10% of the portfolio in unlisted companies and he continues to look for similar, unlisted and fast-growing services and internet-based companies, as well as innovative meditech names.
Price’s search for stocks that are well positioned for recovery and growth has seen him increase the portfolio’s position in Koito Manufacturing Company, an auto parts supplier whose subsequent good share price performance has seen it move into the ranks of the portfolio’s top three holdings (Exhibit 2).
Exhibit 4: Portfolio market cap exposure versus TOPIX (% unless stated)
Portfolio end- Jan 2021 |
Portfolio end- Jan 2020 |
Change (pp) |
Index weight |
Active weight vs index (pp) |
Trust weight/ index weight (x) |
|
>£10bn |
35.9 |
41.7 |
(5.8) |
61.0 |
(25.1) |
0.6 |
£5–10bn |
19.6 |
17.0 |
2.5 |
13.7 |
5.9 |
1.4 |
£1–5bn |
21.9 |
19.6 |
2.4 |
17.2 |
4.7 |
1.3 |
£0–1bn |
21.1 |
20.5 |
0.7 |
8.1 |
13.0 |
2.6 |
Other index/unclassified |
1.4 |
1.2 |
0.2 |
0.0 |
1.4 |
N/A |
100.0 |
100.0 |
100.0 |
Source: Fidelity Japan Trust, Edison Investment Research. Note: Adjusted for gearing.
As the Japanese market recovery gained traction towards the end of 2020, the manager selectively took some profits in strong performers such as Shimano and Z Holdings, although these companies are both still top 10 holdings, and Olympus, which slipped out of FJV’s top 10 holdings as a result. This profit taking has seen the portfolio’s holdings in large-cap companies decline over the last year, as the proceeds have been recycled into mid- and smaller-cap names (Exhibit 4).
Performance: Stock selection driving outperformance
Exhibit 5: Five-year discrete performance data
12 months ending |
Share price |
NAV |
Blended Index (%) |
TOPIX TR (%) |
R/Nomura Mid & Small Cap Japan (%) |
CBOE UK All Cos (%) |
28/02/17 |
28.2 |
29.5 |
36.3 |
36.7 |
36.3 |
23.7 |
28/02/18 |
45.9 |
34.6 |
13.0 |
11.3 |
13.0 |
4.4 |
28/02/19 |
(9.8) |
(11.2) |
(7.1) |
(7.7) |
(8.6) |
1.6 |
29/02/20 |
6.5 |
7.7 |
3.6 |
3.6 |
(1.8) |
(2.1) |
28/02/21 |
46.1 |
41.6 |
16.9 |
16.9 |
16.3 |
2.8 |
Source: Refinitiv. Note: All % on a total return basis in pounds sterling. *Blended benchmark is a mid- and small-cap Japan index until 22 May 2018 and TOPIX index thereafter.
FJV’s performance has continued to improve over recent months, after a period of negative returns in Q120. In the six months to end-February 2021, the trust returned 18.2% in share price terms and 16.4% on an NAV basis, outperforming its index, the TOPIX index, which returned 11.0%. It has also made positive absolute returns and outperformed the index over one, three, five and 10 years (Exhibit 6). FJV has also outperformed Japanese mid- and small-cap companies in both share price and NAV terms over six months and over one, three, five and 10 years (Exhibit 7). Its outperformance of the broad UK market over all periods shown beyond three months has been even more significant.
|
Exhibit 6: Investment trust performance to 28 February 2021 |
|
Price, NAV and benchmark total return performance, one-year rebased |
Price, NAV and benchmark total return performance (%) |
|
|
|
Source: Refinitiv, Edison Investment Research. Note: Three-, five- and 10-year performance figures annualised. Blended benchmark is the R/Nomura Mid & Small cap Japan Index (£) until 22 May 2018 and TOPIX (£) thereafter. |
|
FJV’s holding in Olympus, a global leader in endoscopes, was the standout contributor to returns in 2020. The company’s share price climbed to a record high after it announced plans to sell its loss-making camera business. Although the manager has taken some profits, he has retained an overweight position in this stock, as he believes the company’s investment thesis remains strong, underpinned by the strength of its endoscope business, a new product cycle and management’s commitment to improving both governance and profitability, and he expects its valuation discount to global peers to continue to shrink. The trust’s overweight position in bicycle component maker Shimano was another top contributor to performance. The stock surged on strong global demand for its products, as more people turned to bikes to avoid congested public transport. Other overweight positions in ecommerce and software/online services companies, including Demae-can, Hennge and Z Holdings, added value, as demand for their specific offerings increased due to the unique circumstances created by the pandemic and/or a heightened focus on digitalisation.
The positive contribution to returns from these and other positions more than offset the poor performance of confectionary supplier Kotobuki Spirits and funeral services operator Kamakura Shinsho. Modest overweights to these two companies were the most significant detractors from returns over the year to end-December 2020. These domestic-oriented companies experienced a deep but temporary hit to earnings as the COVID-19 pandemic limited economic and social activity. However, both companies have strong balance sheets and command leading market positions and remain in the portfolio, as the manager expects them to rebound strongly as conditions gradually normalise. Elsewhere, positions in speciality retailer Ryohin Keikaku and pharmaceuticals company Eisai detracted due to stock-specific factors.
On a sector basis, the trust’s overweight to technology stocks in the information and communications and electric appliance sectors and an overweight to precision instruments all made significant contributions to relative performance, as did underweights to laggard banks and low growth domestic sectors such as land transportation. Conversely, overweights to services and other products, and underweights to pharmaceuticals and foods had a more modest adverse effect on relative returns.
|
Exhibit 7: Share price and NAV total return performance, relative to indices (%) |
||||||||
|
One month |
Three months |
Six months |
One year |
Three years |
Five years |
10 years |
|
Price relative to TOPIX TR |
(2.3) |
(4.0) |
6.5 |
25.0 |
25.6 |
54.4 |
63.0 |
|
NAV relative to TOPIX TR |
(1.4) |
(1.1) |
4.9 |
21.2 |
21.2 |
38.9 |
51.6 |
|
Price relative to R/Nomura Mid & Small Cap Japan |
(1.1) |
(2.5) |
9.2 |
25.6 |
34.4 |
63.3 |
57.8 |
|
NAV relative to R/Nomura Mid & Small Cap Japan |
(0.2) |
0.4 |
7.5 |
21.8 |
29.8 |
46.9 |
46.8 |
|
Price relative to CBOE UK All Companies |
(4.7) |
(8.8) |
5.6 |
42.1 |
37.3 |
99.0 |
109.1 |
|
NAV relative to CBOE UK All Companies |
(3.9) |
(6.0) |
3.9 |
37.8 |
32.5 |
79.0 |
94.6 |
|
|
Source: Refinitiv, Edison Investment Research. Note: Data to end-February 2021. Geometric calculation. |
||||||||
|
Exhibit 8: NAV performance versus benchmark over three years |
||||||||
|
||||||||
|
Source: Refinitiv, Edison Investment Research |
||||||||
Peer group comparison
FJV has been a member of the Association of Investment Companies’ Japan peer group since May 2018. Before then, it was a member of the Japanese Smaller Companies sector. As the trust retains a bias towards mid-and smaller sized growth companies, Exhibit 9 provides a comparison of the trust’s performance against both these sectors. FJV’s performance ranks second among its current peers in the Japan sector over one and three years, and first over the five years of Price’s tenure as manager. It ranks third over 10 years. It has also outperformed the average of the AIC Japanese Smaller Companies sector over one, three and five years, although the longer-term average is skewed by a strong historical performance from the Baillie Gifford Shin Nippon Trust. FJV’s ongoing charge is slightly above the average of its current peers, but slightly lower than the average of smaller companies funds. None of the funds charges a performance fee, although there is a performance component to FJV’s variable management fee, as discussed below. Its current discount of 6.6% is wider than the average of its current and former peers. All the funds shown use gearing but FJV’s net market gearing is the highest. It is the only trust in its sector not to pay a dividend, although two of its former peers also have zero yields.
Exhibit 9: AIC Japan and Japanese Smaller Companies sectors at 2 March 2021*
% unless stated |
Market |
NAV TR |
NAV TR |
NAV TR |
NAV TR |
Ongoing charge (%) |
Perf fee |
Discount (ex par) |
Net |
Dividend |
|
AIC Japan |
|||||||||||
Fidelity Japan Trust |
285.5 |
44.4 |
41.1 |
145.8 |
243.3 |
1.0 |
No |
(6.6) |
125 |
0.0 |
|
Aberdeen Japan |
97.4 |
29.8 |
24.2 |
75.6 |
163.7 |
1.0 |
No |
(9.2) |
112 |
1.5 |
|
Baillie Gifford Japan |
993.5 |
42.5 |
30.9 |
143.6 |
354.3 |
0.7 |
No |
4.4 |
108 |
0.4 |
|
CC Japan Income & Growth |
176.5 |
15.4 |
7.7 |
73.1 |
|
1.0 |
No |
(12.9) |
121 |
3.5 |
|
JPMorgan Japanese |
1,052.5 |
51.7 |
45.1 |
127.9 |
252.0 |
0.7 |
No |
(2.5) |
115 |
0.8 |
|
Schroder Japan Growth |
243.4 |
17.3 |
5.3 |
63.4 |
135.0 |
0.9 |
No |
(11.3) |
112 |
2.5 |
|
Sector average (6 funds) |
512.7 |
31.3 |
22.6 |
96.7 |
226.3 |
0.9 |
(6.3) |
114 |
1.7 |
||
FJV rank in sector |
3 |
2 |
2 |
1 |
3 |
3 |
3 |
1 |
6 |
||
AIC Japanese Smaller Companies |
|||||||||||
Atlantis Japan Growth |
104.5 |
35.9 |
16.3 |
116.9 |
226.8 |
1.6 |
No |
(13.1) |
106 |
1.3 |
|
AVI Japan Opportunity |
141.9 |
12.7 |
|
|
|
1.0 |
No |
2.0 |
112 |
0.0 |
|
Baillie Gifford Shin Nippon |
720.0 |
55.3 |
30.6 |
158.3 |
532.8 |
0.7 |
No |
1.9 |
105 |
0.0 |
|
JPMorgan Japan Smaller Cos |
275.8 |
36.5 |
23.3 |
108.8 |
240.0 |
1.1 |
No |
(7.5) |
106 |
3.8 |
|
Sector average |
310.6 |
35.1 |
23.4 |
128.0 |
333.2 |
1.1 |
(4.2) |
107 |
1.3 |
||
Source: Morningstar, Edison Investment Research. Note: *Performance to 1 March 2021 based on ex-par NAV. TR=total return. Net gearing is total assets less cash and equivalents as a percentage of net assets.
Discount: Extending its long-term narrowing trend
After a volatile start to 2020, which saw FJV’s share price discount to cum-income NAV widen briefly to 22.1% and a subsequent period where the discount traded around 10%, FJV’s discount began to narrow in late 2020. This extended the discount’s long-term trend of narrowing. At 2 March 2021, FJV’s discount stood at 6.6%, compared to average discounts of 8.4% over one year, 9.3% over three years, 11.2% over five years and 12.0% over 10 years. The board actively manages the discount and the trust has been repurchasing shares intermittently in recent years (Exhibit 11). The discount has scope to continue its narrowing trend if FJV’s performance remains strong and/or investor interest in the Japanese market increases.
|
Exhibit 10: Discount over three years |
Exhibit 11: Buybacks and issuance |
|
|
|
Source: Refinitiv, Edison Investment Research |
Source: Morningstar, Edison Investment Research |
|
Exhibit 10: Discount over three years |
|
|
Source: Refinitiv, Edison Investment Research |
|
Exhibit 11: Buybacks and issuance |
|
|
Source: Morningstar, Edison Investment Research |
Fund profile: Capital growth from overlooked stocks
FJV aims to achieve long-term capital growth by investing in reasonably priced Japanese companies across the market capitalisation spectrum. Launched in 1994, it has been managed since September 2015 by Nicholas Price, who has been a member of Fidelity’s Tokyo-based Japanese equities team since 1993. Price’s investment process (see below) leads him to invest more in under-researched small- and mid-cap companies. Since May 2018, the trust has measured its performance versus the broad Japanese index, the TOPIX (in sterling), and is a member of the Association of Investment Companies’ Japan sector. Before May 2018, it used a mid- and small-cap index and was in the AIC Japan Smaller Companies sector, but the new index and peer group are felt to represent the wider opportunity set more accurately. Given its focus on long-term capital growth and the low level of dividends historically on offer from Japanese companies (particularly in the small- and mid-cap space) compared with some other markets, FJV has not paid a dividend for more than 20 years. The trust does not use any currency hedging. As most of its investments and income are denominated in yen and its functioning currency is sterling, this means that the trust is exposed to exchange rate fluctuations between yen and sterling.
Investment process: Seeking under-researched names
FJV’s investment process is bottom-up and research intensive, drawing on the resources and ideas of Fidelity’s large Tokyo-based Japanese equities team, which includes 11 analysts. The manager’s approach focuses on companies where there is a difference of opinion on growth prospects and a clear disconnect between short-term sentiment and medium- to long-term fundamentals. This applies equally to buying and selling decisions. A combination of poor sentiment and good fundamentals is interpreted as signalling a possible entry point, while overoptimism coupled with declining fundamentals is likely to trigger an exit. The team looks for signs of change, whether in management, style, a new product cycle or a new strategy, that could alter the growth rate of a company.
The Japanese stock market is large, with c 3,800 listed companies, but a lack of sell-side coverage, particularly amongst smaller-cap companies gives Fidelity’s on-the-ground team a significant potential advantage in terms of uncovering opportunities. The manager also talks to Fidelity’s wider teams, for example about market dynamics in China, which could affect Japanese companies. Price personally meets c 350 companies a year, mainly with analysts, although typically c 20–30% of the FJV portfolio is held in companies that he has identified from his own research.
The manager describes FJV as ‘index agnostic’, although it is heavily focused on the small- and mid-cap segment (Exhibit 4) because of the large opportunity set in companies that may be overlooked by the wider market. Candidates for inclusion in the portfolio should offer good growth potential over a three- to five-year horizon, with reasonable valuations, shareholder-friendly management, and a return on equity above 10%. Portfolio turnover tends to be in the range of 70–100% pa as a result of the manager’s sell discipline, which he characterises as ‘selling what has gone up and recycling into new ideas’. Up to 10% of the portfolio may be held in pre-IPO or unlisted stocks; typically those expected to list within one to two years.
FJV’s approach to ESG
FJV’s manager is looking for companies with the capacity to grow sustainably over the medium term. For him, as for all of Fidelity’s analysts and managers, the consideration of environmental, social and governance (ESG) factors is an integral part of his in-depth fundamental research, as such considerations can help distinguish well-run companies with sustainable growth paths from potentially problematic ones. Price also engages with the management of FJV’s holdings, with the aim of continually improving the sustainability and governance of their businesses, and he believes that such improvements should enhance the investment returns of these holdings over time. Price cites Olympus as an example of a key portfolio holding with improving ESG credentials. In addition to the contribution the company makes to universal healthcare provision via its production of endoscopes, its new management team is focused on streamlining the business, conducting buybacks and exiting its loss-making camera business, while also demonstrating a strong commitment to governance reforms.
Gearing
In common with its Fidelity stablemates, FJV uses long contracts for difference (CFDs) rather than a borrowing facility to provide its gearing. Gearing is permitted up to 40% of net assets, although anything over 25% requires prior board approval. CFDs are derivative contracts that allow the manager to increase exposure to individual stocks at a fraction of the cost of buying them outright. Over the past year, FJV’s net gearing has ranged from 20.5% (the level at 31 January 2020) to a peak of 26.6% (at 31 August 2020). At end January 2021, net gearing was 25.3%.
The manager increased the level of gearing during the first half of 2020 as the market correction created opportunities to add or increase positions in high-conviction growth stocks across the communications, technology and healthcare sectors. However, the level of gearing has since declined slightly due to profit taking and the manager expects gearing to fall further as more stocks approach their target prices and are sold, although he points out the future level of gearing will also be dependent on the number of new ideas generated.
Fees and charges
FJV pays Fidelity a base management fee of 0.70% of net assets per year (charged to the revenue account). There is also a performance-related variable element to the fee, which may rise to a maximum of 0.90% if FJV outperforms the TOPIX index, or fall to a minimum of 0.50% if it underperforms. The variable element is charged or credited to the capital account. In H120, FJV paid management fees of £768k. There was no performance-related adjustment to this figure. Ongoing charges stood at 0.98% at end January 2021.
Capital structure
FJV is a conventional investment trust with one class of share. At 2 March 2021, there were 130.4m ordinary shares in issue, with a further 5.8m held in treasury. The trust regularly buys back shares (subject to an annual limit of 14.99% of shares in issue) to manage its discount to NAV (Exhibit 11). In the financial year ended 31 December 2020, 2.7m shares were repurchased and a further 0.2m have been repurchased so far in FY21. The board also has authority to allot shares up to 5% of the issued share capital each year to manage a premium to NAV.
The board
Exhibit 12: FJV’s board of directors
Board member |
Date of appointment |
Annual fee* |
Shareholdings* |
David Robins (chairman) |
February 2011 |
£37,000 |
37,000 |
David Graham (audit committee chair) |
May 2018 |
£30,000 |
38,394 |
Sarah MacAulay |
May 2018 |
£26,000 |
92,350 |
Dominic Zeigler) |
November 2014 |
£26,000 |
16,000 |
David Barron |
October 2020 |
£26,000 |
N/A |
Source: Fidelity Japan Trust. Note: *At end June 2020.
Board members Sir Laurence Magnus and Phillip Kay stepped down in May 2020 and December 2020 respectively.
|
|
Research: Consumer
Evolva’s order intake in FY20 was over CHF10m for the first time, with market share gains across business segments and continued strong momentum in Health Ingredients. Due to an order backlog of CHF3.6m, however, reported sales were CHF7.5m vs our forecast of CHF9.8m. There were delays in manufacturing owing to ongoing issues with Evolva’s contract manufacturers (CMOs) and, to compound this, demand in Flavours & Fragrances (F&F) continues to be subdued. FY21 reported EBITDA and operating cash flow are now expected to be in line with FY20 levels, with current guidance assuming there will be pandemic-related effects on the business for most of the year. Importantly, however, the guidance to break-even at the cash level by FY23 remains unchanged.