Last close As at 05/08/2026
—
— 0.00 (0.00%)
Market capitalisation
—
Research: Investment Companies
Acorn Income Fund (AIF) aims to achieve a high income and potential for capital growth by investing 70-80% of its assets in a portfolio of well-financed UK smaller companies with attractive valuations and dividend growth, and 20-30% in high-yielding securities to add income and reduce capital risk. While long-term performance has been strong, the immediate aftermath of the UK’s vote to leave the EU caused a decline in domestically focused small caps. Since the half-year (30 June), AIF’s NAV has recovered well and now stands at an all-time high; in contrast, the share price is more than 7% below its 12-month high, suggesting scope for the wider-than-average discount to narrow. AIF gears its portfolio using zero-dividend preference shares (ZDPs); shareholders recently approved a proposal to extend the life of the ZDPs to February 2022 at an accrual rate of 3.85% pa.
Written by
Acorn Income Fund |
Managers broadly positive for small caps in 2017 |
Investment companies |
9 January 2017 |
Share price/discount performance
Three-year performance vs index
Gearing (including ZDPs)
Analyst
|
|||||||||||||||||||||||||||||||||||||||||||||||||||||||||||||||||||||||||||||||||||||||
Acorn Income Fund (AIF) aims to achieve a high income and potential for capital growth by investing 70-80% of its assets in a portfolio of well-financed UK smaller companies with attractive valuations and dividend growth, and 20-30% in high-yielding securities to add income and reduce capital risk. While long-term performance has been strong, the immediate aftermath of the UK’s vote to leave the EU caused a decline in domestically focused small caps. Since the half-year (30 June), AIF’s NAV has recovered well and now stands at an all-time high; in contrast, the share price is more than 7% below its 12-month high, suggesting scope for the wider-than-average discount to narrow. AIF gears its portfolio using zero-dividend preference shares (ZDPs); shareholders recently approved a proposal to extend the life of the ZDPs to February 2022 at an accrual rate of 3.85% pa.
12 months ending |
Share price |
NAV (%) |
Acorn ZDPs |
Numis Smaller Cos ex-ICs (%) |
FTSE All-Share (%) |
31/12/12 |
60.6 |
48.2 |
13.5 |
29.9 |
12.3 |
31/12/13 |
63.9 |
41.8 |
6.6 |
36.9 |
20.8 |
31/12/14 |
(12.9) |
(2.7) |
6.8 |
(1.9) |
1.2 |
31/12/15 |
36.0 |
21.5 |
1.9 |
10.6 |
1.0 |
31/12/16 |
(7.2) |
6.0 |
5.8 |
11.1 |
16.8 |
Source: Thomson Datastream. Note: All % on a total return basis in GBP.
Investment strategy: Growing income and capital
AIF’s smaller companies and income portfolios are advised respectively by Unicorn Asset Management (Simon Moon & Fraser Mackersie) and Premier Fund Managers (Paul Smith). Moon and Mackersie seek to hold a maximum of 50 stocks that are well financed, well managed and have competitive advantages in growing end markets, as well as offering either a current high yield or prospective dividend growth. Smith selects securities to enhance the overall portfolio yield, as well as providing a hedge against small-cap volatility and partially offsetting the ZDP liability.
Market outlook: Broad recovery from Brexit lows
After the sharp sell-off in the wake of the Brexit vote last June, the large-cap FTSE 100 index rallied strongly and ended the year at a new all-time high, suggesting a greater degree of investor confidence than was the case for much of 2016. The mid-cap FTSE 250 and FTSE Small Cap indices also gained c 20% from the June low. The beginning of a rotation away from stocks seen as bond proxies could mean that higher-yielding and more cyclical stocks will take centre stage in a continued recovery, although there is scope for further macro-induced uncertainty.
Valuation: Discount yet to reflect NAV upturn
At 5 January, AIF’s ordinary shares traded at a 10.6% discount to cum-income NAV. This is wider than both short- and longer-term averages, although it is broadly in line with average discounts for pure UK smaller companies trusts. Given recent stronger NAV performance, a dividend yield of more than 4% and an attractive level of dividend growth (FY16 dividend up 12.7% on FY15), we believe there is scope for the discount to narrow to a level more in line with the fund’s history.
Exhibit 1: Fund at a glance
Investment objective and fund background |
Recent developments |
|||||||||||||||||||||||||||||||||||||||||||||||||||||||||||||||||||||||||||||||||||||||||||||||||||||||
AIF’s objective is to provide a high level of income with the opportunity for capital growth. The portfolio is split into two pools: one (70-80% of assets) is invested in UK small-cap equities; the other is an income portfolio containing fixed-income instruments, convertibles and high-yielding shares in other investment companies. Performance is measured against the Numis Smaller Companies (excluding investment companies) index. |
■ 21 December 2016: Ordinary and ZDP shareholders approve the continuation offer of ZDPs, the adoption of new articles of association to facilitate the continuation offer, and the issue of new ZDPs and ordinary shares on a non-pre-emptive basis. ■ 6 December 2016: Fourth interim dividend of 4.0p announced, bringing the total dividend for the year to 15.5p, a 12.7% increase on FY15. ■ 29 November 2016: New ZDP issue proposed to replace maturing 2017 ZDPs. |
|||||||||||||||||||||||||||||||||||||||||||||||||||||||||||||||||||||||||||||||||||||||||||||||||||||||
Forthcoming |
Capital structure |
Fund details |
||||||||||||||||||||||||||||||||||||||||||||||||||||||||||||||||||||||||||||||||||||||||||||||||||||||
AGM |
September 2017 |
Ongoing charges |
1.6% (30 June 2016) |
Group |
Premier Fund Managers |
|||||||||||||||||||||||||||||||||||||||||||||||||||||||||||||||||||||||||||||||||||||||||||||||||||
Annual results |
March/April 2017 |
Net gearing |
34.3% (via ZDPs) |
Manager |
Simon Moon, Fraser Mackersie (Unicorn), Paul Smith (Premier) |
|||||||||||||||||||||||||||||||||||||||||||||||||||||||||||||||||||||||||||||||||||||||||||||||||||
Year end |
31 December |
Annual mgmt fee |
0.7% of total assets |
Address |
Eastgate Court, High Street, Guildford GU1 3DE |
|||||||||||||||||||||||||||||||||||||||||||||||||||||||||||||||||||||||||||||||||||||||||||||||||||
Dividend paid |
Quarterly |
Performance fee |
Yes, see p7 |
|||||||||||||||||||||||||||||||||||||||||||||||||||||||||||||||||||||||||||||||||||||||||||||||||||||
Launch date |
11 February 1999 |
Trust life |
Indefinite, subject to vote |
Phone |
+44 (0)1483 30 60 90 |
|||||||||||||||||||||||||||||||||||||||||||||||||||||||||||||||||||||||||||||||||||||||||||||||||||
Continuation vote |
Five-yearly, next 2021 |
Loan facilities |
None |
Website |
||||||||||||||||||||||||||||||||||||||||||||||||||||||||||||||||||||||||||||||||||||||||||||||||||||
Dividend policy and history |
Share buyback policy and history |
|||||||||||||||||||||||||||||||||||||||||||||||||||||||||||||||||||||||||||||||||||||||||||||||||||||||
Quarterly dividends are paid in March, June, September and December; higher dividends since 2011 facilitated by ZDP issue, which eliminated interest costs. |
ZDPs are issued and bought back at the same time as ordinary shares in quantities such that the ratio of ZDPs to ordinary shares is maintained. |
|||||||||||||||||||||||||||||||||||||||||||||||||||||||||||||||||||||||||||||||||||||||||||||||||||||||
|
|
|||||||||||||||||||||||||||||||||||||||||||||||||||||||||||||||||||||||||||||||||||||||||||||||||||||||
Shareholder base (as at 15 December 2016) |
Portfolio exposure by market cap (as at 31 October 2016) |
|||||||||||||||||||||||||||||||||||||||||||||||||||||||||||||||||||||||||||||||||||||||||||||||||||||||
|
|
|||||||||||||||||||||||||||||||||||||||||||||||||||||||||||||||||||||||||||||||||||||||||||||||||||||||
Top 10 holdings* (as at 31 December 2016) |
||||||||||||||||||||||||||||||||||||||||||||||||||||||||||||||||||||||||||||||||||||||||||||||||||||||||
|
||||||||||||||||||||||||||||||||||||||||||||||||||||||||||||||||||||||||||||||||||||||||||||||||||||||||
Source: Acorn Income Fund, Edison Investment Research, London Stock Exchange, Morningstar. Note: *All of the top 10 are constituents of the smaller companies portfolio. **N/A where not in December 2015 top 10.
Recent developments: New issue of ZDPs
The year ended 31 December 2016 saw two significant developments for AIF. In September, shareholders voted for the continuation of the fund for another five years. Then in December, with the 2017 ZDPs approaching their maturity date of 31 January, holders of the ordinary shares and ZDPs approved proposals to extend the life of the ZDPs to 28 February 2022.
The ZDPs were issued with a final capital entitlement of 138p at 31 January 2017; following the extension they will have a final capital entitlement of 167.2p, equating to a gross redemption yield of 3.85% pa from 31 January 2017 to 28 February 2022, compared with 6.5% for the original issue. This reflects the lower level of bond yields compared with 2011 when the 2017 ZDPs were issued, although it is still higher than returns on cash or many bond investments. The lower accrual rate means the benefit of gearing for the ordinary shareholders will be felt more quickly. While the return is not guaranteed, AIF’s gross assets would have to fall by 15.9% each year until February 2022 for the final entitlement not to be met. An investor who bought the ZDPs at issue in 2011 and opts to roll over their holding until the new redemption date would see an annual return over the whole period equivalent to 5.17%. Holders who do not elect for the rollover will receive the final capital entitlement as cash. Investors may elect to roll over a portion of their holding and receive the rest in cash.
Since the first ZDP issue in December 2011, AIF has sought to maintain the ratio of ordinary shares to ZDPs at the same level (1:1.342), issuing and repurchasing ordinary shares and ZDPs in the same proportions to manage a discount or a premium. This practice will continue following the rollover of the ZDPs, and AIF has also proposed the issue of new ordinary and ZDP shares (allowing non-holders of the 2017 ZDPs to participate in the 2022 ZDPs).
Fund profile: Small-cap growth with income discipline
AIF, launched in 1999, is incorporated in Guernsey and listed in London. It aims to achieve a high income and the potential for growth of capital by blending a portfolio of small- and mid-cap UK equities with a smaller allocation to high-yielding securities. In 2011, an issue of ZDPs allowed for the repayment of debt, eliminating interest costs and facilitating the payment of a higher level of quarterly dividends. These ZDPs mature on 31 January 2017 and shareholders have approved a new issue, maturing in February 2022, to replace them (see above).
AIF is managed by Premier Asset Management (Guernsey), with management of the portfolios subcontracted to two investment advisers. Simon Moon and Fraser Mackersie at Unicorn Asset Management run the smaller companies portfolio (70-80% of assets), while the income portfolio (20-30% of assets) is advised by Paul Smith at Premier Fund Managers in Guildford.
The fund uses the Numis Smaller Companies index (ex-investment companies) as a performance benchmark, although its portfolio construction differs materially from the index because of the relatively short stock list (maximum 50 holdings) of the smaller companies portfolio, a greater focus on companies at the smaller end of the capitalisation spectrum, and the allocation to the income portfolio. The fund has a strong longer-term performance record and over 10 years its NAV total return is almost 100 percentage points ahead of the second-placed fund in its peer group.
The fund managers: Moon, Mackersie and Smith
The managers’ view: Better times ahead for smaller stocks?
Smaller companies portfolio managers Simon Moon and Fraser Mackersie at Unicorn are entering 2017 in a broadly positive mood, arguing that the well-financed, dividend-paying smaller companies they invest in currently represent a pocket of value, albeit with the potential for higher levels of volatility. Challenging conditions over the past 12 months, which saw investors reacting in sometimes extreme fashions to unexpected macro events, have started to abate, with an increased focus on fundamentals beginning to emerge. The immediate aftermath of the UK’s vote to leave the EU saw domestically focused smaller companies suffer as investors sought the relatively safety of international earners and bond proxy stocks. However, Moon and Mackersie say that in a higher-inflation environment, bond proxies look less compelling than they have done for a number of years, with stretched levels of dividend cover limiting future growth prospects. In contrast, they point to the well-covered and growing 4.5% dividend yield on the AIF small-cap portfolio (excluding gearing), which underscores their broadly positive outlook. Furthermore, the depreciation of sterling has made some companies look relatively more attractive to overseas acquirers, which means increased M&A activity in the portfolio is a possibility. The managers see this as more of an opportunity than a threat; bid rumours or approaches may drive up the price of a stock to a level at which its dividend yield looks less compelling, and with valuations in many areas looking attractive and a maximum stock list of 50, they say they have no shortage of investment ideas to replace any holdings that are taken out, although they remain aware of the potential for further market volatility.
In the income portfolio, manager Paul Smith is happy to run with the minimum 20% allocation, given challenging conditions in fixed income markets and the comparatively better outlook for small-cap equities. Smith sees very limited value in sovereign bonds, and increased risk in corporate bonds, where yield spreads are becoming compressed as sovereign bond yields rise. He continues to run the portfolio with an absolute return focus, blending income-focused closed-end funds with high-yielding smaller bond issues and some structured investments. The manager uses bond futures as a hedge to reduce the portfolio duration.
Asset allocation
Investment process: Quality small-cap growth and income
AIF’s managers view a neutral allocation between the two portfolios as 75% smaller companies and 25% income. Recently the smaller companies portfolio has accounted for the maximum permitted 80% of the total, in recognition of comparatively better opportunities in the small-cap equity space and more challenging fixed income markets.
Smaller company portfolio managers Simon Moon and Fraser Mackersie hold a maximum of 50 stocks, a discipline they say helps ensure only their best investment ideas are included. Holdings must be profitable and should be well financed, with high operating margins and competitive advantages in growing end markets. While a high yield is not a prerequisite, companies must be on a clear path to paying dividends if they do not do so already. The managers employ screens to help filter the large universe of small- and mid-cap stocks. Quantitative screens assess profitability, income (yield and dividend cover) and growth, while qualitative tests measure factors including competitive advantage and end markets. Meetings with companies are a key part of the process, as analyst coverage of smaller companies is often patchy, and the managers undertake c 400 meetings a year with existing and potential holdings to build a detailed understanding.
The portfolio spans the small- and mid-cap markets, with 53% of the portfolio currently invested in companies with market capitalisations below £250m. Some 38% of holdings are listed on the Alternative Investment Market (AIM). Partly because of the generally lower level of liquidity in such stocks, the managers do their own dealing rather than relying on a centralised function, allowing them to make best use of their networks and be patient in building and selling down stakes. The most common reason for exiting a position is where strong performance has driven down the dividend yield; the managers say they are usually able to find good companies with higher yields and more attractive valuations to replace these holdings.
The income portfolio is managed with the aim of boosting the overall yield, providing a hedge against small-cap volatility, and partially offsetting the liability of the ZDPs. Manager Paul Smith also looks after any uninvested cash from the small-cap allocation. While the allocation to the income portfolio is smaller at 20-30% of total assets, the stock list is longer than for the smaller companies portfolio, enabling the manager to reduce risk further and tackle low liquidity in bond markets, while also giving him access to smaller bond issues such as retail bonds. While Smith is aware of the macro environment for bonds, holdings are chosen on a bottom-up basis and may include income-focused investment companies and trusts as well as more straightforward bonds.
Current portfolio positioning
During 2016, the managers of AIF’s smaller companies portfolio have purchased 10 holdings and sold five, and currently hold close to their maximum permitted 50 stocks. Four of the exits (VP, Diploma, British Polythene Industries and DX Group) and six of the acquisitions (Card Factory, Wincanton, Greene King, Midwich, BBA Aviation and Morses Club) were covered in our last note. The fifth sale was the result of a takeover bid in September for UK Mail by Deutsche Post DHL. A bid approach for Lavendon in November saw the share price of the machinery hire firm rise by c 90%, making it one of the lowest-yielding stocks in the portfolio, and it has since been sold.
Two of the recent purchases, Warpaint and Van Elle, were bought at IPO (as were Midwich and Morses Club). Warpaint makes the affordable cosmetics range W7, and Moon and Mackersie see it as sharing similar characteristics with fashion retailers Boohoo.com and ASOS, with a quicker R&D turnaround than major cosmetics players, meaning that like the ‘fast fashion’ brands, it can release a new line in a matter of weeks versus as much as a year. Van Elle makes specialist piling equipment and has a large exposure to construction, infrastructure and housebuilding. The managers have also bought environmental consultancy RPS, already a holding in their larger income funds, after a period of weak performance; since purchase the shares are up more than 20%.
|
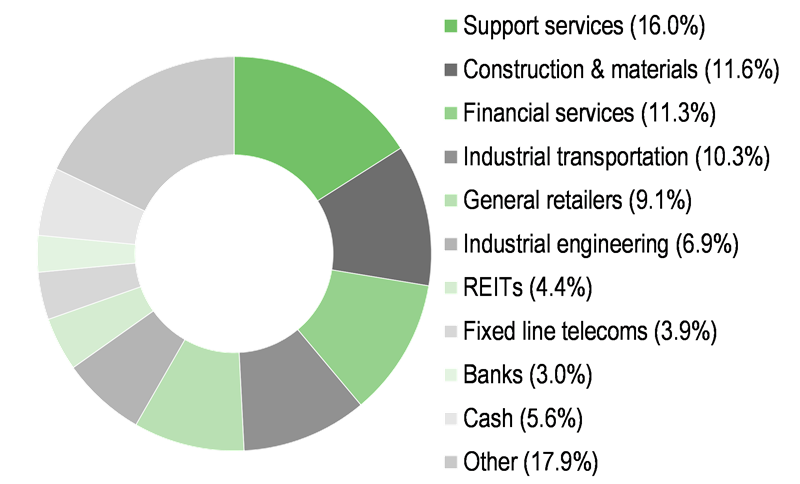
Exhibit 3: Sector exposure of income portfolio |
Exhibit 4: Sector exposure of small-cap portfolio |
|
|
|
Source: Acorn Income Fund, as at 31 December 2016 |
|
Exhibit 3: Sector exposure of income portfolio |
|
|
Source: Acorn Income Fund, as at 31 December 2016 |
|
Exhibit 4: Sector exposure of small-cap portfolio |
|
|
Source: Acorn Income Fund, as at 31 December 2016 |
In sector terms (Exhibit 4), the smaller companies portfolio is well spread, with a bias to industrial sectors, although the managers continue to hold no metals/mining, oil & gas, healthcare or utilities.
The income portfolio (Exhibit 3) is also broadly diversified by sector, and has a longer stock list than the small-cap portfolio, at c 70 positions. The largest allocation is to closed-end funds, which includes the top 10 holdings Real Estate Credit Investments, DW Catalyst Fund (a long/short credit hedge fund) and JPMorgan Global Convertibles Income Fund. Convertible bonds also feature in other areas of the portfolio, from issuers such as Debenhams, Enterprise Inns and property developer Helical. A degree of inflation protection comes from some short-dated index-linked UK government and Tesco bonds. Structured investments (see ‘The managers’ view’ in our last note) have contributed to the portfolio’s recent outperformance versus bond indices.
Capital structure and fees
AIF is a Guernsey-incorporated closed-end investment company with two classes of share. There are currently 15.9m ordinary shares and 21.4m 2017 ZDPs in issue, maturing on 31 January 2017 with a final capital entitlement of 138p. On 21 December 2016, AIF’s ordinary and ZDP shareholders approved a proposal to extend the life of the ZDPs beyond the 31 Jan maturity date, with a final capital entitlement of 167.2p on 28 February 2022 (see ‘Recent developments’, page 3). Based on 31 December net asset values, AIF currently has gross gearing via the ZDPs of 45.1%.
The fund pays an annual management fee of 0.7% of total assets to Premier Asset Management (Guernsey), from which fees are paid to the investment advisers. A performance fee of 15% of outperformance is payable if the NAV per share plus dividends has grown at a compound rate of more than 10% a year since the last year-end at which a performance fee was payable. A performance fee was last paid in respect of FY13. Ongoing charges were 1.6% as at end H116.
Dividend policy and record
As an income fund, AIF aims to pay a high and growing dividend to its ordinary shareholders. Dividends are paid quarterly, in March, June, September and December. For FY16, the fund has declared total dividends of 15.5p, an increase of 12.7% on the FY15 dividend. The dividend has more than doubled since 2011. Over the past four financial years AIF’s dividend has grown at a compound rate of 6.6%, significantly ahead of the rate of UK inflation. Going back five years to 2011, the compound annual growth rate is 17.2%. Dividends have been fully covered by income for the last five financial years to FY15. Based on the 5 January share price of 366.0p and the FY16 total dividend of 15.5p, AIF currently yields 4.2%, with a prospective yield of 4.4% if the next quarterly dividend matches the 4.0p level of the last three.
Peer group comparison
Exhibit 9 below shows the AIC’s UK Equity & Bond Income sector, of which AIF is a member. The peers all blend equity and fixed income investments, but the proportions in each asset class vary and most have a larger-cap equity focus than AIF. In performance terms, AIF ranks first for NAV total return over five and 10 years and second over three years, though it is in last place over one year (only 1.4pp separates the bottom four funds, however). Risk-adjusted performance as measured by the Sharpe ratio is largely in line with the average over one and three years. AIF’s discount to NAV is currently the second widest in the group, while the ZDPs mean it has the highest level of gearing. The 4.3% dividend yield ranks the fund in mid-table, while ongoing charges are higher than the average but broadly in line with arguably the most similar peer, Aberdeen Smaller Companies Income.
Exhibit 9: AIC UK Equity & Bond Income peer group as at 22 December 2016
% unless stated |
Market cap £m |
TR |
TR |
TR |
TR |
Ongoing charge |
Perf. |
Discount (ex-par) |
Net |
Dividend yield (%) |
Sharpe 1y (NAV) |
Sharpe 3y (NAV) |
Acorn Income Fund |
57.2 |
7.4 |
26.3 |
168.3 |
210.2 |
1.6 |
Yes |
(10.5) |
135 |
4.3 |
(0.7) |
(0.2) |
Aberdeen Smaller Cos Income |
45.0 |
8.0 |
19.6 |
129.6 |
50.9 |
1.5 |
No |
(20.6) |
111 |
3.4 |
(0.6) |
(0.3) |
City Merchants High Yield |
176.7 |
11.9 |
20.6 |
68.4 |
109.5 |
1.0 |
No |
3.3 |
100 |
5.2 |
(0.7) |
(0.4) |
CQS New City High Yield |
210.8 |
8.8 |
14.5 |
50.9 |
112.8 |
1.2 |
No |
3.5 |
109 |
7.5 |
(1.0) |
(0.6) |
Henderson High Income |
203.2 |
11.9 |
27.8 |
104.5 |
89.6 |
0.8 |
Yes |
0.8 |
123 |
5.0 |
(0.6) |
(0.1) |
Investors Capital A Share |
116.1 |
16.6 |
20.0 |
63.2 |
-- |
1.1 |
No |
(7.5) |
101 |
5.1 |
(0.3) |
(0.2) |
Investors Capital B Share |
116.4 |
16.6 |
20.0 |
75.3 |
-- |
1.1 |
No |
(7.2) |
95 |
0.0 |
(0.3) |
(0.2) |
Investors Capital Units |
123.7 |
16.6 |
20.0 |
63.2 |
-- |
1.0 |
No |
(7.9) |
100 |
4.1 |
(0.3) |
(0.2) |
Jupiter Dividend & Gth Common |
9.3 |
8.3 |
25.5 |
79.0 |
-- |
1.3 |
Yes |
(1.8) |
100 |
3.8 |
(0.5) |
(0.1) |
Sector weighted average |
12.5 |
20.8 |
79.5 |
109.2 |
1.1 |
(2.6) |
108 |
5.4 |
(0.6) |
(0.3) |
||
AIF rank in sector |
7 |
9 |
2 |
1 |
1 |
9 |
8 |
1 |
5 |
8 |
3 |
Source: Morningstar, Edison Investment Research. Note: TR=NAV total return. Sharpe ratio is a measure of risk-adjusted return. The ratios shown are calculated by Morningstar for the past 12- and 36-month periods by dividing a fund’s annualised excess returns over the risk-free rate by its annualised standard deviation. Net gearing is total assets less cash and equivalents as a percentage of net assets (100 = ungeared).
The board
AIF has three non-executive directors, all independent of the manager. Helen Green has served as chairman since 2012, having joined the board in 2007. Nigel Ward and David Warr were appointed respectively in 2011 and 2012. The directors are all resident in Guernsey (where AIF is incorporated) and have professional backgrounds in accountancy and investment management.
|
|