Last close As at 05/08/2026
—
— 0.00 (0.00%)
Market capitalisation
—
Research: Investment Companies
Acorn Income Fund (AIF) has seen its NAV performance stabilise since the COVID-19 driven sell-off earlier this year, although it remains considerably below its 12-month high, suggesting significant recovery potential. Small-cap portfolio managers Simon Moon and Fraser Mackersie point to the robust balance sheets of the companies they own, many of which have continued to pay dividends while some UK blue-chips have cut payments; they have also added to their own holdings in AIF given the attractive 8.8% dividend yield. In the income portfolio (c 25% of assets), managers Chun Lee and Robin Willis have taken advantage of better-value sterling bonds and high-yielding investment companies at deep discounts, helping AIF to support another year of dividend growth (part-funded from reserves).
Written by
Acorn Income Fund |
Looking ahead with cautious optimism |
Investment companies |
3 November 2020 |
Share price/discount performance
Three-year performance vs index
Gearing
Analysts
|
|||||||||||||||||||||||||||||||||||||||||||||||||||||||||||||||||||||||||||||||||||||||||||||||||
Acorn Income Fund (AIF) has seen its NAV performance stabilise since the COVID-19 driven sell-off earlier this year, although it remains considerably below its 12-month high, suggesting significant recovery potential. Small-cap portfolio managers Simon Moon and Fraser Mackersie point to the robust balance sheets of the companies they own, many of which have continued to pay dividends while some UK blue-chips have cut payments; they have also added to their own holdings in AIF given the attractive 8.8% dividend yield. In the income portfolio (c 25% of assets), managers Chun Lee and Robin Willis have taken advantage of better-value sterling bonds and high-yielding investment companies at deep discounts, helping AIF to support another year of dividend growth (part-funded from reserves).
|
AIF’s long-term record remains positive in absolute and relative terms |
|
|
Source: Refinitiv, Edison Investment Research |
The market opportunity
UK equities have been deeply unloved since the Brexit referendum in June 2016, and have suffered a further setback in the COVID-19 pandemic given the outsize impact of the virus on the country’s service-orientated economy. However, a resolution of the UK’s future relationship with the European Union is on the horizon, allowing asset allocators and company managements alike to move ahead with greater certainty. While some large-cap names have permanently reduced their dividends, many attractive income opportunities still exist in the small-cap sector.
Why consider investing in Acorn Income Fund?
■
It has a unique structure, with income-orientated small-cap UK equity portfolio alongside income portfolio aiming to boost returns and limit volatility.
■
Its high level of gearing through ZDPs has hurt in the sell-off but would be a significant tailwind in a more broad-based recovery.
■
A dividend yield close to 9% looks attractive, backed up by holdings continuing to pay their own dividends or resuming them quickly after suspensions.
High yield and narrowing discount
AIF’s discount has narrowed to 13.5% from 25.3% in July 2020, although it remains well above longer-term averages of 8.2–9.7%. The fund is set to deliver annual dividend growth of 10.6% for FY20 (this will be partly funded from its significant reserves) and currently yields an eye-catching 8.8%.
Exhibit 1: Company at a glance
Investment objective and fund background |
Recent developments |
|||||||||||||||||||||||||||||||||||||||||||||||||||||||||||||||||||||||||||||||||||||||||||||||||||||||||
Acorn Income Fund’s objective is to provide shareholders with a high income and the opportunity for capital growth. The portfolio is split into two pools: one (c 70–80% of assets) is invested in UK small-cap equities; the other is an income portfolio containing fixed-income instruments, convertibles and high-yielding shares in other investment companies. Performance is measured against a composite benchmark: 75% of the Numis Smaller Companies (excluding investment companies) Index and 25% ICE BofAML Sterling Non-Gilts Index. |
■ 17 August 2020: Results for the six months ended 30 June. NAV TR -34.9% and share price TR -38.4% versus -25.0% for the Numis Smaller Companies (ex-ICs) index. The return on gross assets was -21.9%. ■ 17 August 2020: Third quarterly interim dividend of 5.75p declared for Q320, unchanged quarter-on-quarter and +10.6% year-on-year. ■ 11 August 2020: All resolutions passed at AGM. ■ 3 August 2020: N+1 Singer appointed as sole corporate broker. |
|||||||||||||||||||||||||||||||||||||||||||||||||||||||||||||||||||||||||||||||||||||||||||||||||||||||||
Forthcoming |
Capital structure |
Fund details |
||||||||||||||||||||||||||||||||||||||||||||||||||||||||||||||||||||||||||||||||||||||||||||||||||||||||
AGM |
August 2021 |
Ongoing charges |
1.79% (net assets) |
Group |
Premier Miton Asset Management |
|||||||||||||||||||||||||||||||||||||||||||||||||||||||||||||||||||||||||||||||||||||||||||||||||||||
Annual results |
April 2021 |
Gross gearing |
70.3% (via ZDPs) |
Managers |
Simon Moon & Fraser Mackersie (Unicorn); Chun Lee and Robin Willis (Premier Miton) |
|||||||||||||||||||||||||||||||||||||||||||||||||||||||||||||||||||||||||||||||||||||||||||||||||||||
Year end |
31 December |
Annual mgmt fee |
0.7% of total assets |
Address |
Eastgate Court, High Street, |
|||||||||||||||||||||||||||||||||||||||||||||||||||||||||||||||||||||||||||||||||||||||||||||||||||||
Dividend paid |
Quarterly |
Performance fee |
Yes (see page 9) |
|||||||||||||||||||||||||||||||||||||||||||||||||||||||||||||||||||||||||||||||||||||||||||||||||||||||
Launch date |
11 February 1999 |
Company life |
Indefinite, subject to vote |
Phone |
+44 (0) 1483 30 60 90 |
|||||||||||||||||||||||||||||||||||||||||||||||||||||||||||||||||||||||||||||||||||||||||||||||||||||
Continuation vote |
Five-yearly, next 2021 |
Loan facilities |
None |
Website |
||||||||||||||||||||||||||||||||||||||||||||||||||||||||||||||||||||||||||||||||||||||||||||||||||||||
Dividend policy and history (financial years) |
Share buyback policy and history (financial years) |
|||||||||||||||||||||||||||||||||||||||||||||||||||||||||||||||||||||||||||||||||||||||||||||||||||||||||
Dividends are paid quarterly, in March, June, September and December. |
ZDPs are issued and bought back at the same time as ordinary shares, in quantities such that the ratio of ZDPs to ordinary shares is maintained. |
|||||||||||||||||||||||||||||||||||||||||||||||||||||||||||||||||||||||||||||||||||||||||||||||||||||||||
|
|
|||||||||||||||||||||||||||||||||||||||||||||||||||||||||||||||||||||||||||||||||||||||||||||||||||||||||
Shareholder base (at 30 September 2020) |
Small-cap portfolio by market capitalisation (at 30 September 2020) |
|||||||||||||||||||||||||||||||||||||||||||||||||||||||||||||||||||||||||||||||||||||||||||||||||||||||||
|
|
|||||||||||||||||||||||||||||||||||||||||||||||||||||||||||||||||||||||||||||||||||||||||||||||||||||||||
Top 10 holdings* (as at 30 September 2020) |
||||||||||||||||||||||||||||||||||||||||||||||||||||||||||||||||||||||||||||||||||||||||||||||||||||||||||
|
||||||||||||||||||||||||||||||||||||||||||||||||||||||||||||||||||||||||||||||||||||||||||||||||||||||||||
Source: Acorn Income Fund, Edison Investment Research, Bloomberg, Morningstar, LSE. Note: *All of the top 10 at 30 September 2020 are in the smaller companies portfolio. **N/A where not in end-September 2019 top 10.
Market outlook: Opportunities and threats for UK plc
Having entered the year in better shape than for some time as a result of the decisive election victory in December 2019 by Boris Johnson’s Conservative party – seen at the time as likely to ‘get Brexit done’ with minimal disruption, providing greater certainty to the business landscape – UK smaller companies were hit hard by the coronavirus outbreak. With the impact of COVID-19 set to shrink the UK economy by 9.8% in 2020 according to the International Monetary Fund’s October 2020 World Economic Outlook (worse than the euro area in aggregate, and far worse than the US and Asia), firms that are largely exposed to domestic rather than international demand could suffer more, while smaller exporting firms may be worse affected by a cliff-edge Brexit than their blue-chip counterparts.
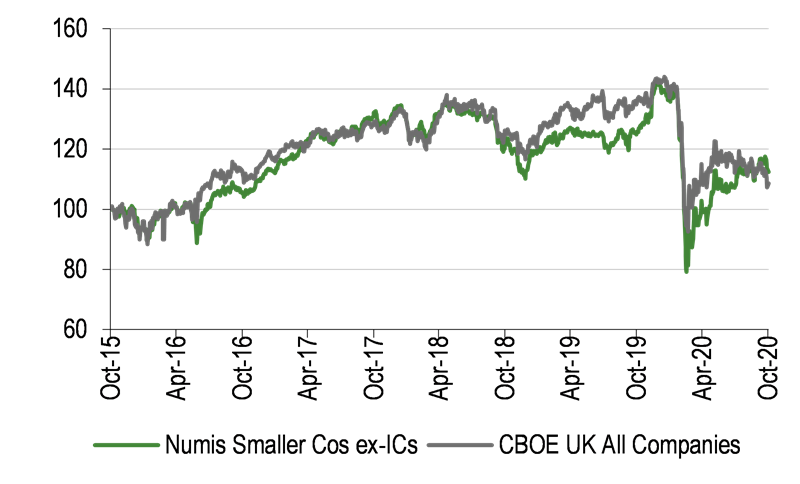
The impact of Brexit fears on the small-cap sector is clearly evident in Exhibit 2. Over a decade to end-October 2020, smaller companies (as measured by the Numis Smaller Companies (excluding investment companies) Index (NSCIX)) have outperformed the broad UK market substantially, with a total return of 112.4% versus 52.5% for the CBOE UK All Companies index. However, most of the relative gain came in the period before the Brexit vote in 2016, and over five years to October, the differential is much smaller, with the NSCIX returning 13.3% versus 7.6% for the broad index.
However, while this may be true at the aggregate level, the UK boasts a number of world-leading and innovative companies in its small-cap sector, many of which are trading well through the pandemic and continuing to pay dividends. Investors who wish to capitalise on the opportunity inherent in a resolution to the Brexit conundrum (which will come, deal or no deal) could be well served by an allocation to these ‘national champions’. In the meantime, a focus on dividends means shareholders can effectively be ‘paid to wait’ for the re-rating.
|
Exhibit 2: Post-Brexit vote period proves challenging for smaller companies |
|
Small-cap (NSCIX) and all-cap (CBOE) index total returns over 10 years |
Small-cap (NSCIX) and all-cap (CBOE) index total returns over five years |
|
|
|
Source: Refinitiv, Edison Investment Research |
|
Fund profile: Unusual structure with income advantage
Acorn Income Fund (AIF) was launched in 1999 as a Guernsey-domiciled, London-listed closed-end fund with the aim of achieving income and capital growth. Since 2011 the fund has had two classes of share: ordinary shares, on which dividends are payable (current yield of 8.8%), and zero-dividend preference shares (ZDPs), which supply the fund’s gearing (70.3% gross at 30 September 2020). Using ZDPs to provide gearing means AIF does not have to pay interest costs during the life of the ZDPs, which in turn means the ordinary shareholders are able to receive a higher annual dividend. The ZDP shares mature in 2022 and have a final capital entitlement of 167.2p; they currently offer a gross redemption yield of 6.5% (30 September 2020).
The fund has a dual portfolio structure, with c 70–80% invested in a portfolio of (usually) dividend-paying UK smaller companies, while c 20–30% is held in an income portfolio of bonds and other securities. The smaller companies portfolio is managed by Simon Moon and Fraser Mackersie at Unicorn Asset Management; they have worked together on the fund since 2013, taking sole charge of the portfolio in mid-2014. The income portfolio is managed by Chun Lee and Robin Willis at Premier Miton. Premier Asset Management (Guernsey), a subsidiary of Premier Miton, acts as AIF’s investment manager.
AIF is a member of the Association of Investment Companies’ UK Equity & Bond Income sector. It uses a benchmark made up 75% of the NSCIX, and 25% of the ICE BofAML Sterling Non-Gilts Index. However, the benchmark acts purely as a performance measure, with portfolio construction being unconstrained and bottom-up.
The fund managers: Moon & Mackersie, Lee & Willis
The managers’ view: Strong balance sheets underpin recovery
While the COVID-19 pandemic has undoubtedly had a severe impact on the income streams of many companies – particularly those that effectively saw activity grind to a halt during the lockdown earlier this year – Moon and Mackersie are encouraged by the pace at which businesses are recovering. ‘We are fairly upbeat about how we are seeing things,’ says Mackersie. ‘Companies’ trading updates are encouraging; there was a lot of uncertainty in March and April but it is now much clearer in terms of the demand for goods and services and the steps firms are taking in managing costs and cash. Updates continue to show a gradual – and in some cases rapid – improvement, and that is flowing through to progress on dividends.’
At the height of the market uncertainty, the managers grouped the companies in the portfolio under three headings according to the impact they thought the pandemic would have on dividends:
■
Continuity – companies that could continue trading and paying their dividends normally.
■
Resilience – those businesses that would see an impact but could carry on trading well and recover. Dividends would still be paid but at a lower level.
■
Recovery – companies that would need to suspend dividends and potentially raise capital, but that offer both capital and income recovery potential in the future.
The managers have always emphasised the importance of owning well- or conservatively financed businesses. Moon says: ‘The portfolio went into the tumult with a very strong balance sheet – about half of our companies have net cash, and of those with net debt, on average that is just over 1x EBITDA, so our companies are better financed than the market average. That enables us to have a lot more certainty on the resumption of dividend payments; companies are taking a revenue hit but they do not have burdensome debt servicing costs, so they can resume paying more quickly.’
While smaller companies may be seen as more vulnerable in the current environment, Mackersie says the context of dividend cuts for the broader UK market has been underestimated. ‘We will need four quarters of lower dividends from Shell, BP and so on to see the real impact,’ he says. ‘Sustainable quality income is important, and a lot of income fund managers will have to change their approach and adapt. We have not had to do that – our portfolio is more robust than the broad market and much more robust than the small and mid-cap market, with an unchanged policy, and not a lot of people can say that.’
The income portfolio is arguably more affected by the macro backdrop, and Lee says that while bond valuations still feel too rich relative to risks, he and Willis have been more pragmatic in recognising that it is an exceptional environment, with monetary policy underpinning asset prices to an even greater degree than in the previous phase of quantitative easing. ‘Credit spreads are too tight, supported by central bank policies recognising the role of credit as a circuit-breaker, but that means we have to search for yield,’ says Lee. However, he adds that given the severe economic impact of COVID-19, the flood of liquidity will be insufficient to prevent the degradation of credit quality in some areas – ‘we expect ratings downgrades and defaults’. Given this, he has rotated some of AIF’s bond exposure into more high-quality areas with implicit government support, such as new sterling issues of local authority and housing association bonds, and companies that run GP surgeries, which are backed by the NHS.
Lee currently sees the best value in credit in financials, with a quarter of the portfolio in ‘national champion’ banks and insurers. ‘Capital adequacy is the best ever, underwriting is strong and emergency liquidity facilities will ensure banks do not go bust, but they are also not artificially suppressed by government QE,’ he explains. ‘Banks are the most important conduit for central bank policy in terms of keeping the flow of credit ticking over – unlike in the global financial crisis, they are not the cause of the crisis this time and they have to make sure the economy keeps running.’
Brexit clouds remain on the horizon, however, which Willis says is the main reason for keeping the portfolio unhedged at present (see Current portfolio positioning). Moon points out that while the service-orientated nature of the UK economy may have made UK plc even less attractive to international investors during the pandemic, ‘more broadly global allocators will not want UK exposure while there is still Brexit uncertainty’. Mackersie adds: ‘You can trace the recent underperformance of UK smaller companies almost exactly to the date of the referendum. Any resolution would help stimulate recovery and claw some of that back.’
Asset allocation
Investment process: Robust approach backed by research
The majority of AIF’s assets (in a working range of 70–80%, with 75% seen as a neutral position) are held in the smaller companies portfolio, with the income portfolio making up the balance. The small-cap portfolio is therefore expected to provide most of the fund’s capital return, although the managers’ focus on companies with attractive dividend yields mean it also supplies the majority of the income, while the income portfolio’s role is to provide diversification of capital and income returns, manage the level of structural gearing provided by the ZDPs, and potentially limit volatility through investing in assets that are less correlated to the equity market.
AIF’s smaller companies portfolio managers Moon and Mackersie are UK equity specialists and run a range of mandates for Unicorn Asset Management investing across the market cap spectrum, with the aim of achieving growth and/or income. AIF’s investment universe is made up of c 800 companies, broadly representing the bottom 10% of UK stocks by market capitalisation. With a strict 50-stock limit for the portfolio, it is important that the fund has a robust process in order to identify the best opportunities, and the managers begin by filtering the investment universe using quantitative screens, looking at profitability, valuation and growth potential, as well as income factors such as yield, dividend growth and dividend cover. In normal circumstances, the managers would see a c 4% dividend yield as indicating a potentially attractive opportunity, although in the current environment of COVID-19 driven dividend cuts, some stocks may be held more for their capital and income recovery potential than their current yields. Moon and Mackersie seek well managed, profitable companies with strong balance sheets and defensible competitive positions in growing end markets. They undertake c 400 company meetings – both in person and virtually – and site visits with both existing and potential investee companies each year; this forms a key element of AIF’s investment process, although the managers’ other funds can also be an important source of potential stock ideas.
The 50-holding limit in the smaller companies portfolio keeps the managers focused on identifying stocks with the best combination of yield and growth potential. Portfolio turnover tends to be relatively low, with the most common reason for a sale being that a company’s share price has risen to a point at which it no longer offers a compelling yield. In such circumstances the managers say they usually have little difficulty finding better-value, higher-yielding alternatives.
In the income portfolio, managers Chun Lee (bonds) and Robin Willis (alternatives, including investment companies) may invest across a range of assets, including government and corporate debt, structured notes, derivatives and closed-end investment companies. They look for holdings with attractive yields relative to bond market averages. Given the level of fiscal and monetary policy support as a result of COVID-19, the managers have shifted somewhat from the absolute return approach they have followed in recent years. Lee says the ‘lower for longer’ rates environment has encouraged him to move into longer-duration assets, while Willis has tilted his part of the portfolio more towards higher-yielding alternative income funds at wide discounts to NAV. Lee also notes that Premier Miton has recently strengthened its fixed income capability through the hiring of a team from Merian Global Investors, which recently merged with Jupiter Asset Management. Having a larger team with greater research resource has expanded AIF’s bond investment universe, which Lee says is helpful given the continued low-yield backdrop.
Current portfolio positioning
At 30 September 2020, there were 44 holdings in AIF’s smaller companies portfolio and 66 in its income portfolio. This compares with 47 and 64 respectively a year earlier. Both sets of managers have been more active than usual this year in terms of portfolio changes, seeking to limit damage and grasp opportunities arising from the coronavirus crisis. Partly as a result of having fewer positions in the small-cap portfolio, concentration in the top 10 holdings (all of which are smaller companies) has risen from 21.8% to 29.0% of gross assets over the year.
Moon and Mackersie sold 10 stocks and bought five during H120 (1 January to 30 June), and have since added another two new positions. Paving company Marshalls, hydraulics expert Flowtech Fluidpower and LondonMetric Property were sold into strength early in the year as their rising share prices had led to yield compression. As the stock market began to fall in late February and March, the managers cut holdings in consumer-facing stocks Card Factory and Cineworld, as well as planning consultancy RPS Group, where they had concerns about the level of debt. More recently, currency management specialist Alpha FX and technology stock discoverIE were sold after recovering strongly (in discoverIE’s case, to a share price above its pre-COVID-19 level).
|
Exhibit 3: Sector breakdown of small-cap portfolio |
Exhibit 4: Sector breakdown of income portfolio |
|
|
|
Source: Acorn Income Fund, Edison Investment Research. Note: Data at 30 September 2020. |
|
|
Exhibit 3: Sector breakdown of small-cap portfolio |
|
|
|
|
Exhibit 4: Sector breakdown of income portfolio |
|
|
|
|
Source: Acorn Income Fund, Edison Investment Research. Note: Data at 30 September 2020. |
In terms of new purchases, Mackersie and Moon added Topps Tiles at an attractive valuation early in the year, before taking advantage of the sell-off to open new positions in asset manager Liontrust, industrial fastenings maker Trifast (where it participated in a fund-raise to strengthen its balance sheet) and healthcare software company Emis. In an unusual move, they also bought back LondonMetric Property – which they still held in their open-ended funds – after its price fell to a level where the yield looked attractive again. ‘We are confident in its ability to continue to pay dividends, as it owns properties that are helping to serve the online retail market’, says Mackersie.
So far in the second half of the year the managers have added new holdings in Devro, which makes collagen-based sausage casings, and Bodycote, a specialist in metal-strengthening. Both companies are previous holdings that have been added back into the portfolio at lower prices than those at which they were sold.
Strong performance from the likes of Liontrust (which has moved into the mid-cap index since purchase) and Numis has propelled financials to the top sector weighting in the smaller companies portfolio at end-September 2020 (Exhibit 3), at 39.6% compared with 30.8% a year earlier, while industrials is now in second spot, having fallen from 40.7% to 37.5% of the portfolio.
Financials (including real estate) is also the largest weighting in the income portfolio (Exhibit 4), making up over half of the total, compared with 43.6% at 30 September 2019. Lee favours bonds of ‘national champion’ banks, which he says have a key part to play in supporting the economy as the transmission mechanism for central bank quantitative easing. Credits in Premier Inn owner Whitbread and Heathrow Airport were sold earlier in the year, as Lee says that although their balance sheets remain strong, there is no way of telling how permanent the scarring from COVID-19 restrictions will be for either business. In terms of recent portfolio activity, Willis has added holdings in investment companies trading at wide discounts following the sell-off, which has contributed positively to performance (see Performance section).
A put option on the main UK blue-chip index was held as a hedge against further market volatility from April to its expiry in September. It has not been replaced, as the managers feel hedging is currently unattractive given Brexit uncertainty (a negative outcome could in fact see the large-cap index rise, as sterling weakness increases the value of international earnings).
Performance: Stabilising after big COVID-19 hit
Exhibit 5: Five-year discrete performance data
12 months ending |
Share price |
NAV |
Acorn ZDPs |
Blended benchmark* (%) |
Numis Smaller Cos ex-ICs (%) |
CBOE UK All Companies (%) |
31/10/16 |
(5.9) |
(2.3) |
4.3 |
5.3 |
5.3 |
12.8 |
31/10/17 |
41.4 |
34.1 |
8.1 |
24.4 |
24.4 |
13.6 |
31/10/18 |
(15.0) |
(12.3) |
2.5 |
(5.7) |
(7.9) |
(1.6) |
31/10/19 |
(0.8) |
5.0 |
2.3 |
5.0 |
3.4 |
6.9 |
31/10/20 |
(22.2) |
(23.2) |
1.0 |
(5.4) |
(9.2) |
(20.2) |
Source: Refinitiv. Note: All % on a total return basis in pounds sterling. *Blended benchmark is the Numis Smaller Companies ex-ICs Index (NSCIX) until 31 July 2018 and thereafter is 75% NSCIX and 25% ICE BofAML Sterling Non-Gilts Index.
The past year has clearly been a difficult period for any predominantly UK smaller company strategy, and particularly so for AIF, which saw a negative NAV total return of 23.2% over the 12 months to 31 October 2020 (Exhibit 5). Gross assets (including the ZDPs) fell by 17.3%, while the share price total return was -22.2%, and the NSCIX declined by 9.2%. The magnitude of the fall has meant the fund has now posted negative performances over three and five years as well, although over 10 years both share price and NAV total returns are ahead of the blended benchmark at +1011% a year (Exhibit 6).
As well as the general headwinds for smaller companies discussed in the Market outlook section, AIF’s performance relative to the NSCIX has been affected by its positioning, in particular its large weightings in industrial engineering and transportation stocks, which make up c 20% of the portfolio compared with c 4–4.5% of the index. Niche lender Secure Trust Bank was the largest single detractor from the smaller companies portfolio’s performance in H120, while bowling alley operator Hollywood Bowl also came under pressure as the national lockdown forced the closure of its venues. In the income portfolio, Midlands-focused property fund Real Estate Investors detracted, with its share price having halved since February 2020.
|
Exhibit 6: Investment company performance to 31 October 2020 |
|
Price, NAV and benchmark total return performance, one-year rebased |
Price, NAV and benchmark total return performance (%) |
|
|
|
Source: Refinitiv, Edison Investment Research. Note: Three, five and 10-year performance figures annualised. Blended benchmark is the Numis Smaller Companies ex-ICs Index (NSCIX) until 31 July 2018 and thereafter is 75% NSCIX and 25% ICE BofAML Sterling Non-Gilts Index. |
|
On the positive side, Willis has seen good performance recently from some credit- and property-focused investment companies that he bought for the income portfolio at wide discounts to NAV following the sell-off earlier in the year. These include Real Estate Credit Investments, Pollen Street Secured Lending and VPC Specialty Lending Investments. Bonds in ‘national champion’ banks, and defensive names such as supermarkets Tesco and Morrisons, also performed well. In the smaller companies portfolio, more recent positive performance has come from some industrial stocks such as concrete levelling specialist Somero Enterprises, whose strong interim results included the reinstatement of the deferred FY19 final dividend, as well as Clipper Logistics, which has benefited from the growth of e-commerce during the lockdown.
Relative to indices (Exhibit 7), AIF’s performance has taken a hit over most periods, although the fund’s 10-year record remains comfortably superior to the NSCIX and the broad UK index, as well as the bond index that makes up 25% of the fund’s composite benchmark. With NAV and share price performance having stabilised in recent months, outperforming most comparators shown over one and three months, AIF has the potential to rebuild its positive track record as its portfolio of well-financed, quality companies and less correlated income assets continues to recover.
Exhibit 7: Share price and NAV total return performance, relative to indices (%)
|
One month |
Three months |
Six months |
One year |
Three years |
Five years |
10 years |
Price relative to Numis Smaller Cos ex-ICs |
4.7 |
4.1 |
(14.2) |
(14.3) |
(24.2) |
(23.0) |
28.6 |
NAV relative to Numis Smaller Cos ex-ICs |
(3.3) |
(6.8) |
(9.8) |
(15.4) |
(18.3) |
(18.3) |
16.8 |
Price relative to CBOE UK All Companies |
9.6 |
14.5 |
(1.2) |
(2.5) |
(21.9) |
(19.0) |
79.1 |
NAV relative to CBOE UK All Companies |
1.3 |
2.5 |
3.8 |
(3.8) |
(15.8) |
(14.0) |
62.7 |
Price relative to ICE BofAML £ non-gilts |
5.0 |
10.1 |
(7.4) |
(25.5) |
(42.7) |
(33.5) |
54.6 |
NAV relative to ICE BofAML £ non-gilts |
(3.0) |
(1.4) |
(2.7) |
(26.5) |
(38.2) |
(29.4) |
40.5 |
Source: Refinitiv, Edison Investment Research. Note: Data to end-October 2020. Geometric calculation.
Discount: Trending narrower after volatile period
Given the widespread market volatility in the early part of 2020, the past year has been one of extremes for AIF’s share price relative to NAV, reaching a 10-year high premium of 7.6% in late March before slipping back to a decade-wide discount of 25.3% in July. Since then the rating has stabilised somewhat, and the shares stood at a 13.5% discount to cum-income NAV at 2 November 2020, in line with than the 12-month average. AIF’s managers note that the discount widening in the summer months was principally due to a very large bid/offer spread on the shares (making them unattractive to potential purchasers), which has since been addressed with the appointment of a new corporate broker. Prior to the 2016 Brexit referendum, AIF’s shares frequently traded at a premium to NAV, but have since remained largely in a range from par to a c 15% discount as UK assets in general, and smaller companies in particular, have been less favoured by investors. AIF’s current discount is wider than the peer group average shown in Exhibit 9, and wider than the 9.0% weighted average discount for funds in the AIC’s UK Smaller Companies sector. It compares with longer-term average discounts of 9.7%, 8.2% and 8.3% respectively over three, five and 10 years. There is scope for the discount to narrow in the near term if the UK reaches a trade agreement with the European Union before the end of the Brexit transition period.
|
Exhibit 8: Share price premium/discount to NAV (including income) over three years (%) |
|
|
Source: Refinitiv, Edison Investment Research |
Capital structure and fees
AIF is a Guernsey-incorporated, London-listed closed-end investment company with two classes of share. There were 15.8m ordinary shares and 21.2m ZDPs in issue at 2 November 2020. The ZDPs, which provide AIF’s gearing, mature in 2022 and had a gross redemption yield of 6.5% at 30 September 2020. At the same date, the ZDPs had a hurdle rate of -55.7%, meaning that AIF’s total assets would have to decline in value by more than 55.7% a year over the remaining life of the ZDPs in order for their final capital entitlement not to be met in full. Given the fall in the value of the fund’s assets since the start of the year, gross gearing stood at 70.3% at 30 September 2020, compared with 44.3% at 31 December 2019.
The board may buy back or allot shares in order to manage a discount or a premium to NAV; where this occurs, both ordinary shares and ZDPs are repurchased or issued in amounts such that the ratio of ZDPs to ordinary shares is maintained. No shares have been bought back or allotted since August 2018.
The fund pays an annual management fee of 0.7% of gross assets (charged 75:25 to the capital and income accounts respectively) to Premier Asset Management (Guernsey), a wholly owned subsidiary of Premier Miton. The investment manager in turn pays fees to Unicorn Asset Management and Premier Miton, the advisers of the smaller companies and income portfolios, respectively. A performance fee (15% of excess returns) may be paid if AIF’s NAV per share plus dividends has grown at a compound annual rate of more than 10% since the last year-end at which a performance fee was paid (the high-water mark). Currently the end-FY17 NAV of 486.8p is the high-water mark; with the NAV standing at 293.8p at 30 October 2020 (plus dividends of 57.85p since end-FY17), we do not expect a performance fee to be payable in respect of FY20. Ongoing charges for the year ended 31 December 2019 were 1.79%.
Dividend policy and record
Given the combination of a growing dividend and a falling share price, AIF currently offers an eye-catching yield of 8.8% on its ordinary shares. Dividends are paid quarterly, in March, June, September and December, and have been increased or maintained in each of the last 10 financial years, growing at a compound annual rate of 13.9%. So far in FY20, three dividends of 5.75p (10.6% higher than the FY19 quarterly payments) have been paid. The first quarterly dividend was announced in February, when the coronavirus outbreak was still in its infancy, and subsequent payouts have been maintained at the same level, supported by AIF’s revenue reserves.
In normal circumstances the smaller companies portfolio, by virtue of its relative size, generates the majority of the fund’s income, and also tends to have a higher portfolio yield than the income portion of the fund. While income in FY20 has taken a hit because of COVID-19 related dividend cuts (down by c 59% in H120 compared with H119), Moon and Mackersie report that with some companies already having reinstated dividends, receipts for the year should decline by less than the 45–49% full-year fall forecast for the broad UK equity market by the industry-standard Link Dividend Monitor (Q220), and by far less than the projected c 70% decline in dividends from UK small- and mid-caps. AIF’s dividends in previous years have tended to be fully covered by income, and at end-H120 (30 June 2020), the fund had revenue reserves of £2.3m after paying the first two quarterly dividends, equivalent to 0.7x the expected total dividend for FY20 (assuming the Q4 payment is unchanged).
Peer group comparison
Exhibit 9: Selected peer group at 2 November 2020*
% unless stated |
Market |
NAV TR |
NAV TR |
NAV TR |
NAV TR |
Discount |
Ongoing charge |
Perf. |
Net |
Dividend |
Acorn Income Fund |
40.2 |
(22.6) |
(28.1) |
(6.0) |
150.9 |
(13.5) |
1.8 |
Yes |
166 |
8.6 |
Aberdeen Smaller Companies Inc |
58.4 |
(4.0) |
(2.8) |
40.8 |
172.4 |
(12.2) |
1.2 |
No |
107 |
3.1 |
Henderson High Income |
158.8 |
(18.5) |
(14.2) |
5.8 |
101.2 |
(9.7) |
0.8 |
Yes |
123 |
8.0 |
Peer group average (3 funds) |
85.8 |
(15.0) |
(15.0) |
13.5 |
141.5 |
(11.8) |
1.3 |
132 |
6.6 |
|
AIF rank in sector |
3 |
3 |
3 |
3 |
2 |
3 |
1 |
1 |
1 |
Source: Morningstar, Edison Investment Research. Note: *Performance to 30 October 2020 based on ex-par NAV. TR=total return. Net gearing is total assets less cash and equivalents as a percentage of net assets.
AIF is a member of the AIC’s UK Equity & Bond Income sector, but it is hard to draw a meaningful comparison with its only peer in the sector, Henderson High Income (HHI), given AIF’s equity portfolio is focused on smaller companies while HHI mainly holds blue-chip names. Aberdeen Smaller Companies Income (ASCI) was previously in the same peer group but has moved to the UK Smaller Companies sector to reflect the fact that it is invested almost entirely (c 97%) in equities. While ASCI’s portfolio weightings are not dissimilar to those of AIF (largest weightings in financials and industrials), and there is some crossover in current and former holdings (discoverIE, Liontrust), AIF’s performance in the difficult period since the UK’s vote to leave the EU in 2016, and particularly since the COVID-19 driven sell-off earlier in 2020, has been negatively affected by the high level of structural gearing. AIF ranks third of the three funds in NAV total return terms over one, three and five years, and second over 10 years. It currently trades on the widest discount to NAV, has the highest ongoing charges (reflecting its smaller size), and is one of two peers that may pay a performance fee. The fund has the highest level of gearing in the group, and also the highest dividend yield. AIF is currently one of the AIC universe’s highest-yielding funds invested in equities.
The board
AIF has three independent non-executive directors and one director deemed non-independent. Nigel Ward, a director since 2011, was appointed chairman at the 2019 AGM following the retirement of Helen Green. David Warr has served on the board since 2012, while Sharon Parr was appointed in August 2019. Nigel Sidebottom joined the board in February 2019 and is deemed non-independent as he was previously head of closed-end funds at AIF’s manager, Premier Miton Investors (then Premier Asset Management). All the directors bar Sidebottom are resident in Guernsey, where AIF is incorporated. The directors’ professional backgrounds are in investment management, fund administration and accountancy.
|
|
Research: Industrials
After negative surprises in its last three reports, John Laing Group’s (JLG) Q3 update brought welcome good news. NAV per share rose 2% to 314p as an FX headwind and pension charges failed to offset another strong PPP performance. The performance of the renewable portfolio, now just 22% of the total, was stable. JLG retains its guidance for ‘modest’ underlying NAV growth in H2 and we nudge up our NAV per share forecast from 308p to 310p. The share price stands at a 9% discount to FY20e NAV per share.