Last close As at 05/08/2026
—
— 0.00 (0.00%)
Market capitalisation
—
Research: Investment Companies
Witan Investment Trust’s (WTAN) investment director James Hart suggests that equities are currently an attractive asset class for the patient and selective investor. He believes that selectivity is becoming more important given the elevated valuation levels of parts of the equity market. The director argues that this plays to the strengths of WTAN’s multi-manager investment approach, with experienced managers that are able to take advantage of the evolving investment environment. Although relative performance was weaker than average in 2018, the trust has outperformed its composite benchmark over the last three, five and 10 years, while generating NAV and share price total returns between 11.0% and 15.0% pa over the last three, five and 10 years.
Witan Investment Trust |
Long-term outperformance from multi-managers |
Investment trusts |
4 July 2019 |
Share price/discount performance
Three-year performance vs index
Gearing
Analysts
|
|||||||||||||||||||||||||||||||||||||||||||||||||||||||||||||||||||||||||||||||||||||||||||
Witan Investment Trust’s (WTAN) investment director James Hart suggests that equities are currently an attractive asset class for the patient and selective investor. He believes that selectivity is becoming more important given the elevated valuation levels of parts of the equity market. The director argues that this plays to the strengths of WTAN’s multi-manager investment approach, with experienced managers that are able to take advantage of the evolving investment environment. Although relative performance was weaker than average in 2018, the trust has outperformed its composite benchmark over the last three, five and 10 years, while generating NAV and share price total returns between 11.0% and 15.0% pa over the last three, five and 10 years.
|
Long-term NAV outperformance versus the benchmark |
|
|
Source: Refinitiv, Edison Investment Research |
The market opportunity
While global equity markets are experiencing higher levels of volatility as investor sentiment shifts in response to macro developments (including the ongoing trade dispute between the US and China), taking a longer-term view could highlight attractive opportunities. Over the long term, equities have delivered higher annual total returns than other asset classes such as government bonds or cash.
Why consider investing in WTAN?
■
Broad equity exposure to world markets via specialist multi-manager strategy; the trust may be considered as a ‘one-stop-shop’ for global investment.
■
Long-term outperformance of its benchmark.
■
The majority of the external managers’ strategies are unavailable to the retail investor, and WTAN’s direct investments offer exposure to niche opportunities.
■
Progressive dividend policy; 44 consecutive years of growth in the dividend.
Ongoing repurchases to help manage the discount
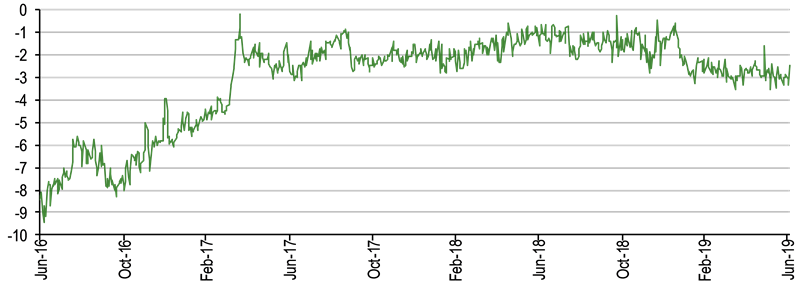
The board actively manages WTAN’s discount, aiming for its shares to trade close to NAV. The shares are currently trading at a 2.5% discount to cum-income NAV, which compares with the 2.0% to 3.1% range of average discounts over the past one, three and five years. WTAN aims to grow its annual dividend at a rate higher than UK inflation; it has delivered 44 consecutive years of dividend growth, compounding at c 9% pa over the last decade.
Exhibit 1: Trust at a glance
Investment objective and fund background |
Recent developments |
||||||||||||||||||||||||||||||||||||||||||||||||||||||||||||||||||||||
WTAN aims to deliver long-term growth in income and capital through active multi-manager investment in global equities. Funds are currently allocated to 10 external managers, and up to 12.5% is directly invested in specialist funds and smaller, niche managers. Witan seeks external managers with the conviction to take views that may diverge from benchmark weightings. |
■ 28 May 2019: Effective 5:1 share split. ■ 2 April 2019: Appointment of Andrew Ross as non-executive director, with effect from 2 May 2019. The intention is to appoint him as chairman at the 2020 AGM. ■ 12 March 2019: Annual report ended 31 December 2018. NAV TR -8.4% versus benchmark TR -6.5%. Share price TR -8.1%. |
||||||||||||||||||||||||||||||||||||||||||||||||||||||||||||||||||||||
Forthcoming |
Capital structure |
Fund details |
|||||||||||||||||||||||||||||||||||||||||||||||||||||||||||||||||||||
AGM |
May 2020 |
Ongoing charges |
0.75% (0.83% incl. perf. fees) |
Group |
Self-managed (Witan Inv. Services) |
||||||||||||||||||||||||||||||||||||||||||||||||||||||||||||||||||
Interim results |
August 2019 |
Net gearing |
10% |
Manager |
Andrew Bell (CEO), James Hart (investment director) |
||||||||||||||||||||||||||||||||||||||||||||||||||||||||||||||||||
Year end |
31 December |
Annual mgmt fee |
See page 8 |
Address |
14, Queen Anne’s Gate, |
||||||||||||||||||||||||||||||||||||||||||||||||||||||||||||||||||
Dividend paid |
Mar, Jun, Sep, Dec |
Performance fee |
Yes (see page 8) |
||||||||||||||||||||||||||||||||||||||||||||||||||||||||||||||||||||
Launch date |
February 1909 |
Trust life |
Indefinite |
Phone |
+44 (0)20 7227 9770 |
||||||||||||||||||||||||||||||||||||||||||||||||||||||||||||||||||
Continuation vote |
No |
Loan facilities |
See page 8 |
Website |
|||||||||||||||||||||||||||||||||||||||||||||||||||||||||||||||||||
Dividend policy and history (financial years) |
Share buyback policy and history (financial years) |
||||||||||||||||||||||||||||||||||||||||||||||||||||||||||||||||||||||
There have been 44 years of consecutive annual dividend increases. Chart based on May 2019 5:1 share split. |
Renewed annually, the board has authority both to repurchase at a discount (14.99%) and allot at a premium (10%) ordinary shares. 2016 includes repurchase from Aviva. |
||||||||||||||||||||||||||||||||||||||||||||||||||||||||||||||||||||||
|
|
||||||||||||||||||||||||||||||||||||||||||||||||||||||||||||||||||||||
Shareholder base (as at 28 June 2019) |
Portfolio exposure by sector (as at 31 May 2019) |
||||||||||||||||||||||||||||||||||||||||||||||||||||||||||||||||||||||
|
|
||||||||||||||||||||||||||||||||||||||||||||||||||||||||||||||||||||||
Top 10 holdings (as at 31 May 2019) |
|||||||||||||||||||||||||||||||||||||||||||||||||||||||||||||||||||||||
|
|||||||||||||||||||||||||||||||||||||||||||||||||||||||||||||||||||||||
Source: Witan Investment Trust, Edison Investment Research, Bloomberg, Morningstar. Note: *N/A where not in end-May 2018 top 10. **Direct fund investments.
Market outlook: Look through the short-term noise
Exhibit 2 (left-hand side) highlights the outperformance of global versus UK equities (in pounds) over the last 10 years; part of which has been due to sterling weakness. Stock markets across the world have become more volatile in recent quarters as investor sentiment swings in response to changes in the macro backdrop. Fears about a global economic slowdown and further US interest rate rises led to a widespread sell-off in Q418, which was followed by a meaningful rally in Q119 as more optimism emerged over a resolution to the US-China trade dispute, and the US Federal Reserve adopted a more dovish stance. Investor sentiment once again turned more cautious in May this year as the division between the US and China deepened, with the US’s introduction of steeper tariffs, and the subsequent retaliation by Chinese authorities, although by mid-summer relations between the two countries appeared to be more cordial. In terms of valuation (Exhibit 2, right-hand side), global equities, as measured by the Datastream World index, are not looking particularly attractive, trading on a forward P/E multiple of nearly 15x, which is a 10% premium to the 10-year average. However, investors taking a longer-term perspective may find opportunities created by near-term macro concerns. Over the long term, investors adopting this approach have achieved relatively attractive annual total returns compared with other asset classes such as government bonds or cash. A fund offering a ‘one-stop-shop’ for global equity investment, with potential lower volatility of returns via a multi-manager strategy, may appeal.
|
Exhibit 2: Market performance and valuation |
|||||||||||||||||||||||||||||||
Performance of indices in £ (last 10 years) |
Valuation metrics of DS World index (last 10 years, as at 3 July 2019) |
||||||||||||||||||||||||||||||
|
|
||||||||||||||||||||||||||||||
|
Source: Refinitiv, Edison Investment Research |
|||||||||||||||||||||||||||||||
Fund profile: Multi-manager approach since 2004
WTAN was founded in 1909 by Sir Alexander Henderson, a leading financier in the South American railways, and has been listed on the London Stock Exchange since 1924. The trust is managed by the executive team of its subsidiary Witan Investment Services (WIS). WTAN aims to achieve a total return above that of its composite global benchmark over the long term, while growing the annual dividend at a rate higher than the level of UK inflation. Since 2004, the trust has been running a multi-manager strategy, aiming to maximise returns, while reducing the performance volatility risk arising from the dependence on a single manager. At that time, the trust became self-managed and appointed its first chief executive. The majority of WTAN’s assets are run by 10 external managers investing in both developed and emerging markets; while most of the managers have a focused stock list, WTAN’s combined portfolio is widely diversified by geography, sector and at the individual stock level. Gearing of up to 20% of net assets is permitted and over the last five years has typically been in a range of 5% to 15% (a small cash position may be held when appropriate); at end-May 2019, net gearing was 10%.
WTAN’s benchmark has evolved over time, reflecting where its board and executive team believe the opportunities lie for a global investor, and is a composite of FTSE indices:
■
from 1 September 2004 to 30 September 2007 – 50% All-Share and 50% World (ex-UK);
■
from 1 October 2007 to 31 December 2016 – 40% All-Share, 20% All-World North America, 20% All-World Asia Pacific and 20% All-World Europe (ex-UK); and
■
since 1 January 2017 – 30% All-Share, 25% All-World North America, 20% All-World Asia Pacific, 20% All-World Europe (ex-UK) and 5% Emerging Markets.
WTAN has a distinguished dividend history, growing its annual dividend for the last 44 consecutive years, and has outperformed its benchmark in seven of the last 10 years.
CEO and investment director: Andrew Bell, James Hart
The director’s view: Q418 sell-off created opportunities
We met with WTAN’s investment director James Hart, who says that following the escalation in the US-China trade dispute, the outcome and timing of a resolution is very hard to predict, observing that the protraction is negative for both stock markets and business confidence. However, the director does expect the differences to be resolved, given the importance to both parties in finding a solution. He believes the escalation reflected Trump’s frustration that a resolution was not imminent. However, given the upcoming US presidential election in 2020, Hart suggests progress could be made later in 2019. In the meantime, Chinese economic growth remains robust, helped by a series of stimulus measures, including personal tax reductions and infrastructure spending, although Hart cautions that the impact of the trade dispute could become evident in economic data further down the line. In terms of the overall investment backdrop, the director’s view is that while economic growth is somewhat anaemic, there are a lack of inflation fears and equity markets are well priced versus history and other investment alternatives, albeit less attractively valued than following the broad Q418 stock market sell-off. Hart explains that WTAN was 12% geared at the end of 2018, and this position was maintained during Q119, given the view that share price weakness in the prior quarter was more a function of negative investor sentiment than a response to declining company fundamentals. However, gearing was reduced to 9% in early April, reflecting a shift in the balance of risk following the significant stock market rally in the first three months of this year. Leverage of c 10% continues to reflect a broadly positive view on equity returns but provides a degree of flexibility if there is a market setback.
WTAN generated double-digit percentage total returns in the first four months of 2019, and the director suggests that this may represent the lion’s share for the whole of this year, given that typical annual equity total returns are less than 10%. However, he notes that since the end of 2017, with the exception of the US, generally stock markets have advanced only modestly, maybe 0–2% per year in sterling terms. While the Q119 rally was significant, Hart suggests it was only a recovery from the sentiment-driven sell-off in Q418; therefore, he considers it an oversimplification to suggest that WTAN has little further upside potential for the balance of this year. Furthermore, the director remains confident in the prospects for good long-term equity returns for patient and selective investors.
Asset allocation
Investment process: Multi-manager approach
Around 90% of WTAN’s portfolio is allocated to third-party managers, while the balance is invested directly by WIS’s executive team. – a maximum 10% can be held in specialist collective funds and up to 2.5% allocated to newly established or highly specialised investment firms. The external managers run high-conviction portfolios, each with 15–70 stocks (average of 38), and active shares in 2018 ranged from 73% to 97% (a measure of how a portfolio differs from an index – 0% is full replication and 100% is no commonality). Combined, this led to a 2018 active share of 76% for WTAN. Hart highlights the potential benefits of the trust’s multi-manager strategy:
■
selecting specialist managers in their areas of greatest expertise should lead to higher returns;
■
multiple managers should lead to smoother investment returns for the trust;
■
high-conviction portfolios should avoid over-diversification;
■
the majority of the external managers’ strategies are unavailable to the retail investor;
■
WIS’s executive team can adjust portfolio exposure and manager allocations; and
■
exposure to higher-growth areas and value opportunities via WTAN’s direct investments.
Each external manager has a different investment approach, in terms of regional exposure or investment style. However, they are all bottom-up investors who tend to focus on companies’ cash flow fundamentals. Hart shares an investment adage saying that ‘in the short run, markets are a voting machine, but in the long run they are a weighing machine’, meaning that while over the short term, stock markets can be driven by investor sentiment, over the long term, company share prices are driven by a firm’s cash flows and dividends.
Key attributes of the external managers include skilled and accountable leadership; high corporate governance standards; a long-term, benchmark-agnostic approach; a clear and disciplined investment process; concentrated portfolios; and reasonable fees. The managers are intended to remain on WTAN’s roster for the long term, but their performance and adherence to their investment processes are reviewed regularly.
The use of exchange-traded derivatives is permitted for efficient portfolio management. In recent years, index futures have been used to adjust exposures or asset allocations quickly without interfering with the external managers’ objectives. Third-party managers are not permitted to use derivatives or gearing but may hold cash.
Current portfolio positioning
Exhibit 3: Witan portfolio analysis and performance by investment manager
Equity mandate |
Investment manager |
Benchmark |
Investment style |
% of AUM at |
Inception |
Performance (% pa since inception) |
||
Witan |
B’mark |
Diff. |
||||||
UK |
Artemis |
FTSE All-Share |
Recovery/special situations |
7 |
06-May-08 |
7.7 |
5.2 |
2.5 |
UK |
Heronbridge |
FTSE All-Share |
Intrinsic value growth |
6 |
17-Jun-13 |
7.0 |
5.4 |
1.6 |
UK |
Lindsell Train |
FTSE All-Share |
Long-term growth from undervalued brands |
9 |
01-Sep-10 |
14.6 |
7.5 |
7.1 |
Global |
Lansdowne Partners |
DJ Global Titans |
Concentrated, benchmark-independent investment in developed markets |
15 |
14-Dec-12 |
17.5 |
12.2 |
5.3 |
Global |
Pzena |
FTSE All-World |
Systematic value |
12 |
02-Dec-13 |
8.9 |
10.6 |
(1.7) |
Global |
Veritas |
FTSE All-World |
Fundamental value, real return objective |
15 |
11-Nov-10 |
12.8 |
10.2 |
2.6 |
Europe |
CRUX |
FTSE Europe ex-UK |
Sound businesses with quality management and attractive valuations |
5 |
27-Oct-17 |
(10.7) |
(9.2) |
(1.5) |
Europe |
S W Mitchell |
FTSE Europe ex-UK |
High-conviction portfolio of companies that offer unrecognised value |
4 |
27-Oct-17 |
(18.0) |
(9.2) |
(8.8) |
Asia Pacific (incl. Japan) |
Matthews Int'l |
MSCI Asia Pacific Free |
Quality companies with dividend growth |
10 |
20-Feb-13 |
9.3 |
7.5 |
1.8 |
Emerging Markets |
GQG Partners |
MSCI Emerging Markets |
High-quality companies with attractively priced growth prospects |
5 |
16-Feb-17 |
3.4 |
3.0 |
0.4 |
Directly held investments |
Witan's Executive Team |
Witan’s composite benchmark |
Undervalued specialist collective funds and smaller manager mandates |
11 |
19-Mar-10 |
11.2 |
8.0 |
3.2 |
Source: Witan Investment Trust. Note: *Percentage of Witan’s assets managed, numbers subject to rounding.
Exhibit 3 shows WTAN’s multi-manager line-up. In 2018, four of the external managers and the executive team outperformed their respective benchmarks. Considering annualised performance since each manager’s inception date to the end of 2018, the majority of managers have outperformed, led by Lindsell Train (+7.1pp pa) and Lansdowne Partners (+5.3pp pa). Only three managers have underperformed, including the two relatively recently appointed European managers CRUX and S W Mitchell; although Hart reports that these two managers have had a more encouraging start to 2019.
|
Exhibit 4: Portfolio distribution by geography* (left) and sector (right) as at 31 May 2019 |
|
|
|
|
Source: Witan Investment Trust, Edison Investment Research. Note: *Regional breakdown excluding cash, rebased to 100. |
|
|
Exhibit 4: Portfolio distribution by geography* (left) and sector (right) as at 31 May 2019 |
|
|
|
|
|
|
Source: Witan Investment Trust, Edison Investment Research. Note: *Regional breakdown excluding cash, rebased to 100. |
Exhibit 4 illustrates how widely diversified WTAN’s portfolio is by geography and sector. Hart comments that looking at WTAN’s top 20 holdings, there have been significant changes in some of the managers’ portfolios as they address stock-specific opportunities. Comparing the trust’s largest positions at the end of May 2019 with a year earlier, notable additions to the top 20 include more reasonably valued cyclical names such as BP, Rio Tinto and Royal Dutch Shell, which replaced holdings including high-profile US companies such as technology companies Alphabet (the parent of Google) and Facebook, and major banks Bank of America and JPMorgan Chase.
The director explains that there have been no significant changes in WTAN’s direct holdings in recent months. The position in Electra Private Equity was increased; the fund is in liquidation mode and its primary asset is restaurant chain TGI Fridays. Electra trades at a significant c 30% discount to NAV, reflecting the highly publicised problems in the casual dining sector. However, Hart says that TGI Fridays’ trading figures have been solid and the company has not over-expanded, unlike some of its competitors. While Electra is working towards selling the business, it is focusing on maximising value, rather than exiting as quickly as possible. The director also highlights WTAN’s holding in specialist life science company Syncona. This was a strong contributor to performance in 2018; WIS took some profits when the stock was close to its high point, while the position was increased after the stock came under pressure in Q119 due to general biotech sector weakness and a partial placing by Syncona’s largest shareholder, the Wellcome Trust.
Performance: Mid- and long-term outperformance
Exhibit 5: Five-year discrete performance data
12 months ending |
Share price |
NAV |
Composite |
MSCI World |
FTSE All- |
FTSE AW North |
30/06/15 |
13.9 |
11.4 |
6.8 |
10.9 |
2.6 |
15.1 |
30/06/16 |
(2.5) |
7.2 |
7.6 |
15.1 |
2.2 |
20.8 |
30/06/17 |
36.2 |
28.0 |
22.8 |
22.3 |
18.1 |
21.3 |
30/06/18 |
10.9 |
8.8 |
8.6 |
9.9 |
9.0 |
12.5 |
30/06/19 |
0.6 |
2.7 |
6.1 |
10.9 |
0.6 |
14.1 |
Source: Refinitiv. Note: All % on a total return basis in £. *See fund profile section on page 3. Since 1 January 2017, 30% All-Share, 25% All-World North America, 20% All-World Asia Pacific, 20% All-World Europe (ex-UK) and 5% Emerging Markets.
In 2018, WTAN’s NAV and share price total returns of -8.4% and -8.1% respectively trailed the benchmark’s -6.5% total return, partly due to gearing, which reduced NAV by 1.2%; while the trust’s gross portfolio return was -6.3%. This was only the second year of negative returns in the last decade. There have been no changes to the external manager line-up since October 2017. However, in April 2018, 0.7% of WTAN’s assets were allocated to newly established manager Latitude Investment Management, which generated a +6.3% total return up to the end of 2018, compared with the +1.0% total return from its global index benchmark. A second appointment under the 2.5% allocation to newly established or specialised firms was made in May 2019. This involved a £20m investment in the GMO Climate Change Strategy, which seeks a high return from companies positioned to benefit from efforts to curb or mitigate climate change.
|
Exhibit 6: Investment trust performance to 30 June 2019 |
|
Price, NAV and benchmark total return performance, one-year rebased |
Price, NAV and benchmark total return performance (%) |
|
|
|
Source: Refinitiv, Edison Investment Research. Note: Three-, five- and 10-year performance figures annualised. |
|
WTAN’s relative returns are shown in Exhibit 7. Its NAV and share price total returns are ahead of the benchmark over three, five and 10 years. The potential benefits of investing overseas, as well as WTAN’s multi-manager approach, are highlighted by the trust’s meaningfully superior performance versus the FTSE All-Share index over three, five and 10 years.
|
Exhibit 7: Share price and NAV total return performance, relative to indices (%) |
||||||||
|
One month |
Three months |
Six months |
One year |
Three years |
Five years |
10 years |
|
Price relative to composite benchmark |
(0.5) |
(0.7) |
(2.7) |
(5.2) |
7.5 |
3.8 |
27.0 |
|
NAV relative to composite benchmark |
(0.3) |
(0.5) |
(1.2) |
(3.2) |
1.1 |
5.0 |
12.5 |
|
Price relative to MSCI World |
(1.1) |
(2.1) |
(4.9) |
(9.3) |
1.9 |
(11.2) |
3.6 |
|
NAV relative to MSCI World |
(1.0) |
(1.9) |
(3.4) |
(7.4) |
(4.1) |
(10.3) |
(8.1) |
|
Price relative to FTSE All-Share |
0.7 |
1.2 |
(1.2) |
0.1 |
17.4 |
24.3 |
46.9 |
|
NAV relative to FTSE All-Share |
0.9 |
1.4 |
0.4 |
2.1 |
10.4 |
25.7 |
30.2 |
|
|
Source: Refinitiv, Edison Investment Research. Note: Data to end-June 2019. Geometric calculation. |
||||||||
|
Exhibit 8: NAV total return performance relative to benchmark over five years |
||||||||
|
||||||||
|
Source: Refinitiv, Edison Investment Research |
||||||||
Discount: Continuing to trade in a narrow range
The board aims to ensure that WTAN’s shares trade at a sustainable low discount or a premium to NAV. It has the authority, renewed annually, to repurchase up to 14.99% and allot 10% of WTAN’s outstanding shares; during 2018, just 0.2m shares (0.1% of issued capital) were repurchased at an average discount of 1.7%. Over the past couple of years, WTAN’s discount has been in a narrow range (from close to par to a c 3% discount), and its shares are currently trading at a 2.5% discount to cum-income NAV. The current discount is broadly in line with the 2.0%, 3.1% and 2.4% average discounts over the past one, three and five years respectively.
WTAN’s discount widened modestly in early 2019 (Exhibit 9), largely as a result of increased liquidity in the trust’s shares following the closure of the Witan Wisdom and Jump Savings schemes, which had ceased to be cost effective. Shareholders had four options: to move to Hargreaves Lansdown (the default option); move to another platform; join the main share register; or sell their shares. In response to the wider discount, the board stepped up its pace of share repurchases, buying c £23m of shares at an average discount of 2.9% so far in 2019, illustrating the intent to reduce discount volatility.
|
Exhibit 9: Share price discount to NAV (including income) over three years (%) |
|
|
Source: Refinitiv, Edison Investment Research |
Capital structure and fees
WTAN is a conventional investment trust with one class of share; there are currently 880.0m ordinary shares in issue. On 28 May 2019, the shares were split five for one, and the voting entitlement was changed from one vote for every four shares to one vote for each single share. The intention of the split (a lower share price and a greater number of shares) was to make WTAN’s shares more accessible to investors saving regularly and reinvesting their dividends.
The trust has £170.4m in fixed-rate borrowings, primarily made up of: £64m 6.125% secured bonds 2025; £21m 3.29% secured notes 2035; £54m 3.47% secured notes 2045; and £30m 2.74% secured notes 2054. WTAN also has a £125m flexible one-year borrowing facility. The average interest rate on the fixed-rate borrowings is 4.3%, while including short-term borrowings the average rate is 3.3%. Due to recent refinancing, this figure is considerably lower than the 7.5% average rate three to four years ago. While gearing detracted from performance during the stock market weakness in 2018, it was a positive contributor in Q119 as markets rallied. Borrowings are a key feature of a closed-end fund’s structure and WIS tends to be contrarian, with WTAN’s level of gearing linked to equity market valuations and the view on whether markets are expected to rise or be more turbulent in the long run, rather than based on their recent performance.
The base fees for WTAN’s external managers range from 0.25% to 0.70% pa, and the weighted average fee for 2018 was 0.52%, which was in line with the prior year. Two managers (accounting for 14% of WTAN’s assets under management) are eligible for performance fees; however, they have lower base fees. The majority of the managers’ fee structures taper, reducing as assets under management rise. In 2018, WTAN’s ongoing charges were 0.75% (-1bp year-on-year), while including performance fees they were 0.83% (+5bp year-on-year).
Dividend policy and record
WTAN aims to generate long-term growth in both capital and income, seeking to grow the annual dividend at a rate higher than UK inflation. Quarterly dividends are paid in March, June, September and December. Barring unforeseen circumstances, the first three interim dividends are equivalent to a quarter of the prior years’ annual distribution, followed by a fourth, historically higher, variable interim dividend.
In 2018, WTAN’s revenue per share grew by 8.8% to 25.9p (before the 5:1 stock split), while its dividend growth was even higher, +11.9% year-on-year to 23.5p per share (1.1x covered); this compared with a year-end UK annual inflation rate of 2.1%. Income growth was due to higher distributions from portfolio companies and a favourable forex impact due to sterling weakness. WTAN added £4.7m to revenue reserves in 2018 which, after allowing for the final 2018 distribution, equalled c 1.5x the annual distribution, providing flexibility to smooth the dividend in future years. Data from WTAN show that since 2008, its dividend has grown by 130% versus 25% for UK CPI and 65% for the UK stock market (WTAN’s five-year dividend growth is 8.7% pa and 10-year growth is 10.3% pa). The trust has increased its annual distribution for the last 44 consecutive years and currently offers a 2.1% dividend yield.
Peer group comparison
Exhibit 10: AIC Global sector as at 3 July 2019*
% unless stated |
Market |
NAV TR |
NAV TR |
NAV TR |
NAV TR |
Discount |
Ongoing |
Perf. |
Net |
Dividend |
Witan |
1,931.9 |
5.4 |
43.7 |
73.4 |
257.0 |
(2.8) |
0.8 |
Yes |
110 |
2.1 |
Alliance Trust |
2,706.1 |
9.3 |
51.5 |
86.1 |
236.0 |
(4.3) |
0.6 |
No |
104 |
1.7 |
AVI Global Trust |
855.1 |
5.1 |
53.2 |
62.3 |
166.9 |
(9.1) |
0.9 |
No |
107 |
1.7 |
Bankers |
1,179.5 |
11.7 |
56.7 |
87.6 |
260.9 |
(0.9) |
0.5 |
No |
100 |
2.2 |
Brunner |
363.7 |
11.5 |
46.6 |
63.4 |
235.0 |
(8.4) |
0.7 |
No |
106 |
2.2 |
EP Global Opportunities |
128.6 |
0.7 |
35.3 |
51.4 |
178.9 |
(6.4) |
0.9 |
No |
100 |
1.8 |
F&C Investment Trust |
3,892.5 |
9.1 |
50.0 |
90.3 |
270.4 |
(3.8) |
0.6 |
No |
107 |
1.6 |
JPMorgan Elect Managed Growth |
263.9 |
6.1 |
47.7 |
68.4 |
249.0 |
(2.1) |
0.5 |
No |
101 |
1.9 |
Lindsell Train |
383.0 |
33.7 |
129.2 |
236.9 |
746.3 |
83.5 |
0.9 |
Yes |
100 |
1.5 |
Majedie Investments |
136.7 |
(3.9) |
16.4 |
46.8 |
123.2 |
(15.2) |
1.0 |
No |
113 |
4.5 |
Manchester & London |
152.7 |
8.9 |
83.5 |
111.7 |
139.9 |
(5.1) |
1.0 |
No |
100 |
2.7 |
Martin Currie Global Portfolio |
253.8 |
20.3 |
58.9 |
96.6 |
284.3 |
2.0 |
0.6 |
Yes |
100 |
1.4 |
Mid Wynd International |
237.5 |
15.9 |
55.8 |
113.8 |
315.8 |
2.8 |
0.7 |
No |
100 |
1.0 |
Monks |
2,058.7 |
12.1 |
76.4 |
109.1 |
279.1 |
4.7 |
0.5 |
No |
106 |
0.2 |
Scottish Investment Trust |
631.2 |
(1.0) |
35.3 |
56.7 |
197.0 |
(8.0) |
0.4 |
No |
100 |
3.1 |
Scottish Mortgage |
8,188.6 |
4.2 |
95.9 |
157.0 |
576.0 |
3.3 |
0.4 |
No |
100 |
0.6 |
Average |
1,460.2 |
9.3 |
58.5 |
94.5 |
282.2 |
1.9 |
0.7 |
103 |
1.9 |
|
WTAN rank in group (16 trusts) |
5 |
11 |
13 |
10 |
8 |
8 |
6 |
2 |
6 |
Source: Morningstar, Edison Investment Research. Note: *Performance data to 2 July 2019 based on ex-par NAV. TR = total return. Net gearing is total assets less cash and equivalents as a percentage of net assets. **Two of WTAN’s managers are eligible for performance fees.
In Exhibit 10, we show the 16 members of the recently reorganised AIC Global sector. WTAN’s NAV total returns are below the sector average over the periods shown. The trust is trading on a narrower discount than its closest peer Alliance Trust; the only other fund in the sector with a fully multi-manager investment strategy. Excluding Lindsell Train, which trades on a very large premium, WTAN’s discount is lower than the sector average. Its ongoing charge is modestly above average, and the trust is one of only three funds with a performance fee element. WTAN’s level of gearing is higher than average and it has a competitive dividend yield, ranking in the top third (0.2pp above the mean).
The board
There are currently nine directors on WTAN’s board, of whom eight are independent of the manager. Chairman Harry Henderson joined the board in 1988 and assumed his current role in 2003; he has announced his intention to retire at the May 2020 AGM. Tony Watson is the senior independent director and was appointed in February 2006. Richard Oldfield joined the board in May 2011, Suzy Neubert in April 2012, Ben Rogoff in October 2016, Jack Perry in January 2017 and Paul Yates in May 2018. Andrew Ross was recently appointed as a director (effective from 2 May 2019), with the intention of becoming WTAN’s chairman in 2020. He has more than 30 years’ investment experience, most recently as vice chairman of wealth management at Schroders, with previous roles including CEO of Cazenove Capital Management, CEO of HSBC Asset Management (Europe) and managing director of James Capel Investment Management. The non-independent director is Andrew Bell, CEO of WTAN, who joined the board in February 2010.
|
|
Research: Investment Companies
JPMorgan Global Growth & Income (JPGI) has enhanced its management team following the retirement of manager Jeroen Huysinga, with co-manager Tim Woodhouse now supported by Helge Skibeli and Raj Tanna, two of the principal architects of the research-driven global focus investment approach that JPGI follows. While the underlying investment philosophy, backed by more than 50 dedicated research analysts, is unchanged and JPGI remains a relatively concentrated ‘best ideas’ portfolio, the new team has a greater focus on quality companies that can compound returns over the long term. The managers say that reducing regional risk should maximise the contribution of individual stock positions to returns versus the MSCI AC World benchmark, and lower volatility.