Last close As at 05/08/2026
GBP2.61
▲ −0.50 (−0.19%)
Market capitalisation
GBP597m
Research: Investment Companies
Henderson Far East Income (HFEL) is a relatively concentrated portfolio of 40-60 Asian equities, aiming to generate high income with the potential of long-term capital growth. Since February 2007, HFEL has been managed by Michael Kerley. Against a backdrop of the recent rebound in Asian stock markets, he suggests that the attraction of income from Asian equities has not diminished even though he believes investors have been focusing on growth rather than income. HFEL’s 5.7% dividend yield is the highest in its peer group. Having traded at a modest discount for part of 2016, HFEL has returned to trading at a premium.
Henderson Far East Income |
High income and capital growth potential |
Investment companies |
15 May 2017 |
Share price/discount performance
Three-year performance vs index
Gearing
Analysts
|
||||||||||||||||||||||||||||||||||||||||||||||||||||||||||||||||||||||||||||||||||||||||||||||||
Henderson Far East Income (HFEL) is a relatively concentrated portfolio of 40-60 Asian equities, aiming to generate high income with the potential of long-term capital growth. Since February 2007, HFEL has been managed by Michael Kerley. Against a backdrop of the recent rebound in Asian stock markets, he suggests that the attraction of income from Asian equities has not diminished even though he believes investors have been focusing on growth rather than income. HFEL’s 5.7% dividend yield is the highest in its peer group. Having traded at a modest discount for part of 2016, HFEL has returned to trading at a premium.
12 months ending |
Share price |
NAV |
FTSE AW Asia Pac. |
FTSE All World (%) |
FTSE All-Share (%) |
30/04/13 |
31.3 |
27.8 |
18.2 |
20.9 |
17.8 |
30/04/14 |
(13.1) |
(11.5) |
(6.7) |
6.0 |
10.5 |
30/04/15 |
21.1 |
21.2 |
23.0 |
18.9 |
7.5 |
30/04/16 |
(13.4) |
(10.4) |
(11.5) |
(0.3) |
(5.7) |
30/04/17 |
35.7 |
29.4 |
36.3 |
31.2 |
20.1 |
Source: Thomson Datastream. Note: All % on a total return basis in pounds sterling.
Investment strategy: Focused on income
Manager Kerley seeks high income and capital growth from a diversified portfolio of Asian equities. The portfolio is split relatively equally between companies offering a current high dividend yield and companies with potential for high dividend growth. The manager and his team undertake in-depth fundamental research including detailed company modelling, with a focus on cash flow generation. There are no restrictions on either geographic or sector exposure – at end-March 2017, the largest country exposure was in China (c 21%), with the largest sector exposure in financials (c 33%). Gearing of up to 15% of gross assets is permitted, although at end-March 2017, HFEL was ungeared.
Market outlook: Asian equities relatively attractive
Asian equities have underperformed world equities in recent years due to lack of investor appetite for Asian equities. However, so far in 2017, consensus estimates are being revised upwards, which offers the potential for Asian equities to be rerated. Over time, high-dividend Asian equities have delivered superior performance versus the broader Asian market. For investors seeking exposure to the region, a fund offering a high level of income with the prospect of long-term capital growth may appeal.
Valuation: Back to trading at a premium
During part of 2016, HFEL’s share price traded at a modest discount to cum-income NAV, in an environment where investors sought growth rather than income, and HFEL experienced a period of relative underperformance versus its peers. Its current 1.7% premium compares to an average 0.4% discount over the last 12 months (range of a 4.4% premium to an 8.7% discount). HFEL’s annual dividend has compounded at 5.9% per annum over the last five years; its current dividend yield is 5.7%.
Exhibit 1: Fund at a glance
Investment objective and fund background |
Recent developments |
||||||||||||||||||||||||||||||||||||||||||||||||||||||||||||||||||||||
Henderson Far East Income aims to provide investors with a high level of dividends and capital appreciation over the long term, from a diversified portfolio of investments traded on the Pacific, Australasian, Japanese and Indian stock markets (Asia-Pacific region). The fund is classified by the AIC in the Asia Pacific ex-Japan category, and, while it does not have a benchmark, sees the FTSE All World Asia Pacific ex-Japan Index as providing the most appropriate comparator. While the fund can hold Japanese investments, they are not expected to be a substantial part of total assets. |
■ 24 April 2017: Six month results ending 28 February. NAV TR +7.3% and share price TR +5.5%. FTSE AW Asia Pacific ex-Japan Index TR (in sterling) +11.9%. ■ 21 April 2017: Second quarterly dividend of 5.1p declared for the year ending 31 August 2017, 4.1% higher than Q216. ■ 26 January 2017: First quarterly dividend of 5.1p declared for the year ending 31 August 2017, 4.1% higher than Q116. ■ 17 January 2017: HFEL director Julia Chapman appointed to the board of BH Global. |
||||||||||||||||||||||||||||||||||||||||||||||||||||||||||||||||||||||
Forthcoming |
Capital structure |
Fund details |
|||||||||||||||||||||||||||||||||||||||||||||||||||||||||||||||||||||
AGM |
December 2017 |
Ongoing charges |
1.17% (FY16) |
Group |
Henderson Global Investors |
||||||||||||||||||||||||||||||||||||||||||||||||||||||||||||||||||
Final results |
November 2017 |
Net gearing |
0.0% |
Manager |
Michael Kerley |
||||||||||||||||||||||||||||||||||||||||||||||||||||||||||||||||||
Year end |
31 August |
Annual mgmt fee |
0.9% |
Address |
201 Bishopsgate, |
||||||||||||||||||||||||||||||||||||||||||||||||||||||||||||||||||
Dividend paid |
Feb, May, Aug, Nov |
Performance fee |
None |
||||||||||||||||||||||||||||||||||||||||||||||||||||||||||||||||||||
Launch date |
2006 (as a Jersey co) |
Company life |
Indefinite |
Phone |
020 7818 1818 |
||||||||||||||||||||||||||||||||||||||||||||||||||||||||||||||||||
Continuation vote |
No |
Loan facilities |
£35m two years |
Website |
|||||||||||||||||||||||||||||||||||||||||||||||||||||||||||||||||||
Dividend policy and history (financial years) |
Share buyback/issuance policy and history (calendar years) |
||||||||||||||||||||||||||||||||||||||||||||||||||||||||||||||||||||||
Dividends paid quarterly. The company aims to distribute substantially all its income (after costs) arising in each accounting period. |
HFEL is authorised to repurchase up to 14.99% of its ordinary shares, to hold up to 10% of shares in treasury and to issue up to 10% of shares. |
||||||||||||||||||||||||||||||||||||||||||||||||||||||||||||||||||||||
|
|
||||||||||||||||||||||||||||||||||||||||||||||||||||||||||||||||||||||
Shareholder base (as at 31 March 2017) |
Geographical breakdown of portfolio (as at 31 March 2017) |
||||||||||||||||||||||||||||||||||||||||||||||||||||||||||||||||||||||
|
|
||||||||||||||||||||||||||||||||||||||||||||||||||||||||||||||||||||||
Top 10 holdings (as at 31 March 2017) |
|||||||||||||||||||||||||||||||||||||||||||||||||||||||||||||||||||||||
|
|||||||||||||||||||||||||||||||||||||||||||||||||||||||||||||||||||||||
Source: Henderson Far East Income, Edison Investment Research, Morningstar, Bloomberg. Note: *N/A where not in March 2016 top 10.
Market outlook: Potential for rerating of Asian equities
The outlook for economic growth in Asia remains relatively high. In its April World Economic Outlook, the International Monetary Fund forecasts annual growth for 2017 to 2022 for the Asia Pacific ex-Japan region of 5.6% versus 3.7% for the world and 2.0% for the US over this period. Factors include a growing middle class and relatively low levels of consumer and corporate debt.
Over the last few years, Asian consensus earnings estimates have regularly started the year too optimistically before being revised down. This may be the reason why Asian equities remain relatively inexpensive compared to world equities (Exhibit 2, right-hand side); the forward P/E multiple of Asian equities is 2.6 points cheaper than for world equities. However, so far in 2017, consensus Asian earnings revisions are positive for the first time in several years, which may lead to a rerating of Asian equities. Exhibit 2 (left-hand side) shows that over the last 10 years, high dividend yielding Asian stocks have meaningfully outperformed Asian equities as a whole, so for investors seeking exposure to Asia, a fund aiming to generate a high level of income and long-term capital growth may be of interest.
|
Exhibit 2: Market performance and valuation |
|||||||||||||||||||||||||||||||||||||||||||||||||||||||||||||||||||
Performance of indices (in sterling terms) |
Valuation metrics of Datasteam indices (as at 11 May 2017) |
||||||||||||||||||||||||||||||||||||||||||||||||||||||||||||||||||
|
|
||||||||||||||||||||||||||||||||||||||||||||||||||||||||||||||||||
|
Source: Thomson Datastream, Edison Investment Research |
|||||||||||||||||||||||||||||||||||||||||||||||||||||||||||||||||||
Fund profile: High and growing income
HFEL was incorporated in Jersey in 2006 as a rollover vehicle for Henderson Far East Income Trust and is listed on the London and New Zealand stock exchanges. The company aims to provide a high level of income and long-term capital growth from a portfolio invested in the Asia-Pacific region including Asia, Australasia and a modest exposure to Japan. Although HFEL has no formal benchmark, its performance is measured against the FTSE AW Asia ex-Japan Index. The company has been managed by Mike Kerley since February 2007; he is Henderson Global Investors’ pan-Asian equities director and is based in London. Kerley works alongside fund manager Sat Duhra and a team of analysts who are based in Singapore.
HFEL is a member of the AIC Asia Pacific ex-Japan sector and is one of a small group of funds focusing on income – the company has the highest dividend yield in the sector by some margin, investing in companies that currently offer a high dividend yield as well as companies with the prospect of high dividend growth. Investments may include debt securities, warrants and other equity-related securities such as unlisted companies that are soon to be listed. There are no restrictions on geographic or sector exposure. Derivatives may be used for efficient portfolio management, income enhancement or to mitigate risk. Gearing of up to 15% of gross assets is permitted, however, as at end-March 2017, HFEL was ungeared.
The fund manager: Michael Kerley
The manager’s view: Compelling outlook for Asian income
Manager Michael Kerley believes that the long-term outlook for income for Asian equities is compelling given the availability of companies with low capex and high free cash flow, which offers the potential for high and rising income for shareholders. He comments that 2017 has started very well from a macro perspective, with economic data, corporate earnings and stock market performance all coming through at the strongest pace since the start of 2009. Asian exports have increased, not just to the US, but also within the Asian region, which is the destination for the majority of exports. Earnings estimates have been very positive in 2017, unlike in the prior five years, when estimates had continually been downgraded. At the start of 2016, estimates were for double-digit earnings growth for the year; however, the final result was a much more modest 4% growth in earnings. Year-to-date in 2017, earnings growth estimates have been revised higher from 10% to 12-13% – this is the first incidence of upgrades in a number of years. The manager reports that while Asian earnings estimates are rising across the board, with the exception of India, Asian companies are generally optimistic; those that are most bullish operate in cyclical sectors such as commodities, consumer discretionary and industrials. Although defensive company stocks have underperformed cyclical shares in recent months, the manager suggests that defensive businesses are still generally in good shape.
Kerley is, however, mindful of macro risks, which are mainly global rather than Asia-centric; these include uncertainty about US policy under President Trump, the pace of US interest rate rises and the UK’s departure from the European Union – although the manager does voice concerns about territorial disputes in the South China Sea and risks posed by North Korea. Kerley believes that many world stock markets are currently trading at unrealistic valuations, that volatility will increase and a global stock market correction is possible, which he considers would be healthy, enabling him to purchase his preferred stocks at a lower level. Given the manager’s near-term caution, HFEL is currently ungeared, although this is a function of trimming positions rather than aiming for zero gearing.
Kerley believes that in relative terms, the valuations of Asian equities remain attractive. On a price-to-book basis, there has been a modest upward adjustment since early-2016, but stocks in aggregate are still trading at a low level compared with history. There has been a continued decline in the return on equity of Asian companies over the last six years, which has made investment in Asian equities less attractive. The manager suggests that if Asian return on equity improves as a result of higher earnings, Asian equities have the potential to be rerated. He argues that on a forward P/E basis, Asian equities are trading at compelling levels versus world equities: one standard deviation below the long-term average.
Asset allocation
Investment process: Disciplined, bottom-up approach
Manager Kerley and his team invest on a bottom-up basis, with an awareness of the macro environment. They seek income and long-term capital growth from companies with either a high dividend yield or potential for high dividend growth, which have strong fundamentals and are trading at a discount to the manager’s perceived value of their underlying businesses. The team undertakes detailed company modelling with a focus on cash flow, which the manager believes is the key to understanding how a business operates. HFEL’s portfolio is typically 40-60 stocks and is diversified by geography and sector, although there are no defined limits on either classification.
The manager and his team focus on qualitative as well as quantitative factors; for example, meeting company managements is a key part of the investment process. The portfolio is broadly split between companies with high dividends and those with the potential for high dividend growth, although the manager currently has a bias towards dividend growth names due to their better expected total returns. Over time, the percentage exposure to high dividend is unlikely to fall below 45% to ensure that HFEL’s revenue is sufficient to cover its dividend. HFEL’s portfolio is currently generating robust levels of income, helped by sterling weakness, which is also contributing to capital appreciation. This has enabled the manager to have a greater focus on dividend growth and has resulted in near-term lower portfolio turnover. In FY16, turnover was 80.4%, which was broadly in line with the average of the last five years.
There are also very positive trends in dividend surprises, such as Indian telecom infrastructure company Bharti Infratel, which announced a dividend that was 85% higher than consensus estimates, and China Yangtze Power, with a dividend 77% higher than expected. While the timing of dividend payments is not a primary investment consideration, Kerley is unlikely to sell a company before a dividend payment is made and likely to buy a company after a dividend payment.
The manager selectively writes options to generate additional income; on average c 10 are written each year, generating c £1.5m. This can provide investment flexibility, by allowing the purchase of lower-yielding companies without affecting the overall dividend yield of HFEL’s portfolio. The maximum option exposure is 10% of NAV, although in practice is much lower. Kerley wrote four options in H117 raising £900k; none have been written since, but he intends to write covered call options on holdings he considers fairly valued when stock market volatility increases, providing greater opportunities for additional income generation, although with higher risk.
Exhibit 3: HFEL portfolio metrics versus FTSE AW Asia Pacific ex-Japan Index
HFEL |
Index |
Difference |
|
Price/book (x) |
1.6 |
1.6 |
0.0 |
Price/earnings FY1 estimated (x) |
13.4 |
13.7 |
(0.3) |
Dividend yield (%) |
4.0 |
2.9 |
1.1 |
Dividend yield % FY1 estimated (%) |
4.4 |
3.1 |
1.3 |
Free cash flow yield, ex-financials (%) |
8.5 |
5.2 |
3.3 |
Return on equity (%) |
8.9 |
10.0 |
(1.1) |
Three year growth in EPS (%) |
7.1 |
3.8 |
3.3 |
Source: Henderson Far East Income. Note: Data as at 31 March 2017.
A comparison between HFEL’s portfolio and the FTSE AW Asia Pacific ex-Japan Index is shown in Exhibit 3. The portfolio valuation on a price-to-book and forward P/E basis is broadly in line with the index, but it has a higher dividend and free cash flow yield, reflecting its income mandate and focus on quality companies with strong cash flow generation.
Current portfolio positioning
As at end-March 2017, HFEL’s top 10 positions comprised 30.0% of the portfolio, which was an increase in concentration versus 26.9% at end-March 2016. Samsung was the largest, a c 5% holding. Having previously run what was essentially an equal stock portfolio, in Q316 the manager made a conscious move to have higher weightings in HFEL’s top five stocks such as Samsung and Rio Tinto. This mirrors the more concentrated approach in the Asian segments of Bankers Trust and Henderson International Income Trust, which Kerley also runs, and which have performed strongly.
Two recent additions to the portfolio are Melco Resorts & Entertainment and Fairfax Media. Melco is listed in the US; it has a casino in Macau with another about to open, as well as other properties in Manila. The manager is positive on the outlook for Macau; its economy had been weak in light of lower Chinese demand due to a crackdown on corruption, and the region had a tarnished reputation as a location for money laundering. However, Macau is now developing as a tourist and leisure destination. Although 90% of revenues are still generated from gaming, over time, the economy should become more diversified. In Macau, gaming revenues are six times the level in Las Vegas, but there are only 25,000 versus 150,000 hotel rooms. Increased hotel capacity in Macau is a key factor in changing it to more of a leisure destination. Melco is bringing on hotel capacity over the next six to 12 months, its capex has peaked and free cash flow is strong. The company paid an 8% special dividend earlier in 2017.
The manager comments that Australia is not usually a source of interesting new investment ideas, but he has recently purchased multimedia company Fairfax Media. Its traditional print operations are in secular decline, struggling against the rise of online media. However, Fairfax also has a high-growth online real estate business called domain.com. The manager suggests that the low valuation of the overall company means that an investor can get Fairfax’s cash-generative, legacy businesses essentially for free. The company has a c 4% dividend yield and its stock price has rallied by more than 30% on reports of a potential bid. There is also the potential for a partial listing of domain.com. Despite Fairfax’s recent share price rise, the manager believes that there is potential for further upside.
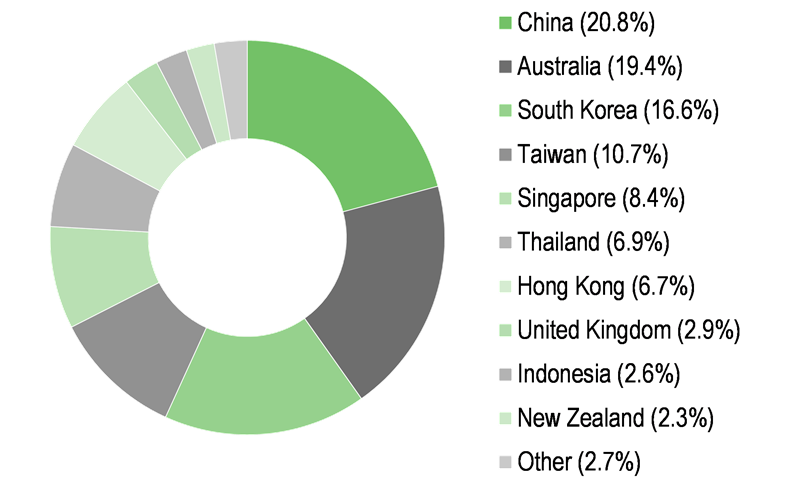
Exhibit 4 shows HFEL’s geographic exposure; over the last 12 months the largest increase is in China, with decreases in Australia and Singapore. However, the manager stresses that all changes are a result of bottom-up investment decisions.
Exhibit 4: Portfolio geographic exposure vs FTSE Asia Pacific ex-Japan (% unless stated)
Portfolio end-March 2017 |
Portfolio end- March 2016 |
Change |
Index weight |
Active weight vs index (pp) |
Fund weight/ index weight (x) |
|
China |
20.8 |
14.6 |
6.2 |
19.6 |
1.2 |
1.1 |
Australia |
19.4 |
21.8 |
(2.4) |
21.7 |
(2.3) |
0.9 |
South Korea |
16.6 |
15.5 |
1.1 |
13.9 |
2.7 |
1.2 |
Taiwan |
10.7 |
8.8 |
1.9 |
11.3 |
(0.6) |
0.9 |
Singapore |
8.4 |
10.5 |
(2.1) |
3.8 |
4.7 |
2.2 |
Thailand |
6.9 |
3.9 |
3.0 |
2.9 |
4.1 |
2.4 |
Hong Kong |
6.7 |
7.7 |
(1.0) |
10.6 |
(3.9) |
0.6 |
United Kingdom |
2.9 |
N/S |
N/A |
0.0 |
2.9 |
N/A |
Indonesia |
2.6 |
2.6 |
0.0 |
2.2 |
0.4 |
1.2 |
New Zealand |
2.3 |
2.5 |
(0.2) |
0.7 |
1.6 |
3.4 |
India |
N/S |
3.9 |
N/A |
9.6 |
N/A |
N/A |
Other |
2.7 |
8.2 |
(5.5) |
3.9 |
(1.2) |
0.7 |
100.0 |
100.0 |
100.0 |
Source: Henderson Far East Income, Edison Investment Research. Note: N/S – not separately stated.
As noted above regarding changes in geographic exposure over the last 12 months, changes on a sector basis (Exhibit 5) have also been made on a stock-specific basis. HFEL’s exposure to the defensive consumer goods and cyclical oil & gas sector has increased, with the largest reduction in exposure to the defensive utility sector.
Exhibit 5: Portfolio sector exposure vs FTSE Asia Pacific ex-Japan (% unless stated)
Portfolio end-March 2017 |
Portfolio end- March 2016 |
Change (pp) |
Index weight |
Active weight vs index (pp) |
Fund weight/ index weight (x) |
|
Financials |
32.5 |
31.4 |
1.2 |
35.5 |
(3.0) |
0.9 |
Industrials |
12.6 |
10.2 |
2.4 |
11.5 |
1.1 |
1.1 |
Telecommunications |
12.6 |
16.4 |
(3.8) |
4.4 |
8.2 |
2.9 |
Technology |
11.5 |
14.9 |
(3.4) |
11.2 |
0.2 |
1.0 |
Consumer goods |
10.7 |
5.5 |
5.2 |
13.0 |
(2.3) |
0.8 |
Oil & gas |
8.9 |
4.1 |
4.8 |
5.1 |
3.9 |
1.8 |
Consumer services |
6.5 |
6.2 |
0.3 |
5.6 |
0.9 |
1.2 |
Basic materials |
2.7 |
1.9 |
0.7 |
6.9 |
(4.2) |
0.4 |
Utilities |
2.0 |
9.3 |
(7.3) |
3.5 |
(1.5) |
0.6 |
Healthcare |
0.0 |
0.0 |
0.0 |
3.4 |
(3.4) |
0.0 |
100.0 |
100.0 |
100.0 |
Source: Henderson Far East Income, Edison Investment Research
Recent positions that have been sold completely include companies in defensive sectors such as Korea Electric Power, AGL Energy (Australian electric utility) and Duet (Australian pipelines), as the manager has focused more on adding to companies offering the prospect of dividend growth rather than a current high level of dividend income, such as Samsung Electronics, and Rio Tinto, which is benefiting from a cyclical recovery.
The manager highlights the improving corporate governance record for HFEL’s largest holding, Samsung Electronics. The company is offering investors higher levels of disclosure and is increasing returns to shareholders via dividends and share repurchases. Catalysts for this change in behaviour include pressure from activist shareholder Elliott Management and from the Korean National Pension Scheme, which wants the chaebols (Korean conglomerates) to be more active in distributing dividends. The manager points out that although Samsung’s corporate governance record is improving, the company still has only a modest commitment to distributing dividends and there is the potential for a higher payout ratio in the future.
Performance: Record hurt by tough 2016 environment
The manager states that in 2016, HFEL’s NAV total return lagged the index by 9pp. Along with the outperformance of cyclical sectors, such as basic materials and oil & gas during the year, HFEL was also affected by an underweight exposure to banks, which rallied strongly. Its top 10 positive contributors to performance were all cyclical companies such as Samsung, NetEase and Rio Tinto, and all of the top 10 detractors were in defensive areas (REITs, telecoms and utilities). In share price terms, HFEL’s performance over one, three, six and 12 months has been closer to the index (Exhibit 6 right-hand side).
Kerley comments that HFEL has the highest yield in the AIC Asia Pacific ex-Japan sector and that investors have been seeking growth rather than income. He will continue to hold what he considers are attractively valued higher yielding shares and believes that HFEL’s portfolio is well positioned if Asian equities experience a period of higher volatility.
|
Exhibit 6: Investment company performance to 30 April 2017 |
|
Price, NAV and benchmark total return performance, one-year rebased |
Price, NAV and benchmark total return performance (%) |
|
|
|
Source: Thomson Datastream, Edison Investment Research. Note: Three-, five- and 10-year performance figures annualised. |
|
Exhibit 7: Share price and NAV total return performance, relative to indices (%)
|
One month |
Three months |
Six months |
One year |
Three years |
Five years |
10 years |
Price relative to FTSE AW Asia Pacific ex-Japan |
3.8 |
(0.0) |
(0.5) |
(0.5) |
(4.2) |
(1.0) |
1.5 |
NAV relative to FTSE AW Asia Pacific ex-Japan |
0.3 |
(0.2) |
(1.8) |
(5.1) |
(5.3) |
(2.9) |
(5.5) |
Price relative to FTSE All-World |
3.5 |
2.0 |
(1.6) |
3.4 |
(8.5) |
(18.6) |
6.7 |
NAV relative to FTSE All-World |
(0.1) |
1.9 |
(2.8) |
(1.4) |
(9.6) |
(20.2) |
(0.7) |
Price relative to FTSE All-Share |
2.0 |
1.0 |
(2.7) |
12.9 |
16.8 |
2.2 |
50.4 |
NAV relative to FTSE All-Share |
(1.5) |
0.9 |
(3.9) |
7.7 |
15.4 |
0.2 |
40.0 |
Source: Thomson Datastream, Edison Investment Research. Note: Data to end-April 2017. Geometric calculation.
HFEL’s relative performance is shown in Exhibit 7; its NAV total return has lagged the performance of the FTSE AW Asia Pacific ex-Japan Index over the periods shown, with the exception of one month, although its share price performance has been relatively stronger. However, of interest to UK investors, HFEL has outperformed the FTSE All-Share Index over one, three, five and 10 years.
|
Exhibit 8: NAV total return performance relative to FTSE AW Asia Pacific ex-Japan over five years |
|
|
Source: Thomson Datastream, Edison Investment Research |
Capital structure and fees
HFEL is listed in London and New Zealand; it currently has 116.2m ordinary shares in issue. In recent years, there have been significant shares issued to meet investor demand (Exhibit 1). So far in FY17, 1.0m shares have been issued raising £3.7m (average price of 357.5p). HFEL may allot up to 10% and buy back up to 14.99% of shares annually. It has a £35m two-year loan facility with Commonwealth Bank of Australia; if fully drawn, this would represent gearing of c 8% (the company had zero gearing at end-March 2017). The manager uses gearing on a stock-specific basis, rather than as a way of expressing a view on the direction of the Asian stock markets.
Henderson Investment Funds acts as HFEL’s Alternative Investment Fund Manager (AIFM) under the AIFM Directive, and delegates portfolio management to Henderson Global Investors. Henderson is paid an annual management fee of 0.9% of net assets, charged 50:50 to capital and income; no performance fee is payable. For FY16, ongoing charges were 1.17%, which was an 11bp reduction versus the prior year.
Dividend policy and record
HFEL pays dividends quarterly in February, May, August and November. It has a progressive dividend policy; over the last five years, dividends have compounded at an annual rate of 5.9%, which is meaningfully higher than the rate of UK inflation over the period. In FY16, HFEL’s dividend distribution was fully covered by income – the revenue return was 21.13p per share compared to the annual dividend of 20p per share (4.2% higher than the prior year). While the company aims to pay out the majority of its income, over time it has built up a revenue reserve, equivalent to 67% of the FY16 full year distribution. So far in FY17, two interim dividends of 5.1p have been declared; if continued for the balance of the year the dividend yield would remain at 5.7%.
Peer group comparison
HFEL is a member of the AIC Asia Pacific ex-Japan sector. Its NAV total return has lagged the peer group average over the periods shown; however, HFEL’s share price trades at the joint second highest premium to NAV in the group. HFEL has the highest dividend yield in the sector; its current yield of 5.7% is a meaningful 3.5pp higher than the weighted sector average. Its ongoing charge is broadly average and HFEL is currently ungeared.
Exhibit 10: AIC Asia Pacific ex-Japan peer group as at 11 May 2017*
% unless stated |
Market cap £m |
NAV TR |
NAV TR |
NAV TR |
NAV TR |
Discount (ex-par) |
Ongoing charge |
Performance |
Net gearing |
Dividend yield (%) |
Henderson Far East Income |
416.2 |
30.1 |
40.2 |
63.1 |
129.7 |
1.3 |
1.2 |
No |
100 |
5.7 |
Aberdeen Asian Income |
383.9 |
33.1 |
32.2 |
52.1 |
184.3 |
(7.0) |
1.2 |
No |
108 |
4.6 |
Aberdeen Asian Smaller |
359.6 |
29.4 |
37.6 |
70.7 |
285.8 |
(12.3) |
1.8 |
No |
109 |
1.0 |
Aberdeen New Dawn |
254.5 |
44.4 |
38.5 |
56.9 |
157.9 |
(13.1) |
1.1 |
No |
109 |
1.8 |
Edinburgh Dragon |
642.3 |
40.8 |
42.6 |
58.6 |
171.7 |
(11.8) |
1.1 |
No |
107 |
0.9 |
Fidelity Asian Values |
268.6 |
37.0 |
77.3 |
106.3 |
200.8 |
(0.8) |
1.3 |
No |
100 |
1.1 |
Invesco Asia |
223.3 |
47.1 |
69.2 |
101.1 |
206.6 |
(9.6) |
1.0 |
No |
100 |
1.4 |
JPMorgan Asian |
297.6 |
52.4 |
70.1 |
82.0 |
110.6 |
(11.9) |
0.8 |
No |
100 |
4.1 |
Martin Currie Asia Unconstrained |
136.3 |
40.6 |
47.7 |
57.5 |
74.9 |
(11.7) |
1.2 |
No |
102 |
2.1 |
Pacific Assets |
309.2 |
29.7 |
60.3 |
104.2 |
128.3 |
1.9 |
1.3 |
No |
100 |
1.0 |
Pacific Horizon |
134.6 |
47.4 |
53.9 |
67.7 |
108.5 |
(11.9) |
1.1 |
No |
106 |
0.1 |
Schroder Asia Pacific |
659.2 |
50.5 |
71.9 |
89.3 |
188.8 |
(11.9) |
1.1 |
No |
102 |
1.2 |
Schroder Asian Total Return |
224.5 |
42.2 |
70.9 |
81.2 |
139.7 |
(3.1) |
1.0 |
Yes |
100 |
1.3 |
Schroder Oriental Income |
592.6 |
33.9 |
51.7 |
87.9 |
191.4 |
1.3 |
0.9 |
Yes |
103 |
3.6 |
Scottish Oriental Smaller Companies |
316.6 |
33.2 |
50.3 |
94.7 |
295.7 |
(12.1) |
1.0 |
Yes |
90 |
1.1 |
Sector weighted average |
39.1 |
53.5 |
78.1 |
179.8 |
(7.2) |
1.1 |
103 |
2.2 |
||
HFEL rank in sector |
4 |
13 |
12 |
11 |
11 |
2 |
6 |
9 |
1 |
Source: Morningstar, Edison Investment Research. Note: *Performance data as at 10 May 2017. TR=total return. Net gearing is total assets less cash and equivalents as a percentage of net assets.
The board
There are five members on the HFEL board; all are non-executive and independent of the manager. Chairman John Russell was appointed at the company’s inception in November 2006; he was previously on the board of HFEL’s predecessor Henderson Far East Income Trust. The other directors and their years of appointment are David Mashiter (also November 2006), David Staples (January 2011), Julia Chapman (January 2015) and the newest member of the board, Nicholas George (April 2016). The directors have backgrounds in accountancy, asset management, investment banking and law, and the whole board travels to Asia on an annual basis.
Performance tables in New Zealand dollar terms
|
Exhibit 11: Investment company performance – in New Zealand dollar terms to 30 April 2017 |
|
Price, NAV and benchmark total return performance, one-year rebased |
Price, NAV and benchmark total return performance (%) |
|
|
|
Source: Thomson Datastream, Edison Investment Research |
|
The weakness of sterling over the last 12 months due to the UK’s European referendum has enhanced the returns for New-Zealand based investors. While trailing the 22.6% total return of the FTSE AW Asia Pacific ex-Japan Index, HFEL’s NAV and share price total returns over the last 12 months were both higher than 15% (16.4% and 22.0%, respectively). As shown in Exhibit 11 (right-hand side), over the last month HFEL’s NAV has performed modestly better and its share price has outperformed the index, and over three months HFEL has performed broadly in line with the index.
Exhibit 12: Investment company discrete years’ performance – in New Zealand dollar terms
12 months ending |
Share price (%) |
NAV (%) |
FTSE AW Asia Pacific ex-Japan (%) |
FTSE All-World |
FTSE All-Share (%) |
||
30/04/13 |
20.0 |
16.8 |
8.0 |
10.5 |
7.7 |
||
30/04/14 |
(5.9) |
(4.2) |
1.1 |
14.8 |
19.7 |
||
30/04/15 |
24.3 |
24.5 |
26.3 |
22.1 |
10.4 |
||
30/04/16 |
(10.2) |
(7.0) |
(8.1) |
3.4 |
(2.1) |
||
30/04/17 |
22.0 |
16.4 |
22.6 |
18.0 |
8.1 |
||
Source: Thomson Datastream. Note: All % on a total return basis in NZ dollars.
|
|
GFT remains on target and thematic trends are broadly the same. Underlying Q1 revenue growth was solid at 13.3%, helped by 3% more days in the period, and management guidance was maintained. GFT’s retail banking activities remain buoyant, benefiting from digital banking projects in continental Europe and the group’s first retail banking project in the US, while the investment banking backdrop remains challenging, not helped by Brexit and the political changes in the US. With the sustained healthy outlook in digitalisation across the retail banking sector and the prospect of a recovery for the investment banking market (since these businesses need to invest in IT to sustain growth), we believe the shares are looking increasingly appealing on c 13x our FY19e earnings.