Henderson Alternative Strategies Trust
Written by
Henderson Alternative Strategies Trust |
Rebuilding on more solid foundations |
Investment trusts |
9 March 2016 |
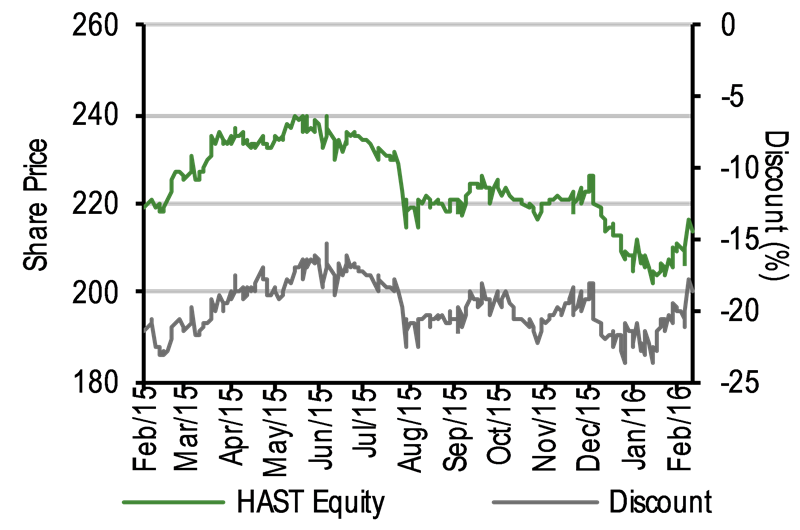
Share price/discount performance
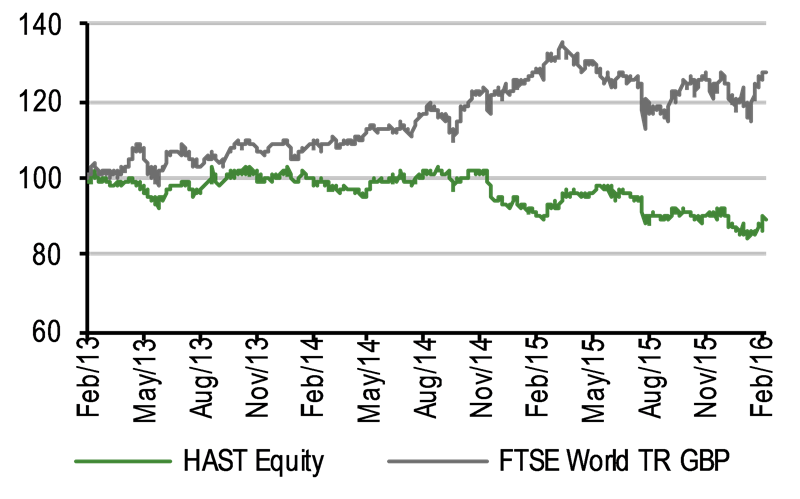
Three-year cumulative perf. graph
Gearing
Analysts
|
|||||||||||||||||||||||||||||||||||||||||||||||||||||||||||||||||||||||||||||||||||||
Henderson Alternative Strategies Trust (HAST, formerly Henderson Value Trust) has been reconstructed into a portfolio of specialist and alternative funds. The managers have focused on private equity, hedge funds, property and specialist sector and geographical funds that individual investors are unable or unlikely to access. The aim is to achieve returns in excess of those from global equities on a three-year view, but with limited correlation to equity markets. The reconstruction is beginning to show through in performance, and over 12 months the trust has outperformed its informal composite benchmark and the FTSE All-Share. The discount remains wide at c 19%, reflecting a difficult history and a climate of investor risk aversion, but has scope to narrow should the performance upturn be sustained.
12 months ending |
Share price |
NAV |
FTSE World |
Composite |
FTSE All-Share |
29/02/12 |
1.1 |
(2.9) |
0.6 |
1.0 |
1.5 |
28/02/13 |
(13.6) |
(11.1) |
16.2 |
14.0 |
14.1 |
28/02/14 |
0.1 |
(2.1) |
8.6 |
3.2 |
13.3 |
28/02/15 |
(10.3) |
(3.8) |
17.1 |
17.9 |
5.6 |
29/02/16 |
(2.6) |
(3.7) |
(1.5) |
(4.5) |
(7.3) |
Source: Thomson Datastream. Note: Total return basis. *Composite index is 75% FTSE Developed Index and 25% FTSE Emerging Index.
Investment strategy: Diverse portfolio of alternatives
Managers Ian Barrass and James de Bunsen specialise in alternative strategies, and can draw on the macro views of Henderson’s wider multi-asset team to identify investment themes. Detailed due diligence is undertaken on individual funds before investment, and the portfolio operates within risk limits on fund type and focus, to ensure diversification. Around 75% of the portfolio is in core, long-term holdings with the balance available for tactical opportunities. The managers have taken a patient approach to exiting legacy holdings to minimise NAV attrition.
Market outlook: An alternative to equity volatility?
World equities have performed strongly in aggregate over the past three years but many stock markets have seen volatility and negative investor sentiment since the start of the year. With returns on ‘risk-free’ assets such as cash and bonds likely to remain muted (and even negative in real terms) as interest rates struggle to rise from historic lows, alternative asset classes may offer the possibility of absolute returns with lower volatility than long-only equities.
Valuation: Scope for discount to narrow
At 7 March HAST’s shares traded at an 18.6% discount to cum-income NAV. While wide, this is in line with the one-year average of 19.7%. Under Henderson the discount has averaged 17.2%. The board manages the discount principally through tender offers, the next of which is likely to be at the start of 2017. The current level of discount may reflect increased investor risk aversion towards non-mainstream assets, as well as HAST’s lacklustre performance history during the reconstruction, meaning there is scope for it to narrow as improvements bed in.
Exhibit 1: Henderson Alternative Strategies Trust at a glance
Investment objective and fund background |
Recent developments |
||||||||||||||||||||||||||||||||||||||||||||||||||||||||||||||||||||||
Henderson Alternative Strategies Trust (renamed from Henderson Value Trust in June 2015) exploits global opportunities to provide long-term growth to shareholders via a diversified, international, multi-strategy portfolio, which offers access to specialist funds including hedge funds and private equity. Previously the SVM Global Trust and originally the Scottish Value Trust, management was transferred to Henderson Global Investors on 1 April 2013. |
■ 21 December 2015: Final results for the year ended 30 September 2015. NAV TR -5.0% compared with +0.8% for the FTSE World Index. NAV TR in the second half (to 30 September) was 6.1% ahead of the index. ■ 22 June 2015: Name changed from Henderson Value Trust to Henderson Alternative Strategies Trust, to better reflect the investment approach, following shareholder approval. |
||||||||||||||||||||||||||||||||||||||||||||||||||||||||||||||||||||||
Forthcoming |
Capital structure |
Fund details |
|||||||||||||||||||||||||||||||||||||||||||||||||||||||||||||||||||||
AGM |
January 2017 |
Ongoing charges |
0.97% |
Group |
Henderson Global Investors |
||||||||||||||||||||||||||||||||||||||||||||||||||||||||||||||||||
Interim results |
May 2016 |
Net cash |
2% (at 31 January) |
Managers |
Ian Barrass, James de Bunsen |
||||||||||||||||||||||||||||||||||||||||||||||||||||||||||||||||||
Year end |
30 September |
Annual mgmt fee |
0.7% |
Address |
201 Bishopsgate, |
||||||||||||||||||||||||||||||||||||||||||||||||||||||||||||||||||
Dividend paid |
February/March |
Performance fee |
None |
||||||||||||||||||||||||||||||||||||||||||||||||||||||||||||||||||||
Launch date |
1991 |
Trust life |
Indefinite, subject to vote |
Phone |
020 7818 1818 |
||||||||||||||||||||||||||||||||||||||||||||||||||||||||||||||||||
Continuation vote |
Three-yearly, next Jan 2018 |
Loan facilities |
None |
Website |
|||||||||||||||||||||||||||||||||||||||||||||||||||||||||||||||||||
Dividend policy and history |
Share buyback policy and history |
||||||||||||||||||||||||||||||||||||||||||||||||||||||||||||||||||||||
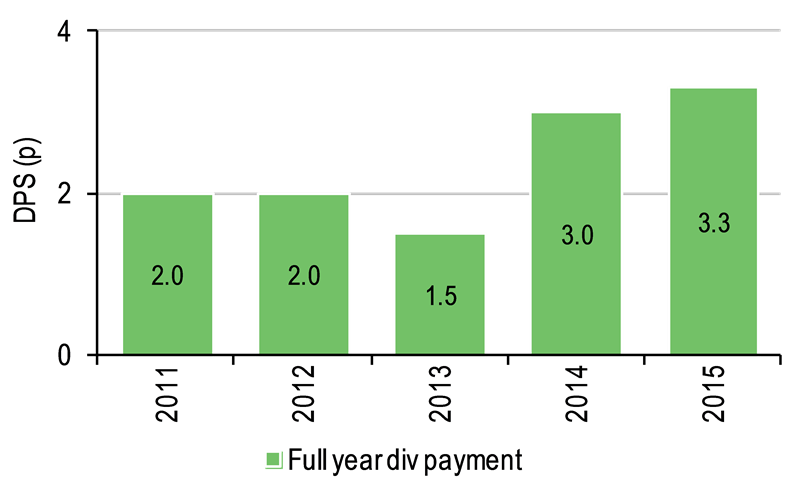
Dividends paid annually in February/March. A more progressive dividend policy was adopted in 2013 to reflect the trust’s greater income focus; previously the board had paid out substantially all of net income as dividends, meaning the dividend could fluctuate from year to year. |
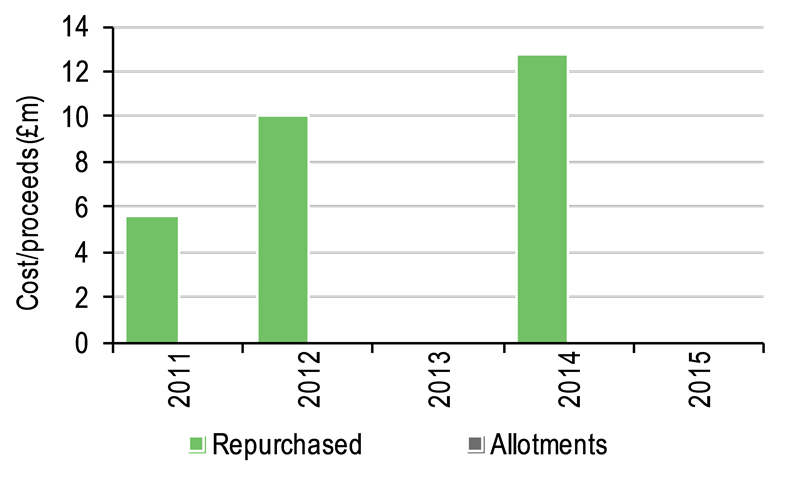
Since April 2013 the board has elected to manage the discount through tender offers (£12.8m bought back in December 2014). The next is likely to take place in late 2016/early 2017 if the shares trade at an average discount to NAV of more than 10% over the financial year to 30 September 2016. |
||||||||||||||||||||||||||||||||||||||||||||||||||||||||||||||||||||||
|
|
||||||||||||||||||||||||||||||||||||||||||||||||||||||||||||||||||||||
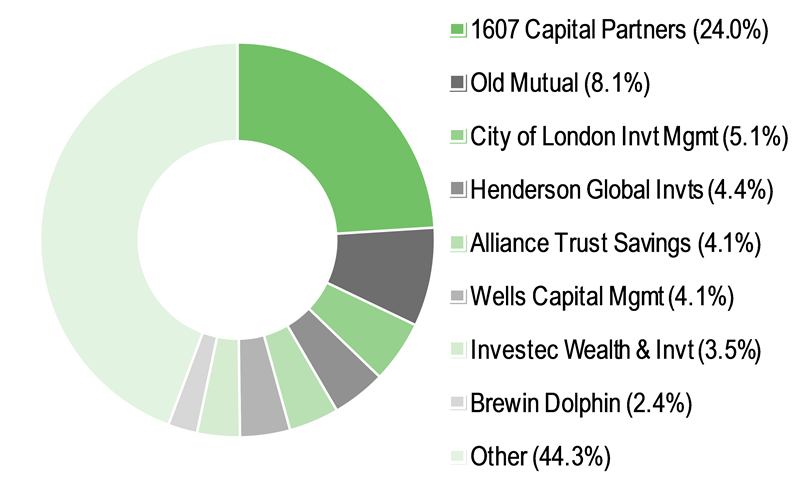
Shareholder base (as at 19 February 2016) |
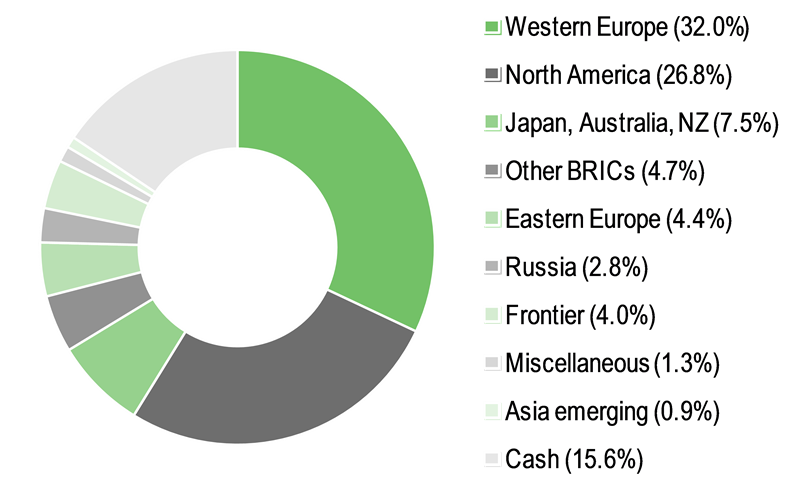
Geographical allocation of portfolio (as at 31 January 2016) |
||||||||||||||||||||||||||||||||||||||||||||||||||||||||||||||||||||||
|
|
||||||||||||||||||||||||||||||||||||||||||||||||||||||||||||||||||||||
Top 10 holdings (as at 31 January 2016) |
|||||||||||||||||||||||||||||||||||||||||||||||||||||||||||||||||||||||
|
|||||||||||||||||||||||||||||||||||||||||||||||||||||||||||||||||||||||
Source: Henderson Alternative Strategies Trust, Edison Investment Research, Morningstar, Thomson Datastream. Note: *N/A where not in July 2015 top 10. **Legacy holding in realisation.
Market outlook: Volatile period for global equities
Global equity markets began 2016 with a period of weakness and volatility that saw the FTSE World Index decline by 5.9% in total return terms during January. At the time of writing, volatility remains elevated, with investors continuing to focus on the negative rather than the positive implications of falling energy prices, as well as lower growth in emerging markets (particularly China) and continued geopolitical tensions in the Middle East. Meanwhile, 10-year government bond yields in developed markets remain at depressed levels, suggesting pressure on prospective returns from so-called ‘risk-free’ assets.
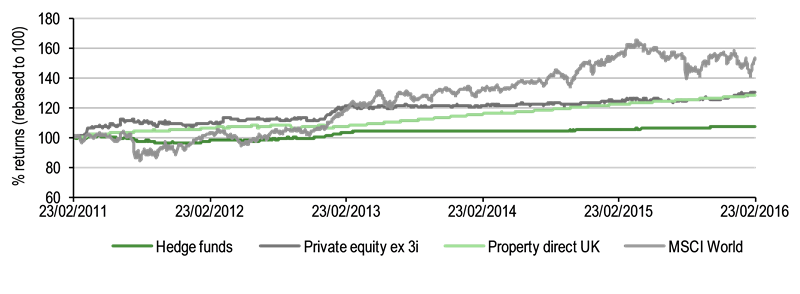
As illustrated in Exhibit 2, global equities have outperformed alternative asset classes (shown as Datastream investment trust sector averages for hedge funds, private equity and UK direct property) over the past five years in total return terms, and particularly so since early 2013. However, volatility of returns for alternative assets has been lower, suggesting that there is scope for these areas to outperform if weakness in equity markets persists into the medium term.
|
Exhibit 2: Total returns of alternative strategies and global equities over five years |
|
|
Source: Thomson Datastream, Edison Investment Research. Note: Uses Datastream indices. |
Fund profile: Accessing alternative opportunities
Henderson Alternative Strategies Trust (HAST) was launched in 1991 as Scottish Value Trust, became Henderson Value Trust in 2013 when Henderson Global Investors took on the mandate, and was renamed in June 2015 to reflect its focus on specialist and alternative assets.
The mandate was awarded to the current managers after a sustained period of poor performance under former manager SVM Asset Management. Ian Barrass and James de Bunsen have been patient in reconstructing the portfolio – which had included many illiquid holdings in out-of-favour areas – to minimise NAV attrition. As of the 30 September 2015 year-end the reconstruction was largely complete. Some 16% of the portfolio (as of January 2016) is still in realisation situations, although this could reduce quite rapidly.
As well as focusing on explaining the new structure and strategy to attract and retain investors, HAST has been active in managing its share register to safeguard the interests of continuing holders. Three large shareholders accounting for c 25% of assets left the register following the January 2015 tender offer and were replaced with a larger number of smaller holders, minimising the impact on the share price from a possible overhang of stock.
HAST uses the FTSE World Index as a benchmark, in recognition of its aim of achieving returns in excess of those of global equities over a three-year time frame. As an informal performance measure it also uses a composite of 75% FTSE Developed and 25% FTSE Emerging indices, which more accurately reflects the likely geographical make-up of the portfolio.
The fund managers: Ian Barrass and James de Bunsen
The managers’ view: Threefold focus to navigate volatility
Having taken on the trust in April 2013, Barrass and de Bunsen are now in the closing stages of reorganising it from a deep-value fund with a slant to emerging markets into a portfolio of specialist and alternative strategies. The core portfolio (77% of assets at FY15) is in place, and the managers are building exposure to shorter-term tactical opportunities as remaining legacy positions are exited.
At this point in the global economic cycle the managers believe equities are better placed than nominal fixed income. They favour developed over emerging markets, but are aware of heightened investor risk aversion as support from extraordinary monetary policy wanes, and as such for their core holdings they prefer hedged strategies to long-only equity exposure. Hedge fund managers can benefit from greater market volatility, and in the current climate the managers are avoiding market-neutral funds and focusing on those with a proven track record of capital preservation. In their tactical allocation they hold some mainstream Japanese and European equity funds, as these markets continue to enjoy policy support and are also experiencing earnings upgrades.
Private equity is currently the largest strategy exposure, with the managers arguing that privately owned companies are generating better revenue performance than many listed companies. Barrass says the listed private equity sector has “massively improved its game” since the financial crisis, with fewer overcommitment concerns and better levels of transparency and disclosure.
The specialist sector allocation is the third major area of focus in the rebuilt portfolio, with the managers favouring specialist credit funds – mainly those focusing on corporate loans and collateralised loan obligations (CLOs). They argue that loan funds have been unfairly marked down because of problems in the energy sector, which makes up a significant proportion of high-yield bond issuance but is a far less significant element of the loans universe. Property exposure is relatively low, with the prime UK story having “largely played out”, although the managers have holdings in some regional UK funds and are considering opportunities in European property.
Areas where they have reduced exposure include emerging markets – where they are wary of ‘value traps’ and expect economic growth to be the weakest since 2009 – and commodities.
Looking ahead, the managers expect the developed market focus to be beneficial, and say the HAST strategy could become increasingly relevant to investors in a lower-return environment.
Asset allocation
Investment process: Blending specialist and alternative funds
HAST’s managers, Ian Barrass and James de Bunsen, are responsible for alternative strategies in Henderson’s multi-asset team. Their aim with HAST is to exceed long-term global equity returns by investing in a portfolio of 30-40 alternative and specialist funds that are good quality, but in which private investors would be unable or unlikely to invest.
The managers are able to draw on the insights of the wider multi-asset team to help shape their top-down and thematic views. Some holdings will be chosen because they fit with certain themes, while other choices will be more fund-specific. All potential holdings are subject to rigorous due diligence and analysis, with the managers seeking to understand a fund’s drivers of risk, return and the likely timescale over which returns will be achieved. HAST aims to outperform global equities on a three-year view, and has return targets for individual holdings of between 8% and 20% a year.
Holdings fall into one of five categories, each of which is subject to risk limits (Exhibit 3 shows the limits as well as exposures at FY15 and FY14). Up to 25% of the portfolio may be invested in tactical (shorter-term) opportunities in these groups, but the bulk of the portfolio is in funds that the managers expect to hold for the longer term. Unlisted funds without redemption rights tend to have a smaller weighting (c 15% at 30 September 2015) because they may be harder to exit.
Exhibit 3: Strategy split and risk limits
Specialist sector |
Specialist geography |
Private equity |
Hedge funds |
Property |
Listed* |
Unlisted** |
|
% at 30 September 2015 |
30 |
14 |
31 |
17 |
8 |
67 |
33 |
% at 30 September 2014 |
40 |
21 |
22 |
13 |
4 |
66 |
34 |
Min/max holding |
Max 20% per sector |
Max 50% EM |
0-35% |
0-30% |
0-20% |
50-70% |
30-50% |
Source: Henderson Alternative Strategies Trust, Edison Investment Research. Note: *Listed funds include investment trusts, REITs and ETFs. **Unlisted funds (eg UCITS) may be with or without redemption rights.
The managers have been decisive in closing out some legacy positions where they feel fundamentals have deteriorated, such as in the energy and timber sectors, but have been more patient with other holdings such as insurance sector private equity specialist BP Marsh, where HAST worked with the company and the brokers to sell into a gradually rising share price and exited the position at close to the target return without flooding the market with stock.
The managers tend not to hedge currency exposure, although they do hold a hedged share class in a Japanese ETF.
Current portfolio positioning
At 31 January 2016 HAST had 64 holdings, including 21 (11 of which were sub-0.5% positions) in the process of realisation. At a strategy level the biggest change over the 2015 financial year was a reduction in specialist sector funds (-10pp), driven by exits from commodity funds. Private equity saw the biggest increase (+9pp), while a 7pp fall in specialist geography was a result of reduced exposure to emerging markets.
The hedge fund weighting rose modestly over the year, but could go up further following an increase in the maximum allocation from 20% to 30% at the January 2016 AGM. There are now four core holdings in this area: BlackRock European Hedge Fund; the US-focused Pershing Square Holdings; CT Invest, a small London-based, Europe-focused fund with a trading overlay; and new investment Indus PacifiChoice Asia, which is a pan-Asian fund with a bias towards Japan.
Of the 31% exposure to private equity at FY15, 21% was in core holdings and 10% in realisation (principally legacy positions). The core investments (of which there are seven, with one or two more likely to be added over the current financial year) are a mix of mainstream funds and special situations. Examples of mainstream funds include Princess Private Equity and Apax Global Alpha; the former has a mid- to small-cap buyout focus, while the latter is a hybrid fund with a core portfolio of buyout and growth investments alongside some listed companies. Among the special situations are Mantra Secondary Opportunities (which focuses on buying companies in the secondary market from other private equity investors) and Riverstone Energy, a relatively new fund (listed in September 2013) that is still in the process of deploying capital and has hence been able to benefit from the effect of the falling oil price on energy company valuations.
Investment activity in the specialist sector allocation has largely focused on the area of senior loans. Core positions include Blackstone/GSO Loan Financing, which has the flexibility to invest on both sides of the Atlantic, and Europe-focused Toro. Tactical positions taken since the year-end include holdings in Carador Income Fund and Voya Prime Rate Trust, both bought in the expectation that anomalously wide discounts will close.
The portion of the portfolio in realisation has fallen from 21% at the year-end to c 16% in early 2016, and this could halve in the relatively near future if exits are achieved from the two largest legacy holdings, private equity investor Eurovestech and Cuban property fund Ceiba Investments.
Performance: Stabilising as revamp takes effect
|
Exhibit 4: Investment trust performance to 29 February 2016 |
||||||||
Price, NAV and benchmark total return performance, one-year rebased |
Price, NAV and benchmark total return performance (%) |
|||||||
|
|
|||||||
|
Source: Thomson Datastream, Edison Investment Research. Note: Three- and five-year and since inception (SI) performance figures annualised. Inception date is 1 April 2013, when Henderson began managing the trust. |
||||||||
|
Exhibit 5: Share price and NAV total return performance, relative to indices (%) |
||||||||
|
One month |
Three months |
Six months |
One year |
SI |
Three years |
Five years |
|
Price relative to FTSE World |
(2.1) |
(2.2) |
(7.2) |
(1.1) |
(29.7) |
(30.2) |
(47.9) |
|
NAV relative to FTSE World |
(2.2) |
(1.3) |
(6.9) |
(2.2) |
(26.8) |
(27.6) |
(46.6) |
|
Price relative to Composite index* |
(2.2) |
(2.1) |
(6.3) |
2.0 |
(24.7) |
(24.7) |
(42.9) |
|
NAV relative to Composite index* |
(2.3) |
(1.1) |
(6.0) |
0.8 |
(21.6) |
(21.9) |
(41.5) |
|
Price relative to FTSE All Share |
(1.7) |
0.7 |
(1.6) |
5.1 |
(20.4) |
(21.1) |
(40.5) |
|
NAV relative to FTSE All Share |
(1.9) |
1.6 |
(1.3) |
3.9 |
(17.1) |
(18.2) |
(39.0) |
|
|
Source: Thomson Datastream, Edison Investment Research. Note: Data to end-January 2016. Geometric calculation. *Composite index is 75% FTSE Developed Index and 25% FTSE Emerging Index. |
||||||||
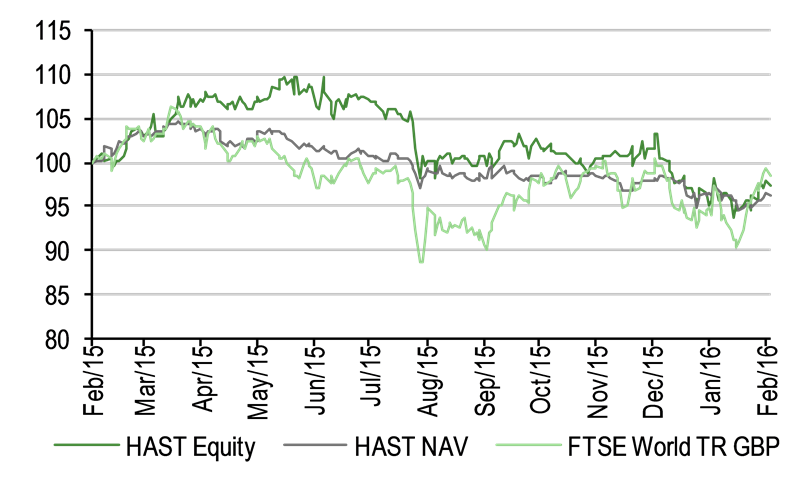
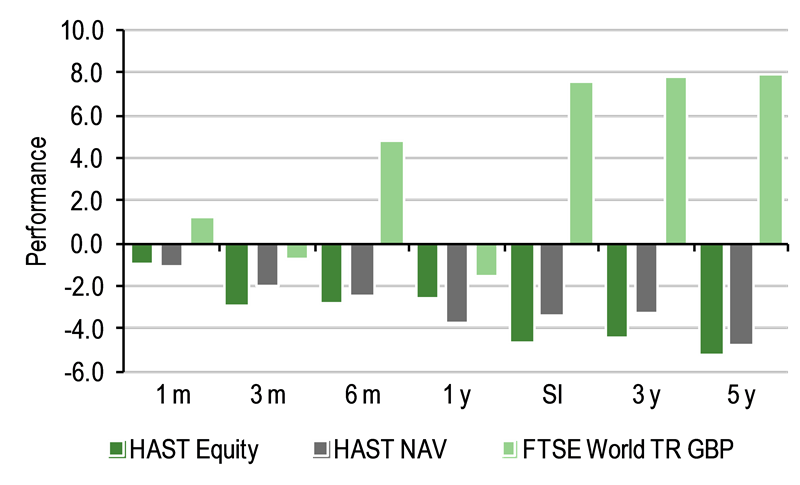
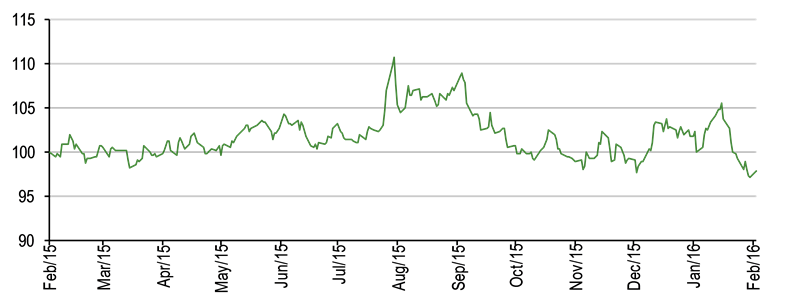
While HAST’s longer-term performance record is challenging, reflecting the issues that led to the appointment of Henderson as fund manager in 2013, over the past year NAV performance has been less volatile than global equity markets (Exhibit 4) and the trust has outperformed the informal composite benchmark (75% Developed/25% Emerging) index and the FTSE All-Share over 12 months. Shorter-term performance has been broadly within two percentage points of index returns (Exhibit 5). With the reconstruction of the portfolio largely complete as of the 30 September 2015 year-end, investors may look for returns to improve towards the high single-digit annualised percentage targeted by the managers. The focus on non-equity assets such as specialist credit, hedge funds, property and private equity means performance is likely to be differentiated from mainstream equity market returns. However, as the trust invests a significant proportion of its assets in listed funds (67% at FY15), continued market volatility could affect the share prices – although not necessarily the underlying net asset values – of these funds.
|
Exhibit 6: NAV performance relative to FTSE World Index over one year |
|
|
Source: Thomson Datastream, Edison Investment Research |
Discount: Wider in recent market volatility
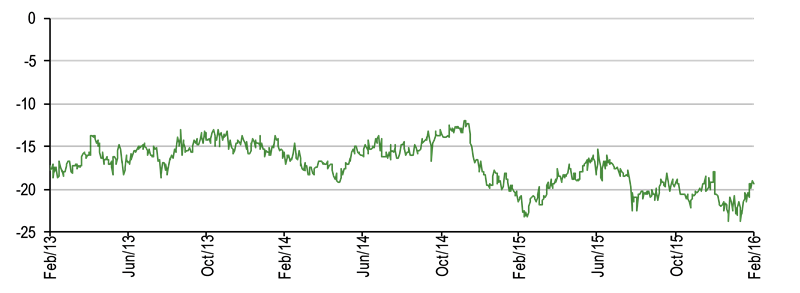
At 7 March HAST’s shares traded at an 18.6% discount to cum-income net asset value. This is wide in comparison with peers and may reflect a period of greater investor risk aversion towards non-mainstream assets. For example, the AIC private equity sector excluding 3i (private equity is HAST’s largest strategy exposure) stood at an average discount of 26.0% at 7 March 2016. Under Henderson, HAST’s discount has averaged 17.2%. This has scope to narrow as the portfolio reconstruction begins to show through in returns. HAST’s board manages the discount by means of tender offers (see below) rather than buybacks if the discount exceeds a set level; the latter may prove inflexible, particularly for funds investing in less liquid assets. Marketing is another key strategy in managing demand, and HAST is keen to attract a wider and longer-term investor base.
|
Exhibit 7: Discount over three years (to cum-income NAV with debt at fair value) |
|
|
Source: Thomson Datastream, Edison Investment Research |
Capital structure and fees
HAST is a conventional investment trust with one class of share. At 7 March there were 42.98m ordinary shares in issue. This number has remained steady since a 10% tender offer in January 2015; another tender (priced at a discount of 5% to NAV less costs) may take place in early 2017 if the shares trade at an average discount to NAV of more than 10% during FY16. HAST has an unlimited life with a continuation vote every three years; the next of these is due at the FY17 AGM.
Henderson receives an annual management fee of 0.7% of net assets, calculated quarterly. Fees are charged 10% to income and 90% to capital, and ongoing charges for FY15 were 0.97%. There is no performance fee. HAST may gear up to 20% through short-term bank borrowing and long-only contracts for difference (CFDS, a type of derivative). At 30 September 2015 there was no borrowing; one CFD contract represented less than 0.1% of total assets. Underlying funds may also use gearing.
Dividend policy and record
At its FY13 results HAST announced that it intended to follow a more progressive dividend policy, having previously paid out a fluctuating dividend that largely reflected income received during the year. The FY14 dividend of 3.0p was double the FY13 dividend, but the board has said future rises are likely to be less dramatic, and the FY15 dividend of 3.3p represents a 10% increase on the previous year. The net revenue return per share in FY15 was 3.72p, meaning that the dividend was fully covered by income, and a small amount was transferred to the revenue reserve, which stood at 4.5p per share at the year-end. Dividends are paid annually in February or March, and HAST’s current yield, based on the FY15 dividend and the 7 March share price of 214.0p, is 1.5%.
Peer group comparison
HAST is a member of the AIC’s new Flexible Investment sector for funds with a multi-asset approach. The sector was formed in December 2015 and includes eight trusts formerly in the Global sector and one each from the Global Equity Income and UK All Companies sectors. It is an understandably diverse group, with few of its members following directly comparable investment strategies. In performance terms, HAST is ranked sixth of 10 for NAV total returns over one year, 10th over three years and eighth of eight over five years, reflecting the trust’s difficult history and period of reconstruction. Risk-adjusted performance as measured by the Sharpe ratio is also below average over one and three years. The yield is in line with that of most peers, and charges are a little below average. HAST’s discount to NAV is the second-widest in the group.
Exhibit 8: AIC Flexible Investment sector as at 29 February 2016
% unless stated |
Market cap £m |
TR 1 Year |
TR 3 Year |
TR 5 Year |
Ongoing charge |
Perf. fee |
Discount/ premium |
Net gearing |
Dividend yield (%) |
Sharpe 1y (NAV) |
Sharpe 3y (NAV) |
Henderson Alternative Strategies |
90.3 |
(2.7) |
(8.2) |
(21.2) |
0.9 |
No |
(19.7) |
100.0 |
1.6 |
(1.2) |
(0.6) |
BACIT |
492.4 |
3.9 |
17.0 |
-- |
1.3 |
No |
5.8 |
100.0 |
1.6 |
(0.5) |
0.3 |
BlackRock Income Strategies |
328.3 |
(8.6) |
3.3 |
19.1 |
0.7 |
No |
(7.7) |
102.0 |
5.5 |
(1.5) |
(0.1) |
Capital Gearing |
104.3 |
11.2 |
14.7 |
40.6 |
1.0 |
No |
2.2 |
100.0 |
0.6 |
0.0 |
0.2 |
Invesco Perp Select Balanced |
8.3 |
(6.6) |
2.8 |
-- |
1.2 |
No |
(1.0) |
100.0 |
0.0 |
(1.6) |
(0.2) |
Miton Global Opportunities |
39.4 |
(3.4) |
11.9 |
14.7 |
1.2 |
Yes |
(10.0) |
96.0 |
0.0 |
(1.7) |
0.1 |
New Star Investment Trust |
49.7 |
(0.5) |
4.7 |
7.2 |
0.9 |
Yes |
(37.5) |
100.0 |
0.4 |
(1.0) |
(0.1) |
Personal Assets |
612.6 |
4.6 |
7.3 |
30.0 |
0.9 |
No |
(0.9) |
100.0 |
1.6 |
(0.8) |
(0.1) |
RIT Capital Partners |
2,412.6 |
4.3 |
25.9 |
36.4 |
1.2 |
Yes |
0.8 |
112.0 |
1.9 |
(0.5) |
0.6 |
Ruffer Investment Company |
310.5 |
(6.1) |
1.3 |
11.4 |
1.1 |
No |
(0.7) |
100.0 |
1.7 |
(1.7) |
(0.2) |
Sector weighted average |
2.5 |
17.6 |
26.8 |
1.1 |
(0.5) |
106.6 |
2.0 |
(0.7) |
0.3 |
||
HAST rank in sector |
7 |
6 |
10 |
8 |
7 |
9 |
3 |
5 |
6 |
10 |
Source: Morningstar, Edison Investment Research. Note: TR = NAV total return. Sharpe ratio is a measure of risk-adjusted return. The ratios shown are calculated by Morningstar for the past 12- and 36-month periods by dividing a fund’s annualised excess returns over the risk-free rate by its annualised standard deviation. Net gearing is total assets less cash and equivalents as a percentage of net assets (100 = ungeared).
The board
HAST has four directors, all non-executive and independent of the manager. Richard Gubbins joined the board in July 2014 and was appointed chairman in November of the same year. Graham Fuller, the senior independent director and the only board member remaining from before the trust’s management moved to Henderson, was appointed in 2007. Jamie Korner became a director in May 2013 and Graham Oldroyd joined the board in July 2014. The directors have backgrounds in corporate law, investment management and private equity.
|