Last close As at 07/08/2026
GBP1.76
— 0.00 (0.00%)
Market capitalisation
—
Research: Investment Companies
Henderson International Income Trust (HINT) seeks to provide investors with more diversified sources of income, by investing exclusively outside the UK. Managed by Ben Lofthouse, the trust received a significant boost to its assets in 2016 when it was selected as a rollover vehicle for Henderson Global Trust (HGL). Demand has remained strong, and HINT has recently raised a further £21.5m through a ‘C’ share issue, with the new shares listed on 8 May. The manager focuses on well-managed companies with strong competitive positions and sustainable dividends in order to secure income and long-term capital growth. Absolute performance has been favourable, with annualised NAV and share price total returns of 10%+ since launch in 2011.
Written by
Henderson International Income Trust |
Growing income from all-overseas portfolio |
Investment trusts |
10 May 2017 |
Share price/discount performance
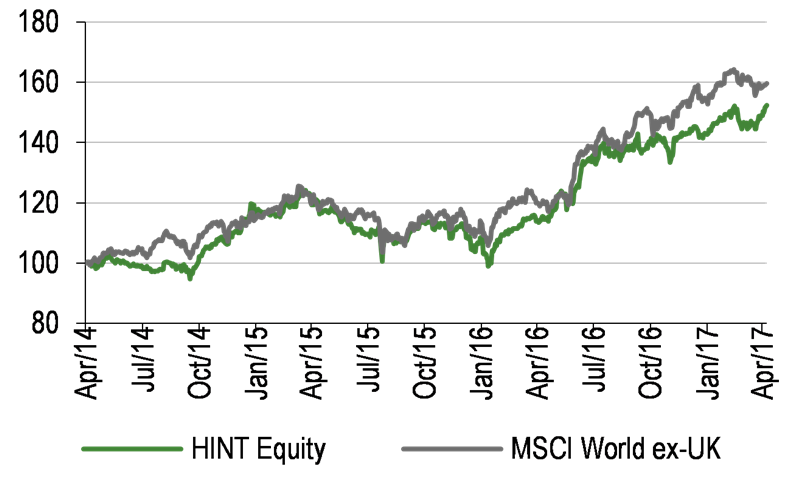
Three-year performance vs index
Gearing
Analyst
|
|||||||||||||||||||||||||||||||||||||||||||||||||||||||||||||||||||||||||||||||||||||
Henderson International Income Trust (HINT) seeks to provide investors with more diversified sources of income, by investing exclusively outside the UK. Managed by Ben Lofthouse, the trust received a significant boost to its assets in 2016 when it was selected as a rollover vehicle for Henderson Global Trust (HGL). Demand has remained strong, and HINT has recently raised a further £21.5m through a ‘C’ share issue, with the new shares listed on 8 May. The manager focuses on well-managed companies with strong competitive positions and sustainable dividends in order to secure income and long-term capital growth. Absolute performance has been favourable, with annualised NAV and share price total returns of 10%+ since launch in 2011.
12 months ending |
Share price |
NAV |
MSCI World ex-UK (%) |
FTSE All-Share (%) |
MSCI World |
30/04/13 |
24.3 |
27.4 |
21.1 |
17.8 |
22.5 |
30/04/14 |
0.9 |
5.0 |
5.7 |
10.5 |
8.1 |
30/04/15 |
20.0 |
15.3 |
19.8 |
7.5 |
18.7 |
30/04/16 |
(5.1) |
1.8 |
0.1 |
(5.7) |
1.1 |
30/04/17 |
30.9 |
25.9 |
31.8 |
20.1 |
30.6 |
Source: Thomson Datastream. Note: all % on a total return basis in GBP.
Investment strategy: Sustainable income and growth
HINT’s manager, Ben Lofthouse (with input from Henderson’s global equity income team), seeks to hold a portfolio of c 65 stocks with dividend yields above 2% and strong cash flow generation to support sustainable dividend growth. The trust invests outside the UK across three regions – the Americas; Europe, the Middle East and Africa; and Asia–Pacific (including Australasia). Lofthouse favours companies with strong management teams, good competitive positions and undemanding valuations, and aims to achieve a high and growing income as well as long-term capital growth potential.
Market outlook: Uncertainty for UK as election looms
Stock market returns have remained favourable into the second quarter of 2017, with returns from overseas investments boosted for UK investors by the weakness of sterling. With a general election adding a layer of uncertainty to Brexit negotiations, the near term could prove volatile for both the UK stock market and the currency. Meanwhile, superior economic growth prospects outside the UK suggest that investors may be rewarded by looking beyond the domestic market.
Valuation: Demand drives a small premium to NAV
At 8 May, HINT’s shares traded at a 0.9% premium to cum-income net asset value. This compares favourably with average discounts for the past one and three years of 0.8% and 1.3% respectively, and a 0.2% average premium over five years. HINT has tended to trade close to NAV, with continued demand leading to the issue on 8 May of 21.5m ‘C’ shares. The 3.1% dividend yield remains competitive with peers.
Exhibit 1: Trust at a glance
Investment objective and fund background |
Recent developments |
||||||||||||||||||||||||||||||||||||||||||||||||||||||||||||||||||||||
HINT aims to provide a high and rising level of dividends, as well as capital appreciation over the long term, from a focused and internationally diversified portfolio of securities (predominantly equities and fixed income) outside the UK. It is benchmarked against the MSCI World ex-UK index. |
■ 5 May 2017: Shareholders approve amendments to investment policy and issue of 21.5m ‘C’ shares. ■ 4 April 2017: half-year results for the six months ending on 28 February. NAV TR +9.1% and share price TR +8.3% versus +14.0% for benchmark. ■ 31 January 2017: first quarterly dividend of 1.2p declared for the year ending 31 August 2017, a 4.3% increase on Q116. |
||||||||||||||||||||||||||||||||||||||||||||||||||||||||||||||||||||||
Forthcoming |
Capital structure |
Fund details |
|||||||||||||||||||||||||||||||||||||||||||||||||||||||||||||||||||||
AGM |
December 2017 |
Ongoing charges |
1.01% |
Group |
Henderson Global Investors |
||||||||||||||||||||||||||||||||||||||||||||||||||||||||||||||||||
Annual results |
November 2017 |
Net gearing |
1.0% |
Manager |
Ben Lofthouse |
||||||||||||||||||||||||||||||||||||||||||||||||||||||||||||||||||
Year end |
31 August |
Annual mgmt fee |
0.65%-0.60% (see page 7) |
Address |
201 Bishopsgate, |
||||||||||||||||||||||||||||||||||||||||||||||||||||||||||||||||||
Dividend paid |
Feb, May, Aug, Nov |
Performance fee |
None |
||||||||||||||||||||||||||||||||||||||||||||||||||||||||||||||||||||
Launch date |
28 April 2011 |
Trust life |
Indefinite |
Phone |
+44 (0) 20 7818 1818 |
||||||||||||||||||||||||||||||||||||||||||||||||||||||||||||||||||
Continuation vote |
Three-yearly, next 2017 |
Loan facilities |
£50m overdraft facility |
Website |
|||||||||||||||||||||||||||||||||||||||||||||||||||||||||||||||||||
Dividend policy and history (financial years) |
Share buyback policy and history (financial years) |
||||||||||||||||||||||||||||||||||||||||||||||||||||||||||||||||||||||
Dividends paid quarterly in February, May, August and November. *Note: six dividends were paid in respect of the period from launch in April 2011 to the first full year-end at 31 August 2012. The annualised dividend for this period was 4.05p. |
HINT has the authority to buy back up to 14.99% of shares and will issue shares to manage a premium. FY14 issuance includes conversion of C shares issued in November 2013 and the exercise of subscription shares issued at launch, and FY16 issuance includes the rollover of investments in HGL. |
||||||||||||||||||||||||||||||||||||||||||||||||||||||||||||||||||||||
|
|
||||||||||||||||||||||||||||||||||||||||||||||||||||||||||||||||||||||
Shareholder base (as at 30 April 2017) |
Portfolio exposure by geography (as at 31 March 2017) |
||||||||||||||||||||||||||||||||||||||||||||||||||||||||||||||||||||||
|
|
||||||||||||||||||||||||||||||||||||||||||||||||||||||||||||||||||||||
Top 10 holdings (as at 31 March 2017) |
|||||||||||||||||||||||||||||||||||||||||||||||||||||||||||||||||||||||
|
|||||||||||||||||||||||||||||||||||||||||||||||||||||||||||||||||||||||
Source: HINT, Edison Investment Research, Bloomberg, Morningstar. Note: *N/A where not in March 2016 top 10.
Market outlook: UK lags as weaker sterling persists
While the main UK equity indices started 2017 strongly, reaching multiple all-time highs, the impact of the UK’s vote to leave the European Union has been seen most noticeably in overseas equities, where returns for UK investors have been boosted by the weakness of sterling (Exhibit 2, left-hand chart). The forthcoming general election adds a further layer of uncertainty to the already far-from-clear path of Brexit negotiations over the next two years. A stronger hand for the current Conservative government could bolster the value of the pound, but the united front being presented by the remaining 27 EU member states suggests a favourable trade deal will not come without cost. Meanwhile, latest (April 2017) figures from the International Monetary Fund (right-hand chart) show UK economic growth set to continue to lag the rest of the world, in spite of a significant upgrade to the 2017 forecast (2.0% versus 1.5% in January). Given the uncertain picture at home and the superior economic growth prospects abroad, investors in search of income or growth may wish to consider an element of international diversification.
|
Exhibit 2: Market performance and valuation |
|
10-year performance of UK, world and world ex-UK equities |
Historical and forecast GDP growth (compound annual rate) |
|
|
|
Source: Thomson Datastream, IMF World Economic Outlook, Edison Investment Research |
|
Fund profile: Income and growth from ex-UK portfolio
HINT is a global equity income investment trust that is unique among its peers for investing exclusively outside the UK. It began life in 2011 as a follow-on vehicle for a closed-ended property fund run by Henderson Global Investors. With private investors increasingly turning to equity investment as a source of income, the rationale for the strategy was that many may already be sufficiently exposed to the UK, and could potentially benefit from diversifying their sources of income. The trust seeks to provide a high and rising level of dividend income in addition to long-term capital appreciation. It informally targets a dividend yield close to that of the UK market, and currently yields 3.1% compared with 3.5% for the FTSE All-Share.
The trust has been managed since launch by Ben Lofthouse, who takes a bottom-up, value-biased approach to selecting a focused but geographically diversified portfolio of c 65 stocks. In 2016, HINT was chosen as one of the rollover vehicles for HGL, and as a result has roughly doubled its assets to c £240m. Demand for the strategy has remained strong, and in May 2017 the trust raised £21.5m in a ‘C’ share issue.
The fund manager: Ben Lofthouse
The manager’s view: Prioritising growth and stability
Manager Ben Lofthouse is cautiously optimistic on the outlook for the global economy, noting that after several years of fiscal drag following the financial crisis, government spending around the world is beginning to grow. Added to increases in private consumption and credit supply, he argues this is supportive for equity markets. However, a slow grind upwards in recent years means markets are no longer cheap: since HINT was launched, the 12-month forward P/E valuation of the MSCI World index has risen from c 11.5x to 16.6x. Lofthouse says that he has reduced HINT’s gearing as a result of this, with some of the trust’s holdings having rerated quite sharply over the past 18 months. This is particularly true among defensive growth stocks in the US, where weightings have been reduced.
As the ‘low hanging fruit’ of cheap stocks with good growth prospects has now largely been picked, Lofthouse has a threefold focus in the current environment. He is prioritising growth and stability and reducing dividend risks, maintaining a value bias in order to maximise total return, and trying not to overpay for yield. He argues that focusing on free cash flow rather than simply cheap, high-yielding stocks has proved supportive to medium-term performance, and the portfolio is currently heavily biased towards stocks with good dividend growth prospects rather than those on high starting yields. There is a balance between defensive stocks on acceptable valuations, and cheaper areas that “do not require a leap of faith that things will get better”, says Lofthouse.
While US exposure has fallen as a result of profit-taking, the manager argues that the implications of President Trump’s new corporate tax proposals could be significant for holdings such as Microsoft, which has a large amount of overseas cash that could potentially be brought back into the US. He says that the company’s valuation had been discounted by the market because it was assumed that the cash would never be repatriated, and therefore a rerating is possible.
Asset allocation
Investment process: Bottom-up with focus on cash generation
As part of the recent fundraising, HINT has proposed some small changes to its investment policy, reflecting the planned increase in the size of the portfolio in addition to the near-doubling of assets following the HGL rollover. Under the new objective, HINT will invest in a portfolio of 50-80 (formerly 40-60) companies that are either listed in, registered in, or whose principal business is in countries that are outside the UK; fixed income investments (permitted since launch but rarely held) will be limited to 25% of gross assets.
The investment process will remain unchanged. Manager Ben Lofthouse screens the investment universe (broadly encompassing the c 1,500 constituents of the MSCI World ex-UK index) for stocks with dividend yields above 2%, attractive free cash flow yields and strong free cash flow growth. Lofthouse is part of Henderson Global Investors’ well-resourced global equity income team, recently enlarged with the recruitment of two new analysts to expand coverage of the technology, industrials, oil & gas and financials sectors. The team looks for companies with strong competitive positions, sustainable profits, dividends and cash flow, and where the interests of management are aligned with shareholders. They seek to identify stocks that are out of favour with investors, as capital growth potential may be higher in companies whose earnings are under-appreciated by the market.
Lofthouse builds a portfolio that is diversified by geography as well as sector. Regional exposures are allocated between North and South America; Europe (ex-UK), the Middle East and Africa; and Asia–Pacific (including Australasia). A maximum of 50% of the portfolio may be held in a single region; historically, the regional weighting has been broadly one-third (by number of stocks, not by value) in each area. Each stock is assigned a valuation target, and Lofthouse may sell holdings when they reach this target, or if fundamental change has negatively affected the outlook. Holdings will be reviewed if dividend yields drop below 2%, although this would not trigger an automatic exit.
Gearing may be deployed in reaction to available opportunities. The manager makes limited use of option-writing to enhance income, and may also hedge currency exposure.
Current portfolio positioning
At 31 March 2017, HINT had 63 companies in its portfolio, compared with 59 at the same time last year. This was broadly in line with the average for the global equity income peer group. The top 10 holdings made up 27.7% of the total, a slight increase in concentration from 25.7% at 31 March 2016.
From a geographical perspective (Exhibit 3), the US was the largest country weighting (down 3.2pp over 12 months to 34.1%, following the sale of stocks including Six Flags Entertainment and Johnson & Johnson), but this is also the largest underweight position versus the MSCI World ex-UK index, where the US is heavily dominant. Europe was the largest regional weighting (39.9% at the 28 February half-year end), although within this there were reductions to weightings in France (exits from drug company Sanofi-Aventis and building materials stock Saint-Gobain) and Switzerland (sales of staffing firm Adecco, Zurich Insurance and Cembra Money Bank), and new positions in Norway (Statoil), Italy (electric/gas utility company Enel) and Sweden (Nordea Bank).
Exhibit 3: Portfolio geographic exposure vs MSCI World ex-UK (% unless stated)
Portfolio end-March 2017 |
Portfolio end- March 2016 |
Change |
Index |
Active weight vs index (pp) |
|
US |
34.1 |
37.3 |
(3.2) |
64.0 |
(29.9) |
France |
11.0 |
14.4 |
(3.4) |
4.0 |
7.0 |
Germany |
8.4 |
7.3 |
1.1 |
3.7 |
4.7 |
Switzerland |
6.4 |
12.9 |
(6.5) |
N/S |
N/A |
China |
6.6 |
4.1 |
2.5 |
0.0 |
6.6 |
Australia |
5.5 |
5.3 |
0.2 |
N/S |
N/A |
Netherlands |
5.3 |
2.3 |
3.0 |
N/S |
N/A |
Korea |
3.3 |
4.1 |
(0.8) |
0.0 |
3.3 |
Norway |
3.5 |
0.0 |
3.5 |
N/S |
N/A |
Taiwan |
2.8 |
0.0 |
2.8 |
0.0 |
2.8 |
Hong Kong |
0.0 |
2.5 |
(2.5) |
N/S |
N/A |
Other |
13.1 |
9.8 |
3.3 |
N/A |
N/A |
100.0 |
100.0 |
100.0 |
Source: HINT, Edison Investment Research. N/S=not stated by index provider.
While financials remains the largest sector weighting, the biggest increase in exposure has been to consumer goods, with new holdings in Samsung, Coca-Cola European Partners, General Motors, Toyota, Chinese sportswear brand Anta Sports, electric bus company Zhengzhou Yutong and US clothing company Hanesbrands added since the FY16 year end. The biggest reduction over the past 12 months was in industrials, with logistics firm UPS and Hong Kong conglomerate CK Hutchison sold in addition to the exits from Saint-Gobain and Adecco.
Exhibit 4: Portfolio sector exposure (% unless stated)
Portfolio end-March 2017 |
Portfolio end-March 2016 |
Change (pp) |
|
Financials |
27.7 |
30.8 |
(3.1) |
Telecommunications |
14.6 |
16.2 |
(1.6) |
Consumer goods |
11.8 |
1.5 |
10.3 |
Technology |
11.1 |
8.8 |
2.3 |
Healthcare |
8.3 |
12.0 |
(3.7) |
Industrials |
8.0 |
14.7 |
(6.6) |
Consumer services |
8.0 |
9.1 |
(1.1) |
Oil & gas |
6.9 |
4.4 |
2.5 |
Basic materials |
2.1 |
1.8 |
0.3 |
Utilities |
1.4 |
0.7 |
0.7 |
100.0 |
100.0 |
Source: HINT, Edison Investment Research
Performance: Strong absolute return record
|
Exhibit 5: Investment trust performance to 30 April 2017 |
|
Price, NAV and benchmark total return performance, one-year rebased |
Price, NAV and benchmark total return performance (%) |
|
|
|
Source: Thomson Datastream, Edison Investment Research. Note: Three- and five-year and since inception (28 April 2011) figures annualised. |
|
HINT’s absolute returns have been strong over 12 months to 30 April (Exhibit 5, left-hand chart), with NAV total returns of c 25% and share price total returns of c 30%, partly as a result of the weaker sterling since the UK’s EU referendum in June 2016. Annualised returns over three and five years and since launch are in the range of c 10-15%. The trust has at times tended to underperform both its benchmark index, the MSCI World ex-UK (Exhibit 7), and the MSCI World index (Exhibit 6); both these indices are heavily weighted (55-65%) towards the US, which has performed strongly since the global financial crisis. Conversely, performance versus the domestic FTSE All-Share index has been strong over most periods. In the six months to 28 February (H117), the US was again the strongest market. Notable contributors to HINT’s returns were financial stocks, including Blackstone, Ares Capital, J.P. Morgan, Natixis and ING Groep, while holdings in the more defensive areas of real estate and telecoms detracted as investors focused more on cyclical sectors.
|
Exhibit 6: Share price and NAV total return performance, relative to indices (%) |
||||||||
|
One month |
Three months |
Six months |
One year |
Three years |
Five years |
SI* |
|
Price relative to MSCI World ex-UK |
3.4 |
1.4 |
0.5 |
(0.7) |
(5.7) |
(7.6) |
(7.1) |
|
NAV relative to MSCI World ex-UK |
1.1 |
0.7 |
(0.9) |
(4.5) |
(6.5) |
(2.3) |
(2.7) |
|
Price relative to FTSE All-Share |
1.9 |
0.4 |
(0.7) |
8.9 |
22.4 |
17.8 |
17.7 |
|
NAV relative to FTSE All-Share |
(0.4) |
(0.3) |
(2.1) |
4.8 |
21.3 |
24.6 |
23.3 |
|
Price relative to MSCI World |
3.5 |
1.7 |
0.1 |
0.2 |
(4.9) |
(9.9) |
(10.5) |
|
NAV relative to MSCI World |
1.1 |
1.0 |
(1.2) |
(3.6) |
(5.7) |
(4.7) |
(6.3) |
|
|
Source: Thomson Datastream, Edison Investment Research. Note: Data to end-April 2017. Geometric calculation. *SI = since inception (28 April 2011). |
||||||||
|
Exhibit 7: NAV total return performance relative to MSCI World ex-UK index over five years |
||||||||
|
||||||||
|
Source: Thomson Datastream, Edison Investment Research |
||||||||
Capital structure and fees
HINT is a conventional investment trust, currently with two classes of share, following the issue of 21.5m ‘C’ shares (listed as HINC) on 8 May 2017. At 8 May there were 156.6m ordinary shares in issue. This is almost double the figure for the previous year, after 75m shares were issued to HGL shareholders who chose HINT as a rollover option in April 2016, and a further 1.1m were issued in response to demand.
Gearing is permitted up to 25% of net assets. HINT has a £50m multicurrency overdraft facility with HSBC (increased from £25m during FY16), which equates to total available gearing of 20.8% based on 8 May net assets. Actual net gearing stood at 1.0% at 30 April 2017.
Following the rollover of HGL in April 2016, HINT reduced the management fee it pays to Henderson from 0.75% to 0.65% of NAV, falling to 0.60% of net assets in excess of £250m. This, combined with a larger pool of assets across which to spread fixed costs, caused ongoing charges to fall to 1.01% for FY16 (FY15: 1.10%). The figure for FY17 is expected to be lower still.
Dividend policy and record
HINT pays four interim dividends a year, in February, May, August and November. Annual dividends have risen each year since launch in 2011 (using annualised figures in respect of the first full reporting period of 16 months), with a compound annual growth rate of 3.8%. For FY16, total dividends of 4.65p per share were paid, which were fully covered by income. So far in FY17, two interim dividends of 1.2p have been declared. Historically, HINT has tended to pay the first three interim dividends at the same level as the preceding year’s fourth interim dividend, rising at the fourth interim stage. On this basis it would be reasonable to expect total dividends for FY17 of at least 4.8p. Lofthouse comments that the relatively modest 3.3% increase in the dividend for FY16 was accompanied by a large transfer to HINT’s revenue reserve, which increased by 81.5% compared with FY15, and at the year-end was sufficient to cover 60% of the annual dividend. Based on the last four dividends and the 8 May share price, HINT currently yields 3.1%.
Peer group comparison
There are eight investment companies in the AIC’s Global Equity Income sector, but HINT is unique in the group for having a wholly ex-UK focus. NAV total returns over one year are somewhat below the weighted average (which is skewed by strong recent performance from the largest fund, Murray International), but over three and five years HINT ranks fourth and third respectively in the peer group, with above-average returns. The premium to NAV is broadly in line with the sector average, while the dividend yield is towards the lower end of the range, arguably as a result of having no exposure to the higher-yielding UK market. Ongoing charges are a little above average, but HINT does not charge a performance fee. HINT is among the lowest-geared trusts in the peer group.
Exhibit 9: Global Equity Income peer group as at 8 May 2017
% unless stated |
Market cap £m |
NAV TR |
NAV TR |
NAV TR |
Ongoing charge |
Performance |
Discount (ex-par) |
Net |
Dividend yield (%) |
Henderson International Income |
242.3 |
26.1 |
48.1 |
99.5 |
1.0 |
No |
1.5 |
102 |
3.1 |
Blue Planet Investment Trust |
24.7 |
28.8 |
14.9 |
-- |
3.9 |
No |
(5.8) |
133 |
6.0 |
F&C Managed Portfolio Income |
59.0 |
21.9 |
28.4 |
71.4 |
1.1 |
Yes |
5.9 |
100 |
3.8 |
Invesco Perp Select Glo Eq Inc |
63.4 |
30.5 |
49.7 |
109.6 |
1.0 |
Yes |
(2.6) |
111 |
3.3 |
JPMorgan Global Growth & Income |
370.4 |
43.3 |
61.8 |
112.9 |
0.6 |
Yes |
(2.5) |
105 |
2.2 |
Murray International |
1,559.5 |
35.0 |
36.4 |
62.1 |
0.7 |
No |
4.3 |
112 |
4.0 |
Scottish American |
455.8 |
31.6 |
52.6 |
82.0 |
0.9 |
No |
0.3 |
116 |
3.2 |
Securities Trust of Scotland |
187.4 |
27.2 |
38.3 |
82.4 |
1.0 |
No |
(5.2) |
111 |
3.5 |
Sector weighted average |
33.9 |
43.1 |
77.2 |
0.8 |
1.8 |
111 |
3.5 |
||
HINT rank in sector |
4 |
7 |
4 |
3 |
3 |
3 |
6 |
7 |
Source: Morningstar, Edison Investment Research. Note: TR = total return. Net gearing is total assets less cash and equivalents as a percentage of net assets (100 = ungeared).
The board
HINT has five non-executive directors. Chairman Christopher Jonas was a director of predecessor company Henderson Global Property Companies, and has been on the HINT board since its launch in 2011. Bill Eason and Simon Jeffreys were also appointed to the HINT board at launch. Richard Hills and Aidan Lisser became directors of HINT following the rollover of HGL in April 2016. Peregrine Banbury retired from the board at the 2016 AGM. The directors’ professional backgrounds are in property, investment management, accountancy, business and marketing.
|
|
Investment Companies
Research: Investment Companies
mutares AG specialises in the acquisition and restructuring of unlisted companies in Europe and currently holds 13 investments. Shareholder value is created over time as profitable exits boost NAV and enable the company to pay special dividends. A successful realisation has already been achieved at the start of the year and the company intends to complete a further one or two exits this year. mutares’s shares have delivered a compound annual total return of 34% since listing in 2008. Trading at a 30% discount to NAV, investors may find the stock an attractive opportunity.