Treatt provides high-quality innovative ingredient solutions to the flavours and fragrance industries, and directly to global fast-moving consumer goods (FMCG) manufacturers. The beverages space has proved to be a growth segment for the company recently, in particular sugar reduction, and citrus and ready-to-drink tea flavours. Treatt’s in-depth knowledge of the commodities markets in which it operates (non exchange-traded) and its long-term relationships with suppliers provide the group with an important competitive advantage. Treatt has more than 125 years of knowledge of sourcing and trading raw materials, which acts as a barrier to entry for potential new entrants.
Valuation: Attractive play
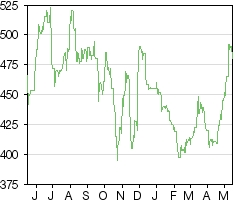
The share price has risen 14% in absolute terms and 4% in relative (FTSE All-Share) terms over the last 12 months, following a very strong FY17. That said, it still trades at a discount to its larger peers based on benchmark valuation metrics. We value Treatt on a DCF basis and derive a fair value of 540p, or c 13% upside. We have rolled forward our DCF to start in FY19 as we are more than half way through FY18. Our DCF is predicated on a WACC of 7.3% (encompassing beta of 0.8, equity risk premium of 5.0% and borrowing spread of 5.0%) and a terminal growth rate of 2%.
Treatt trades at a discount to its larger ingredients peers on both P/E and EV/EBITDA. Treatt trades at 22.4x and 15.5x CY19 P/E and EV/EBITDA, representing 9% and 3% discounts to the peer group respectively. The sector is undergoing consolidation, and we note IFF’s recent acquisition of Frutarom for 20.3x FY18E EV/EBITDA, and Givaudan’s acquisition of Naturex for 20.0x FY17 EV/EBITDA. Given the momentum in the Treatt business and hence the potential for upgrades to our forecasts, we believe the share price offers a good entry point.
Financials: Another strong performance
The company enjoyed a very strong year in FY17 with revenue growth of 25%, profit before tax was up 46% on an adjusted basis, and adjusted diluted EPS was up 42%. This very strong growth rate is unlikely to be repeated, and although growth has slowed in H118 as expected, there is growth coming through from the strong base. Revenues in H1 were up 14%, adjusted profit before tax was up 20%, and adjusted diluted EPS was up 24%. Q3 has also started well, according to the company. The group is well-funded, having completed an equity fund-raising through a placing in November, and having sold its Earthoil Plantations business for £11m.
Looking into the medium term, we forecast 5.3% revenue CAGR and 6.0% pre-exceptional PBT CAGR, translating to 6.2% pre-exceptional earnings CAGR for 2017-20. Management’s proven track record in meeting or beating consensus expectations, in combination with the positive outlook for the natural ingredients industry, gives us confidence that our forecasts will be met. In addition, we note that management has been successful in controlling costs through internal self-help measures, and we expect this trend to continue.
Despite 60% of turnover being exposed to the ‘defensive’ beverage sector, Treatt has a couple of key sensitivities, which it seeks to mitigate through the in-depth knowledge and skills base of its buying team and undertaking an active hedging policy where possible:
■
Commodity exposure: namely citrus oils, which make up c 50% of revenues.
■
Foreign exchange: translation risk on US dollar profits, which it manages through hedging, and transactional exposure as some raw materials are dollar-denominated.
Treatt has more than 125 years’ experience as a supplier of innovative ingredient solutions to the flavour, fragrance and consumer goods industries. Its historic strength has been in ingredient sourcing and risk management, but it has invested in manufacturing its own higher value-added, higher-margin products. These now account for c 65% of sales and over three-quarters of group profits. Treatt’s main customers operate in the flavours and fragrance industries: its products are used by flavours and fragrances manufacturers and blended together to create highly value-added ingredients, which are in turn sold to FMCG companies. Treatt also sells directly to FMCG companies for use in their products, and sugar reduction and ready-to-drink (RTD) tea have proved to be growth segments for the company over recent years.
Treatt’s customer base is broad-reaching in terms of size and geographic spread. While significant effort and management time went into focusing the business on its more important customers, the breadth of its customer base means the group is not overly dependent on any one relationship, with its largest customer representing c 10% sales, and the top 10 customers representing c 35% sales. Approximately 80% of Treatt’s product portfolio is flavour ingredients, and these are mostly used in the beverages space. The remaining 20% of the portfolio encompasses fragrance ingredients. Typical end-products that use Treatt ingredients range from soft drinks, alcoholic beverages (mainly craft beers) and confectionery, to soaps, shampoos and basic pharmaceutical products. Treatt has manufacturing sites in the UK and US and Kenya, in which its two 100%-owned subsidiaries, RC Treatt and Treatt USA, are principally based. In addition to its manufacturing centres, Treatt has sales offices in China and France and a network of agents throughout the world, through which it exports to more than 90 countries worldwide.
Exhibits 1 and 2 show a breakdown of revenue by geographic market and by customer sector.
Exhibit 1: Revenue by geography (FY17)
|
Exhibit 2: Revenue by customer sector (FY17)
|

|

|
|
|
|
Exhibit 1: Revenue by geography (FY17)
|
|
|
|
Exhibit 2: Revenue by customer sector (FY17)
|
|
|
|
In Exhibit 3 we illustrate Treatt’s product suite. Treatt used to be run along discrete product lines, but when CEO Daemmon Reeve took over in 2012 one of his key strategic priorities was to break down the ‘silo’ mentality that existed among the three operating units. Treatt now has three key areas of focus: citrus, tea and sugar reduction. The product suite supports these: beverages remain Treatt’s main area of expertise as liquid flavourings are most often used in beverages, and the company now derives c 60% of its revenues from the beverage industry (including ingredients that are sold on to the beverages industry via flavour houses). Citrus is a historic segment of strength for the group and remains the largest; sugar reduction is growing very quickly given current consumer trends; RTD tea has also witnessed strong growth and is a popular area for new product launches given its health credentials, which resonate with the consumer. The high-impact flavours business remains a good-sized contributor, albeit generally at a somewhat lower margin.
Exhibit 3: Treatt product suite
|

|
Source: Edison Investment Research, Company data
|
The food and beverage industry has evolved and the current trend is for natural, clean-label, calorie-free and sustainable products. Consumers demand these product features, causing the market for natural and naturally derived products to accelerate in growth, and creating significant profit potential for both food and beverage manufacturers and ingredients suppliers. The products are highly desirable but also require a significant degree of complexity and know-how to formulate and utilise, thus giving rise to higher margins.
Consumers perceive natural ingredients as having a positive impact on general health, while synthetic ingredients are viewed with suspicion. As a result, food and beverage manufacturers have promptly responded to the situation by completely or partially replacing synthetic ingredients with their natural or clean-label counterparts. Clean eating has itself become a consumer trend, with consumers shying away from certain food groups and avoiding products that are viewed as being overly processed. The larger food manufacturers have sought to embrace this trend by both reformulating products with cleaner labels, and buying out smaller, niche brands with more organic/natural credentials.
A common problem in the wellness space is that the better-for-you variants often have a compromised taste. To keep taste as close as possible to the regular product, complex formulations take centre stage and may require an ongoing iterative process to optimise the taste. For example, stevia is an increasingly popular 100% natural sweetener; however, it is also renowned for a signature bitter liquorice aftertaste. Treattaromes are Treatt’s trademark From the Named Food (FTNF) portfolio of clear aqueous distillates that naturally offset the aftertaste. They provide a natural sweet top-note flavour and are an exciting potential way for Treatt to participate in this fast-growing sector of the beverage market.
We believe Treatt is in an excellent position to benefit from the constant need for FMCG manufacturers to produce a stream of new product formulations to keep consumers engaged, particularly given its focus on deep customer knowledge and relationships, thus enabling it to work closely with its clients. It is also well placed to capitalise on the natural and clean-label trends given its expertise in FTNF solutions.
The group updated its strategy in September 2017 as the previous strategy had been delivered three years ahead of schedule. The new strategy is entitled Strategy 1.2 – the pathway to 2022 and, as the name suggests, it builds on the previous strategy. The focus remains the delivery of long-term and consistent growth in profitability by focusing on customers and products which can bring Treatt long-term value. The strategy focuses on three main priorities:
■
the product categories of citrus, tea and sugar reduction;
■
the importance of its people and culture; and
■
the physical relocation and expansion plans (in the UK and US respectively).
As discussed above, Treatt has more than 125 years’ experience as a supplier of innovative ingredient solutions to the flavour, fragrance and consumer goods industries. More recently it has been focusing its business to better serve its customers and to concentrate on the higher-growth and higher-margin categories.
Treatt has a long history of expertise in the citrus space, and it has been a core part of its business for many decades. The new strategy supports the formation of a dedicated, cross-functional citrus team to further develop this category. The taste for citrus flavours remains a favourite in the beverage industry and is also being used to encourage consumers to try new and exotic flavours, as they are paired with the more traditional orange, lemon or lime flavours. The citrus category is helping to revitalise the appeal of brands as the natural flavour can be touted, together with the provenance. Citrus also has the advantage of working well in most beverage categories, from juices and flavoured waters to sparkling drinks and teas. Treatt’s Global Citrus Strategy focuses its efforts to ensure the team is best placed to lead the market.
Tea is the second most widely consumed beverage worldwide, after water. It is popular in different forms depending on geography, with RTD iced tea and cold brew blends growing market share in North America, while exotic Chinese and Japanese varieties such as Matcha are gaining significant momentum across Europe. Tea has a broad appeal and embraces the current consumer trends of low-sugar, natural products that have additional health benefits. Tea can be niche, premium or every day, hence giving Treatt a wide spectrum in which to operate.
The iced tea market continues to grow and innovate. While the growth of iced tea consumption in North America has slowed slightly, the market is still growing. Treatt’s expertise centres around authenticity of flavour, and it can provide solutions from a black tea flavour for an RTD tea beverage to a delicate top note in a blended beverage.
As discussed above, reducing sugar levels without compromising on flavour or cost continues to be a significant concern for beverage brands globally. The industry as a whole is reformulating its product ranges as sugar reduction concerns come to the fore and drive new product development across all subcategories. Sugar reduction is also technically complicated, which is where Treatt’s expertise comes in. Sugar provides flavour, sweetness and mouth feel. Treatt operates principally in the niche of flavour, which is difficult to replicate. Treatt has a growing reputation here and is recognised for bringing the important technical sugar authenticity to the flavour profile of a beverage.
Treatt also continues to provide a wider product suite than just in its three categories of focus. High-impact synthetic aroma chemicals continued to grow strongly in FY17, and organic essential oils and vegetable oils contribute to providing a rounded product offering.
People and corporate culture
Since he took over in 2012, the CEO, Daemmon Reeve, has driven through significant cultural change, and more specifically a culture of empowerment to champion a can-do attitude. Treatt recognises that a happy, well-motivated and experienced workforce will be more successful. The drive for cultural change started as soon as the current CEO took the helm in 2012, and the business now operates on an increasingly global platform. Internal structures are continually improved to ensure collaboration and knowledge-sharing across the business.
It is no accident that corporate culture features again so prominently in the updated group strategy, and the aim is to continuously enhance the engagement of the workforce, from career development to support of its staff. The culture aims to attract and retain the brightest minds, generate energy and enthusiasm from the teams, and to foster an environment which cares for and values diversity. Engagement with local communities has resulted in Treatt being more widely recognised as a desirable employer. By fostering a culture of innovation, the company is seeing cross-departmental teams coming together and identifying new opportunities to drive the business.
The relocation and expansion in the UK and US respectively should provide the platform for the new strategy to develop.
Treatt has outgrown its current UK manufacturing facilities in Bury St Edmunds and explored its options for some time. In May 2015 the company announced its intention to fully relocate the UK business to another site near the existing one, and in November 2017 it announced an equity fundraising through a placing to help meet the costs of the expansion project.
Once completed, the new facility will be purpose-built, with upgraded machinery and the latest technology. The project is obviously complex, but the overall cash outflow over two to three years is forecast to be £35m, including spend of £3-5m on some capital projects that have been held back in view of the relocation (in effect delayed capex, and indeed FY16 capex was particularly low at £0.7m as management sensibly reduced capital expenditure to the minimum possible in view of the imminent relocation). Construction is well under way, with the site expected to be up and running by late 2019. We currently forecast capex costs of £8.5m in FY18, £27m in FY19 and £2m in FY20, or £37.5m in total, with a further £5m of disposal proceeds in FY21-22 as the old site is divested, hence bringing the total project cost within the £30-35m range.
The new facility has been carefully planned. The buildings have been designed with the future in mind, in order to accommodate medium-term growth, combined with the option of modular expansion in the longer term.
The US site expansion in Florida is capacity-driven, as the business continues to grow at an impressive pace. The 60,000 sq ft expansion will allow for growth in key areas such as Operations, Administration and Technical. As with the UK relocation, the expansion has taken into account future needs and there is c 40,000 sq ft additional space to further increase capacity in the longer term, if necessary. The Operations footprint in Florida will grow by over 80% once the expansion is finished (due by the end of the year), providing more manufacturing and storage capacity.
Our FY18 forecasts include $14m of costs associated with the expansion.
Combined, the individual strategies outlined above contribute to the final strategy objective of consistent, sustainable growth in profit. While in the short term gross margins can fluctuate due to cyclical changes in raw material costs (specifically citrus oils), over time the evolution of the portfolio towards higher-margin, higher value-added ingredient solutions suggests gross margins should continue to rise over the medium term. We forecast gross margins up 40bp in FY18 as we do not expect any significant fluctuations.
Management commitment to contain fixed costs is equally clear; as such, management views an EBIT margin in the mid-teens as achievable in the medium term, versus our forecast for FY18 of 12.1% and our DCF terminal EBIT margin assumption of 16.5%.
While M&A could prove to be a value-added opportunity in the medium to long term, in the near term management believes that enough opportunity exists in executing on its organic strategy, without the inevitable distraction of exploring external opportunities. In addition, the relocation of the UK business and the expansion in the US are likely to use much of the available management resource over the next couple of years.
Due to its background as a trader in raw material ingredients and the breadth of the product range it offers to customers, Treatt is exposed to a wide range of commodities. In general, this means that fluctuations in commodity prices tend to even out across the portfolio, as a ‘natural hedge’. The exception, however, is the group’s sizeable exposure to citrus oils, mainly orange and lemon. In the event of a price spike across all commodities, the ingredients space has generally shown some resilience and has demonstrated some pricing power, as flavours represent a tiny portion of raw material costs for their clients (the consumer companies), which have therefore been more accommodating with price increases. Again however, the value-added end of the spectrum has more pricing power.
Citrus oils represent c 60% of Treatt’s raw materials expenditure. Orange oil is a non exchange-traded commodity, so its supply is managed by Treatt’s highly skilled stock teams in the US and UK, with their deep market knowledge and expertise adding value to customers by consistently ensuring best prices and consistency of supply.
95% of Treatt’s supply of orange oil comes from two key markets – Brazil and Florida – yet both markets have been negatively affected in recent years by disease and adverse weather patterns that have reduced both the quantities of oranges grown and the quality of the overall crop. Orange oil is a by-product of orange juice, extracted through the process of centrifugation. Despite being a by-product, there is no direct relationship between the price of orange oil and the publicly traded price of orange juice. This is because the key determinant of price is not simply the quantity of fruit grown in any one growing season, but rather the complex interaction of a number of influences, driven in the main by the amount of fruit that the processors need to buy to produce the quantities of juice they need to satisfy demand. The current influences on the price of orange oil are:
■
Florida production is expected to be the lowest crop in 70 years following hurricane Irma. In addition, citrus greening (HLB, or yellow shoot disease) continues to have a significant impact on the Florida crop and this affects the colour of the orange oil (turning it green).
■
The Brazilian crop was up 63% on last year’s dismal volumes, and the quality has been average to good. The 2018/19 crop, however, is already forecast to be down 25% on 2017/18.
While prices have moderated since the elevated levels of 2015 (when prices reached $10/kg vs the long-term average of $2-3/kg), they remain at a heightened $8-9/kg. Management is expecting citrus oil prices to soften slightly through FY18.
The lemon oil market, on the other hand, is witnessing some inflation. Supply from Spain and Italy was in line with expectations, but both Spanish and Italian prices for fruit remained very high. The Argentinean season has yet to start, but the output should provide some respite, although exports to North America begin this year and could therefore cause fruit prices to increase. Management expects pricing to be slightly below that of last year, but to remain stable.
The group’s deep insight into the markets of both commodities has very clearly helped it navigate the worst of the volatility, and gives a significant value-added service to customers who may not have a similar level of insight. Increasingly, Treatt is looking to secure longer-term contracts from both customers and suppliers to smooth out volatility in raw material procurement and revenues, thus hoping to reduce volatility in group gross margin.
The principal foreign exchange risk is sterling/US dollar, which affects the company from both a transactional and a translational point of view:
■
Transactional: raw materials (including orange oil) are mainly purchased in US dollars, thus affecting the cash values of sales and the gross margin if subsequently sold in a different currency. Movements in the US dollar can also affect the replacement cost of stock, which can and does have an impact on profitability as well as competitiveness.
■
Translational: sales are made to more than 90 countries, thus fluctuation in the sterling exchange rate can affect reported revenues, gross profit and operating costs.
To try to mitigate the main sterling/US dollar exposure, Treatt has a policy of maintaining the majority of its cash balances – including group overdraft facilities – in US dollars and, to a lesser extent, in euros, as this is a cost-effective way of providing a natural hedge. In addition, the company takes out forward FX contracts to hedge the risk.
H118 revenues were up 14%, profit before tax was up 20% on an adjusted basis, and adjusted EPS was up 30%. The key product categories of sugar reduction and tea both posted impressive sales growth, at 15% and 38% respectively. Citrus – the third key category – was up 10% in revenue terms and Treatt continues to gain share in this more mature market. The citrus business is now operated through a category management structure, which embodies all functions across the global business and hence helps to operate the segment more effectively. All product categories performed well, including the range of natural, fruit and vegetable extracts, which are used to give the fresh authentic flavour in premium beverages.
During H118, the group witnessed strong growth in its two largest markets by geography, with UK revenues up 45% and US revenues up 25% at constant currency. Work on the US expansion continues on schedule, and should be completed by 2018 as planned.
Net cash stood at £6.5m at the end of H118, and during H218 the business is likely to experience the usual seasonal cash inflow as working capital positions unwind. The cost of the UK relocation, and US expansion, however, will counter this. We currently forecast £19m of expenditure on these two projects in FY18. The balance sheet will be strengthened once the Earthoil Plantations sale completes, and of course the cash inflow from the equity fund-raising in November will also strengthen the end-FY18 financial position.
Earthoil Plantations sale
The business specialises in the supply of pure, organic, fair trade essential and cold-pressed vegetable seed oils for the personal care and cosmetics industries. It was deemed to have become non-core, as Treatt focuses increasingly on food and beverages (and specifically its three key categories of citrus, sugar reduction and tea), rather than personal care. The asset is being sold for £11m to Univar, and is expected to complete at the end of May 2018. The business had revenues of £7.7m and pre-tax profit of £1.18m for FY17, and we calculate the sale to be very slightly dilutive to earnings in FY18. The proceeds of the disposal will be used to pay down existing debt.
We have updated our forecasts to reflect the sale of Earthoil Plantations and, as discussed above, we have rolled forward our DCF to commence in 2019. We illustrate the key changes to our forecasts in the table below. The reduction in sales is a result of the disposal of Earthoil.
Exhibit 6: Old vs new forecasts
|
EPS (p) |
PBT (£000s) |
Sales (£000s) |
|
Old |
New |
% chg |
Old |
New |
% chg |
Old |
New |
% chg |
2018e |
17.3 |
17.2 |
(0.7) |
13,352 |
13,264 |
(0.7) |
117,301 |
109,301 |
(6.8) |
2019e |
18.7 |
19.1 |
2.4 |
14,380 |
14,732 |
2.4 |
123,166 |
114,766 |
(6.8) |
2020e |
19.9 |
20.1 |
0.7 |
15,366 |
15,480 |
0.7 |
128,093 |
119,357 |
(6.8) |
Source: Edison Investment Research. Note: Adjusted EPS and adjusted PBT are as per the company’s definition.
Exhibit 7: Financial summary
|
|
£000's |
2015 |
2016 |
2017 |
2018e |
2019e |
2020e |
Year end September |
|
|
IFRS |
IFRS |
IFRS |
IFRS |
IFRS |
IFRS |
PROFIT & LOSS |
|
|
|
|
|
|
|
|
Revenue |
|
|
85,934 |
88,040 |
109,627 |
109,301 |
114,766 |
119,357 |
Cost of Sales |
|
|
(66,955) |
(67,639) |
(82,819) |
(82,348) |
(85,892) |
(89,208) |
Gross Profit |
|
|
18,979 |
20,401 |
26,808 |
26,953 |
28,874 |
30,149 |
EBITDA |
|
|
10,307 |
11,604 |
16,307 |
16,370 |
18,901 |
21,289 |
Operating Profit (before amort., except and sbp.) |
|
|
9,063 |
10,257 |
14,908 |
14,549 |
15,722 |
16,594 |
Intangible Amortisation |
|
|
(175) |
(142) |
(137) |
(160) |
(160) |
(160) |
Share based payments |
|
|
(198) |
(566) |
(966) |
(1,185) |
(1,010) |
(1,060) |
Other |
|
|
0 |
0 |
0 |
0 |
0 |
0 |
Operating Profit |
|
|
8,690 |
9,549 |
13,805 |
13,204 |
14,552 |
15,373 |
Net Interest |
|
|
(740) |
(703) |
(913) |
61 |
177 |
98 |
Exceptionals |
|
|
(174) |
(553) |
0 |
3,000 |
0 |
0 |
Profit Before Tax (norm) |
|
|
8,323 |
9,554 |
13,995 |
14,609 |
15,898 |
16,692 |
Profit Before Tax (FRS 3) |
|
|
7,776 |
8,293 |
12,892 |
16,264 |
14,729 |
15,472 |
Profit Before Tax (company) |
|
|
7,950 |
8,846 |
12,892 |
13,264 |
14,729 |
15,472 |
Tax |
|
|
(1,786) |
(2,144) |
(3,347) |
(3,382) |
(3,756) |
(3,945) |
Profit After Tax (norm) |
|
|
6,537 |
7,410 |
10,648 |
11,227 |
12,143 |
12,747 |
Profit After Tax (FRS 3) |
|
|
5,990 |
6,149 |
9,545 |
12,882 |
10,973 |
11,526 |
Discontinued operations |
|
|
|
|
|
175 |
|
|
|
|
|
|
|
|
|
|
|
Average Number of Shares Outstanding (m) |
|
|
51.5 |
51.9 |
52.2 |
57.4 |
57.4 |
57.4 |
EPS - normalised (p) |
|
|
12.7 |
14.3 |
20.4 |
19.6 |
21.1 |
22.2 |
EPS - normalised & fully diluted (p) |
|
|
12.6 |
14.1 |
19.8 |
19.0 |
20.5 |
21.6 |
EPS - (IFRS) (p) |
|
|
11.6 |
11.8 |
18.3 |
22.4 |
19.1 |
20.1 |
Dividend per share (p) |
|
|
4.0 |
4.4 |
4.8 |
5.0 |
5.6 |
5.8 |
|
|
|
|
|
|
|
|
|
Gross Margin (%) |
|
|
22.1 |
23.2 |
24.5 |
24.7 |
25.2 |
25.3 |
EBITDA Margin (%) |
|
|
12.0 |
13.2 |
14.9 |
15.0 |
16.5 |
17.8 |
Operating Margin (before GW and except.) (%) |
|
|
10.5 |
11.7 |
13.6 |
13.3 |
13.7 |
13.9 |
|
|
|
|
|
|
|
|
|
BALANCE SHEET |
|
|
|
|
|
|
|
|
Fixed Assets |
|
|
13,381 |
16,161 |
19,532 |
31,190 |
56,572 |
55,507 |
Intangible Assets |
|
|
1,736 |
3,364 |
3,331 |
3,171 |
3,011 |
2,851 |
Tangible Assets |
|
|
10,998 |
11,361 |
14,821 |
26,639 |
52,181 |
51,276 |
Investments |
|
|
647 |
1,436 |
1,380 |
1,380 |
1,380 |
1,380 |
Current Assets |
|
|
45,045 |
54,435 |
68,230 |
66,756 |
69,398 |
71,506 |
Stocks |
|
|
25,799 |
29,990 |
42,878 |
42,313 |
44,199 |
45,729 |
Debtors |
|
|
17,635 |
17,853 |
19,973 |
19,695 |
20,450 |
21,029 |
Cash |
|
|
1,477 |
6,588 |
4,748 |
4,748 |
4,748 |
4,748 |
Other |
|
|
134 |
4 |
631 |
0 |
0 |
0 |
Current Liabilities |
|
|
(13,481) |
(16,388) |
(27,003) |
(13,095) |
(25,472) |
(20,345) |
Creditors |
|
|
(12,675) |
(15,834) |
(19,266) |
(22,118) |
(23,224) |
(24,153) |
Short term borrowings |
|
|
(567) |
(487) |
(7,680) |
9,023 |
(2,247) |
3,809 |
Provisions |
|
|
(239) |
(67) |
(57) |
0 |
0 |
0 |
Long Term Liabilities |
|
|
(11,760) |
(17,021) |
(14,281) |
(2,873) |
(8,309) |
(5,081) |
Long term borrowings |
|
|
(7,065) |
(7,755) |
(7,293) |
4,512 |
(1,124) |
1,904 |
Other long term liabilities |
|
|
(4,695) |
(9,266) |
(6,988) |
(7,385) |
(7,185) |
(6,985) |
Net Assets |
|
|
33,185 |
37,187 |
46,478 |
81,977 |
92,189 |
101,588 |
|
|
|
|
|
|
|
|
|
CASH FLOW |
|
|
|
|
|
|
|
|
Operating Cash Flow |
|
|
8,667 |
10,804 |
4,683 |
24,316 |
17,166 |
19,909 |
Net Interest |
|
|
(740) |
(703) |
(913) |
61 |
177 |
98 |
Tax |
|
|
(1,469) |
(2,022) |
(2,822) |
(3,382) |
(3,756) |
(3,945) |
Capex |
|
|
(924) |
(679) |
(5,111) |
(20,640) |
(28,721) |
(3,790) |
Acquisitions/disposals |
|
|
(103) |
(861) |
(1,667) |
9,900 |
1,100 |
0 |
Financing |
|
|
147 |
280 |
270 |
20,759 |
0 |
0 |
Dividends |
|
|
(1,978) |
(2,095) |
(3,025) |
(2,506) |
(2,871) |
(3,188) |
Net Cash Flow |
|
|
3,600 |
4,724 |
(8,585) |
28,508 |
(16,906) |
9,084 |
Opening net debt/(cash) |
|
|
9,584 |
6,155 |
1,654 |
10,225 |
(18,283) |
(1,377) |
HP finance leases initiated |
|
|
0 |
0 |
0 |
0 |
0 |
0 |
Other |
|
|
(171) |
(223) |
14 |
0 |
0 |
0 |
Closing net debt/(cash) |
|
|
6,155 |
1,654 |
10,225 |
(18,283) |
(1,377) |
(10,461) |
Source: Edison Investment Research, company data
Contact details |
Revenue by geography |
Northern Way
Bury St Edmunds
IP32 6NL
UK
+44 (0)1284 702500
www.treatt.com |

|
Contact details |
Northern Way
Bury St Edmunds
IP32 6NL
UK
+44 (0)1284 702500
www.treatt.com |
Revenue by geography |
|
Management team |
|
CEO: Daemmon Reeve |
CFO: Richard Hope |
Daemmon Reeve has extensive industry experience and knowledge, having worked at RC Treatt in the UK from 1991-2010, gaining widespread experience across technical, operational, and sales and purchasing disciplines. In July 2010, he was appointed CEO of Treatt USA and CEO of the group in July 2012, filling Hugo Bovill’s position after he stepped down. |
Richard Hope was appointed group finance director in May 2003, having been head of finance at Hampshire Cosmetics between 1996 and 2003. He is a qualified chartered accountant. |
Management team |
CEO: Daemmon Reeve |
Daemmon Reeve has extensive industry experience and knowledge, having worked at RC Treatt in the UK from 1991-2010, gaining widespread experience across technical, operational, and sales and purchasing disciplines. In July 2010, he was appointed CEO of Treatt USA and CEO of the group in July 2012, filling Hugo Bovill’s position after he stepped down. |
CFO: Richard Hope |
Richard Hope was appointed group finance director in May 2003, having been head of finance at Hampshire Cosmetics between 1996 and 2003. He is a qualified chartered accountant. |
Principal shareholders |
(%) |
BlackRock Investment Management |
9.26 |
Discretionary Unit Fund Managers |
8.25 |
Hargreave Hale |
6.16 |
Miton Asset Management |
4.99 |
Schroder Investment Management |
3.96 |
F&C Asset Managers |
3.15 |
James Sharp & Co. |
3.09 |
|
Companies named in this report |
IFF (IFF), Givaudan (GIVN:SW), Symrise (SY1:GR), Christian Hansen (CHR:DC), Kerry (KYGa.L), Frutarom (FRUT:IT), Ingredion (INGR), Naturex (NRX:FP |
|
Edison is an investment research and advisory company, with offices in North America, Europe, the Middle East and AsiaPac. The heart of Edison is our world-renowned equity research platform and deep multi-sector expertise. At Edison Investment Research, our research is widely read by international investors, advisers and stakeholders. Edison Advisors leverages our core research platform to provide differentiated services including investor relations and strategic consulting. Edison is authorised and regulated by the Financial Conduct Authority. Edison Investment Research (NZ) Limited (Edison NZ) is the New Zealand subsidiary of Edison. Edison NZ is registered on the New Zealand Financial Service Providers Register (FSP number 247505) and is registered to provide wholesale and/or generic financial adviser services only. Edison Investment Research Inc (Edison US) is the US subsidiary of Edison and is regulated by the Securities and Exchange Commission. Edison Investment Research Pty Limited (Edison Aus) [46085869] is the Australian subsidiary of Edison. Edison Germany is a branch entity of Edison Investment Research Limited [4794244]. www.edisongroup.com DISCLAIMER
Copyright 2018 Edison Investment Research Limited. All rights reserved. This report has been commissioned by Treatt and prepared and issued by Edison for publication globally. All information used in the publication of this report has been compiled from publicly available sources that are believed to be reliable, however we do not guarantee the accuracy or completeness of this report. Opinions contained in this report represent those of the research department of Edison at the time of publication. The securities described in the Investment Research may not be eligible for sale in all jurisdictions or to certain categories of investors. This research is issued in Australia by Edison Investment Research Pty Ltd (Corporate Authorised Representative (1252501) of Myonlineadvisers Pty Ltd (AFSL: 427484)) and any access to it, is intended only for "wholesale clients" within the meaning of the Corporations Act 2001 of Australia. The Investment Research is distributed in the United States by Edison US to major US institutional investors only. Edison US is registered as an investment adviser with the Securities and Exchange Commission. Edison US relies upon the "publishers' exclusion" from the definition of investment adviser under Section 202(a)(11) of the Investment Advisers Act of 1940 and corresponding state securities laws. As such, Edison does not offer or provide personalised advice. We publish information about companies in which we believe our readers may be interested and this information reflects our sincere opinions. The information that we provide or that is derived from our website is not intended to be, and should not be construed in any manner whatsoever as, personalised advice. Also, our website and the information provided by us should not be construed by any subscriber or prospective subscriber as Edison’s solicitation to effect, or attempt to effect, any transaction in a security. The research in this document is intended for New Zealand resident professional financial advisers or brokers (for use in their roles as financial advisers or brokers) and habitual investors who are “wholesale clients” for the purpose of the Financial Advisers Act 2008 (FAA) (as described in sections 5(c) (1)(a), (b) and (c) of the FAA). This is not a solicitation or inducement to buy, sell, subscribe, or underwrite any securities mentioned or in the topic of this document. This document is provided for information purposes only and should not be construed as an offer or solicitation for investment in any securities mentioned or in the topic of this document. A marketing communication under FCA Rules, this document has not been prepared in accordance with the legal requirements designed to promote the independence of investment research and is not subject to any prohibition on dealing ahead of the dissemination of investment research. Edison has a restrictive policy relating to personal dealing. Edison Group does not conduct any investment business and, accordingly, does not itself hold any positions in the securities mentioned in this report. However, the respective directors, officers, employees and contractors of Edison may have a position in any or related securities mentioned in this report. Edison or its affiliates may perform services or solicit business from any of the companies mentioned in this report. The value of securities mentioned in this report can fall as well as rise and are subject to large and sudden swings. In addition it may be difficult or not possible to buy, sell or obtain accurate information about the value of securities mentioned in this report. Past performance is not necessarily a guide to future performance. Forward-looking information or statements in this report contain information that is based on assumptions, forecasts of future results, estimates of amounts not yet determinable, and therefore involve known and unknown risks, uncertainties and other factors which may cause the actual results, performance or achievements of their subject matter to be materially different from current expectations. For the purpose of the FAA, the content of this report is of a general nature, is intended as a source of general information only and is not intended to constitute a recommendation or opinion in relation to acquiring or disposing (including refraining from acquiring or disposing) of securities. The distribution of this document is not a “personalised service” and, to the extent that it contains any financial advice, is intended only as a “class service” provided by Edison within the meaning of the FAA (ie without taking into account the particular financial situation or goals of any person). As such, it should not be relied upon in making an investment decision. To the maximum extent permitted by law, Edison, its affiliates and contractors, and their respective directors, officers and employees will not be liable for any loss or damage arising as a result of reliance being placed on any of the information contained in this report and do not guarantee the returns on investments in the products discussed in this publication. FTSE International Limited (“FTSE”) © FTSE 2018. “FTSE®” is a trade mark of the London Stock Exchange Group companies and is used by FTSE International Limited under license. All rights in the FTSE indices and/or FTSE ratings vest in FTSE and/or its licensors. Neither FTSE nor its licensors accept any liability for any errors or omissions in the FTSE indices and/or FTSE ratings or underlying data. No further distribution of FTSE Data is permitted without FTSE’s express written consent. |
Frankfurt +49 (0)69 78 8076 960 Schumannstrasse 34b 60325 Frankfurt Germany |
London +44 (0)20 3077 5700 280 High Holborn London, WC1V 7EE United Kingdom |
New York +1 646 653 7026 295 Madison Avenue, 18th Floor 10017, New York US |
Sydney +61 (0)2 8249 8342 Level 12, Office 1205 95 Pitt Street, Sydney NSW 2000, Australia |
Frankfurt +49 (0)69 78 8076 960 Schumannstrasse 34b 60325 Frankfurt Germany |
London +44 (0)20 3077 5700 280 High Holborn London, WC1V 7EE United Kingdom |
New York +1 646 653 7026 295 Madison Avenue, 18th Floor 10017, New York US |
Sydney +61 (0)2 8249 8342 Level 12, Office 1205 95 Pitt Street, Sydney NSW 2000, Australia |
|
Edison is an investment research and advisory company, with offices in North America, Europe, the Middle East and AsiaPac. The heart of Edison is our world-renowned equity research platform and deep multi-sector expertise. At Edison Investment Research, our research is widely read by international investors, advisers and stakeholders. Edison Advisors leverages our core research platform to provide differentiated services including investor relations and strategic consulting. Edison is authorised and regulated by the Financial Conduct Authority. Edison Investment Research (NZ) Limited (Edison NZ) is the New Zealand subsidiary of Edison. Edison NZ is registered on the New Zealand Financial Service Providers Register (FSP number 247505) and is registered to provide wholesale and/or generic financial adviser services only. Edison Investment Research Inc (Edison US) is the US subsidiary of Edison and is regulated by the Securities and Exchange Commission. Edison Investment Research Pty Limited (Edison Aus) [46085869] is the Australian subsidiary of Edison. Edison Germany is a branch entity of Edison Investment Research Limited [4794244]. www.edisongroup.com DISCLAIMER
Copyright 2018 Edison Investment Research Limited. All rights reserved. This report has been commissioned by Treatt and prepared and issued by Edison for publication globally. All information used in the publication of this report has been compiled from publicly available sources that are believed to be reliable, however we do not guarantee the accuracy or completeness of this report. Opinions contained in this report represent those of the research department of Edison at the time of publication. The securities described in the Investment Research may not be eligible for sale in all jurisdictions or to certain categories of investors. This research is issued in Australia by Edison Investment Research Pty Ltd (Corporate Authorised Representative (1252501) of Myonlineadvisers Pty Ltd (AFSL: 427484)) and any access to it, is intended only for "wholesale clients" within the meaning of the Corporations Act 2001 of Australia. The Investment Research is distributed in the United States by Edison US to major US institutional investors only. Edison US is registered as an investment adviser with the Securities and Exchange Commission. Edison US relies upon the "publishers' exclusion" from the definition of investment adviser under Section 202(a)(11) of the Investment Advisers Act of 1940 and corresponding state securities laws. As such, Edison does not offer or provide personalised advice. We publish information about companies in which we believe our readers may be interested and this information reflects our sincere opinions. The information that we provide or that is derived from our website is not intended to be, and should not be construed in any manner whatsoever as, personalised advice. Also, our website and the information provided by us should not be construed by any subscriber or prospective subscriber as Edison’s solicitation to effect, or attempt to effect, any transaction in a security. The research in this document is intended for New Zealand resident professional financial advisers or brokers (for use in their roles as financial advisers or brokers) and habitual investors who are “wholesale clients” for the purpose of the Financial Advisers Act 2008 (FAA) (as described in sections 5(c) (1)(a), (b) and (c) of the FAA). This is not a solicitation or inducement to buy, sell, subscribe, or underwrite any securities mentioned or in the topic of this document. This document is provided for information purposes only and should not be construed as an offer or solicitation for investment in any securities mentioned or in the topic of this document. A marketing communication under FCA Rules, this document has not been prepared in accordance with the legal requirements designed to promote the independence of investment research and is not subject to any prohibition on dealing ahead of the dissemination of investment research. Edison has a restrictive policy relating to personal dealing. Edison Group does not conduct any investment business and, accordingly, does not itself hold any positions in the securities mentioned in this report. However, the respective directors, officers, employees and contractors of Edison may have a position in any or related securities mentioned in this report. Edison or its affiliates may perform services or solicit business from any of the companies mentioned in this report. The value of securities mentioned in this report can fall as well as rise and are subject to large and sudden swings. In addition it may be difficult or not possible to buy, sell or obtain accurate information about the value of securities mentioned in this report. Past performance is not necessarily a guide to future performance. Forward-looking information or statements in this report contain information that is based on assumptions, forecasts of future results, estimates of amounts not yet determinable, and therefore involve known and unknown risks, uncertainties and other factors which may cause the actual results, performance or achievements of their subject matter to be materially different from current expectations. For the purpose of the FAA, the content of this report is of a general nature, is intended as a source of general information only and is not intended to constitute a recommendation or opinion in relation to acquiring or disposing (including refraining from acquiring or disposing) of securities. The distribution of this document is not a “personalised service” and, to the extent that it contains any financial advice, is intended only as a “class service” provided by Edison within the meaning of the FAA (ie without taking into account the particular financial situation or goals of any person). As such, it should not be relied upon in making an investment decision. To the maximum extent permitted by law, Edison, its affiliates and contractors, and their respective directors, officers and employees will not be liable for any loss or damage arising as a result of reliance being placed on any of the information contained in this report and do not guarantee the returns on investments in the products discussed in this publication. FTSE International Limited (“FTSE”) © FTSE 2018. “FTSE®” is a trade mark of the London Stock Exchange Group companies and is used by FTSE International Limited under license. All rights in the FTSE indices and/or FTSE ratings vest in FTSE and/or its licensors. Neither FTSE nor its licensors accept any liability for any errors or omissions in the FTSE indices and/or FTSE ratings or underlying data. No further distribution of FTSE Data is permitted without FTSE’s express written consent. |
Frankfurt +49 (0)69 78 8076 960 Schumannstrasse 34b 60325 Frankfurt Germany |
London +44 (0)20 3077 5700 280 High Holborn London, WC1V 7EE United Kingdom |
New York +1 646 653 7026 295 Madison Avenue, 18th Floor 10017, New York US |
Sydney +61 (0)2 8249 8342 Level 12, Office 1205 95 Pitt Street, Sydney NSW 2000, Australia |
Frankfurt +49 (0)69 78 8076 960 Schumannstrasse 34b 60325 Frankfurt Germany |
London +44 (0)20 3077 5700 280 High Holborn London, WC1V 7EE United Kingdom |
New York +1 646 653 7026 295 Madison Avenue, 18th Floor 10017, New York US |
Sydney +61 (0)2 8249 8342 Level 12, Office 1205 95 Pitt Street, Sydney NSW 2000, Australia |
|